Overview
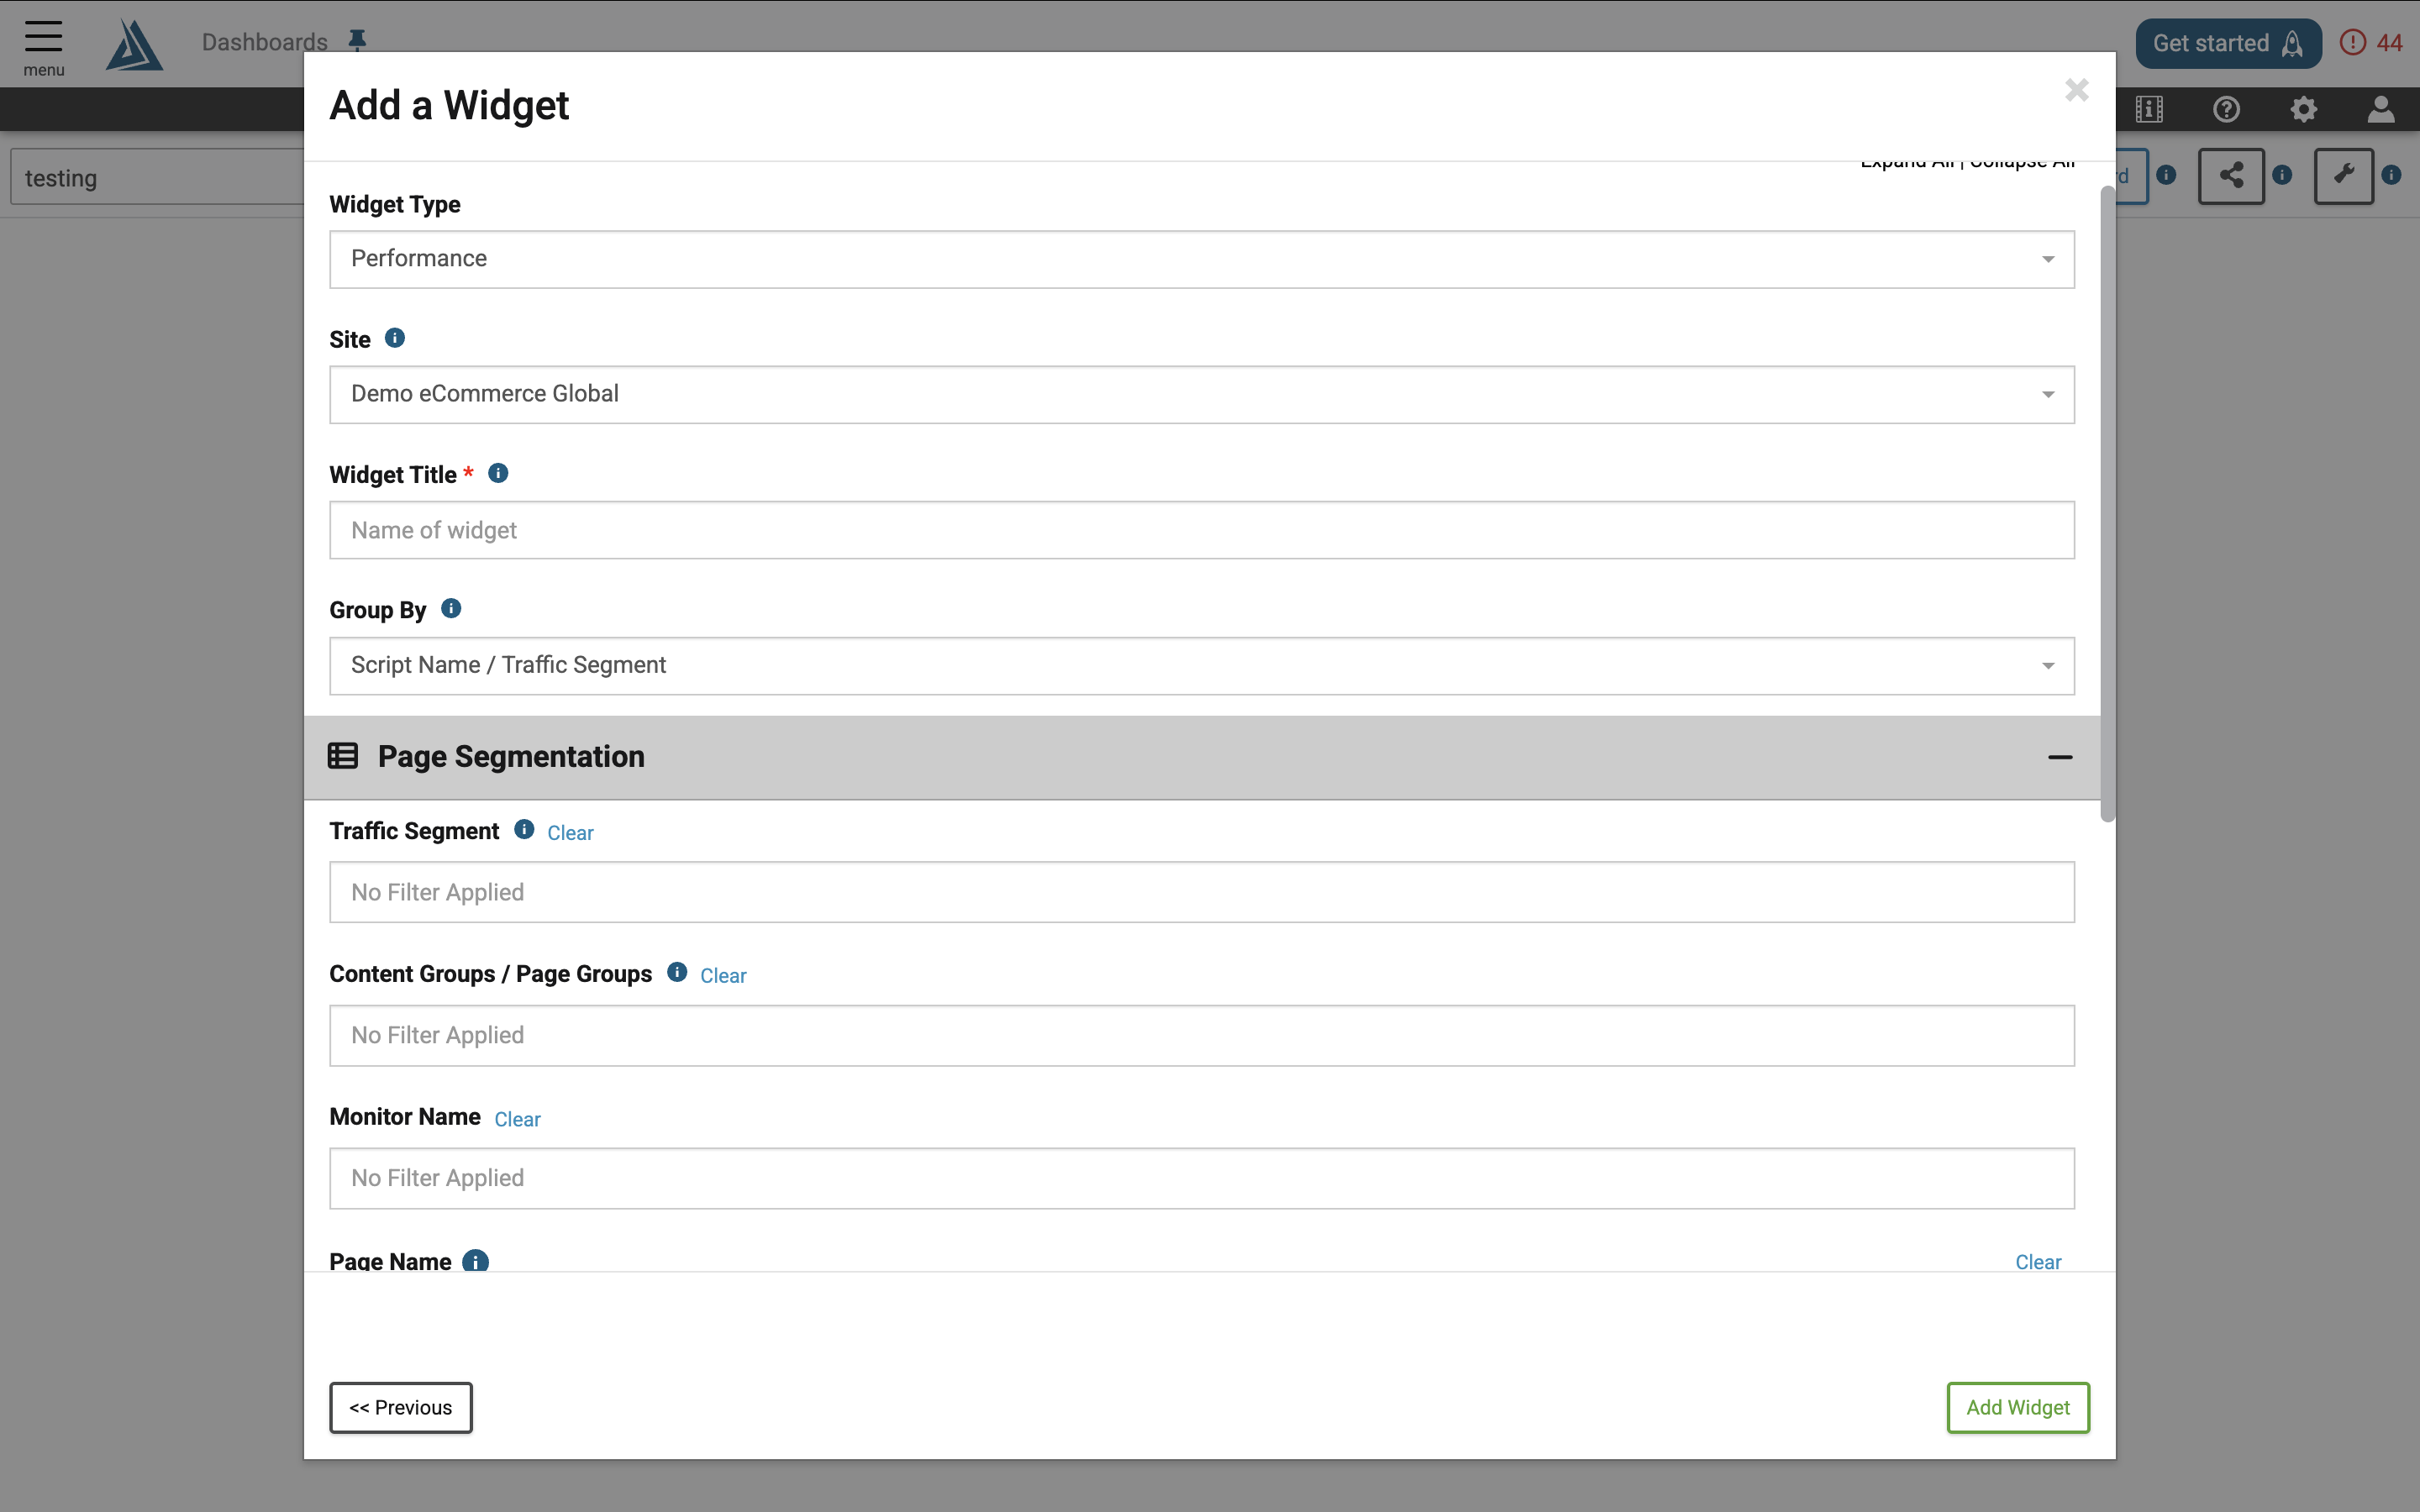
This widget gives you a live scatter plot of your synthetic measurements with the ability to click points and drill into more detail.
When you first load the widget, the scatter plot shows a point for each monitor run. Clicking a scatter plot point opens another scatter plot to the right containing dots for each page in the selected run.
|
This widget is available to be added to custom dashboards. For more information on custom dashboards, please visit How to Create Custom Dashboards, andCustom Dashboard Widgets. |
In each scatter plot, the y-axis number represents the Onload time (for single-page measurements) or the sum of the Onload times (for multi-page measurements).
As you hover your mouse over a point in the left scatter plot, you'll see the following information in the tool-tip:
-
Whether the measurement has a screenshot, filmstrip, or both, and the Name of the Script (i.e. Traffic Segment)
-
Measurement Time
-
Sum of Onload time
-
Test Location
In the scatter plot to the right, the tool-tip has the same information plus: Page/Step Name and HTTP response code.
As the right scatter plot loads, a screenshot loads below for each page in the script. Hovering over the image thumbnails displays the page name in a tool-tip, and clicking the thumbnails opens the image in a new tab.
To revert to the default view, click the button Hide Selected Script. This hides the scatter plot to the right and expands the left scatter plot.
The Red, Yellow and Green coloring of the dots can be configured on the Synthetic Codes page.
|
Note: This scatter plot only shows data for your single-page and multi-page real-browser synthetic measurements. The data for your base page & SSL and multi-step API monitors will not show here. |
Find Widget
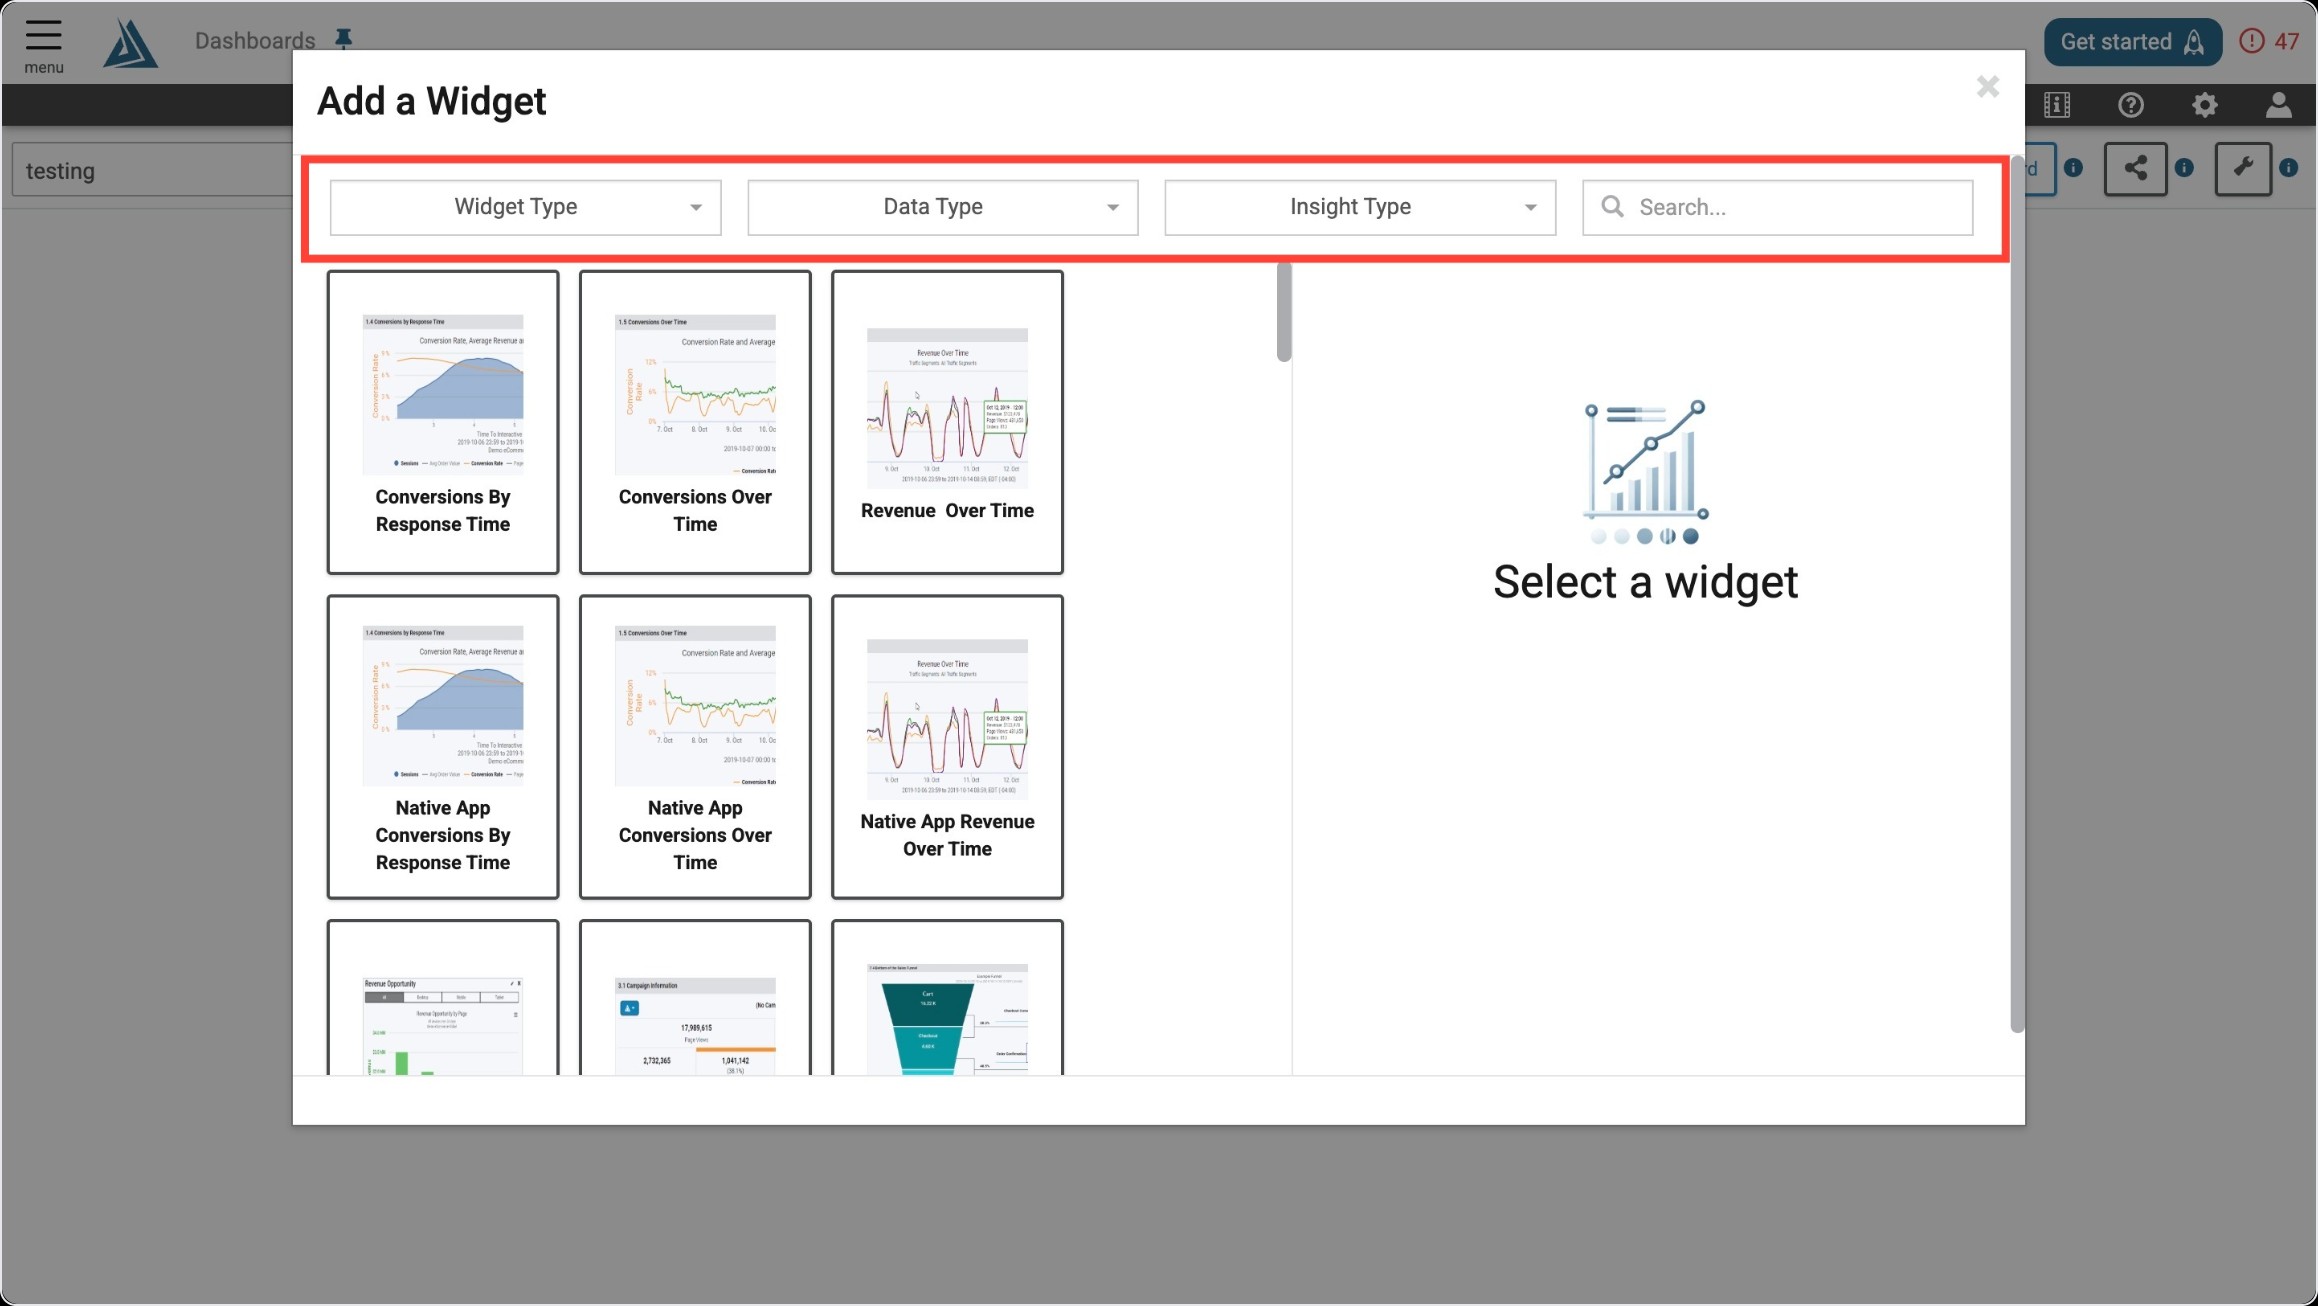
Once you enter the Add a Widget menu, you will see a variety of filter options on top. One way to find the Session Scatter Plot Analysis Widget is to use the filter options listed below.
|
Filter Title |
Filter Option |
|---|---|
|
Widget Type |
Summaries |
|
Data Type |
Synthetic |
|
Insight Type |
Performance |
Another way to find the Session Scatter Plot Analysis Widget is to use the search bar at the top right of the menu.
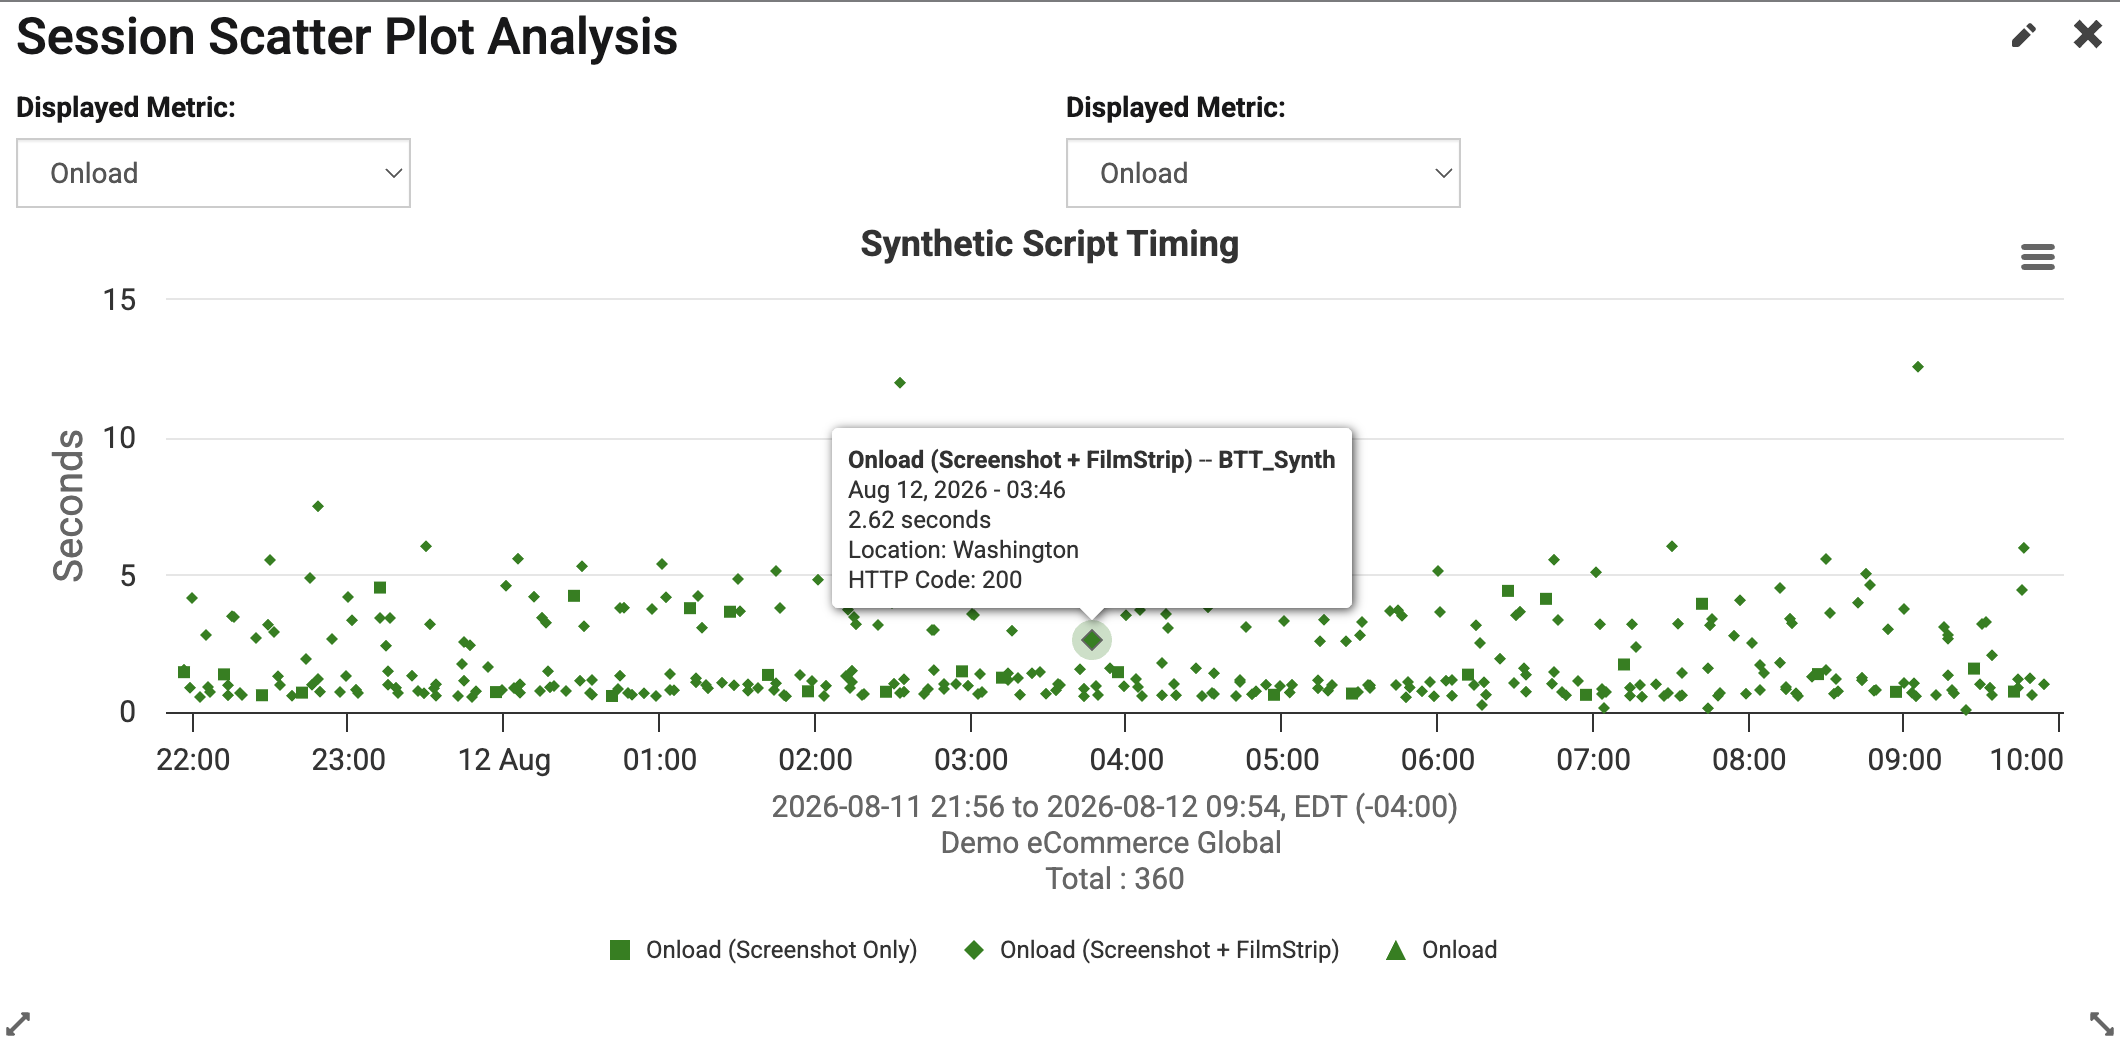
Widget Configuration
The only required configuration for this widget is a title. The Page Segmentation and Geography filters are also available in the configuration window, but can be applied after the widget is created as well.