

Overview
The KPI Date Comparison widget allows you to get a real time comparison of your key performance indicators from a baseline in the past. It's one our most functional dashboard widgets allowing you to customize the exact time period for your comparisons.
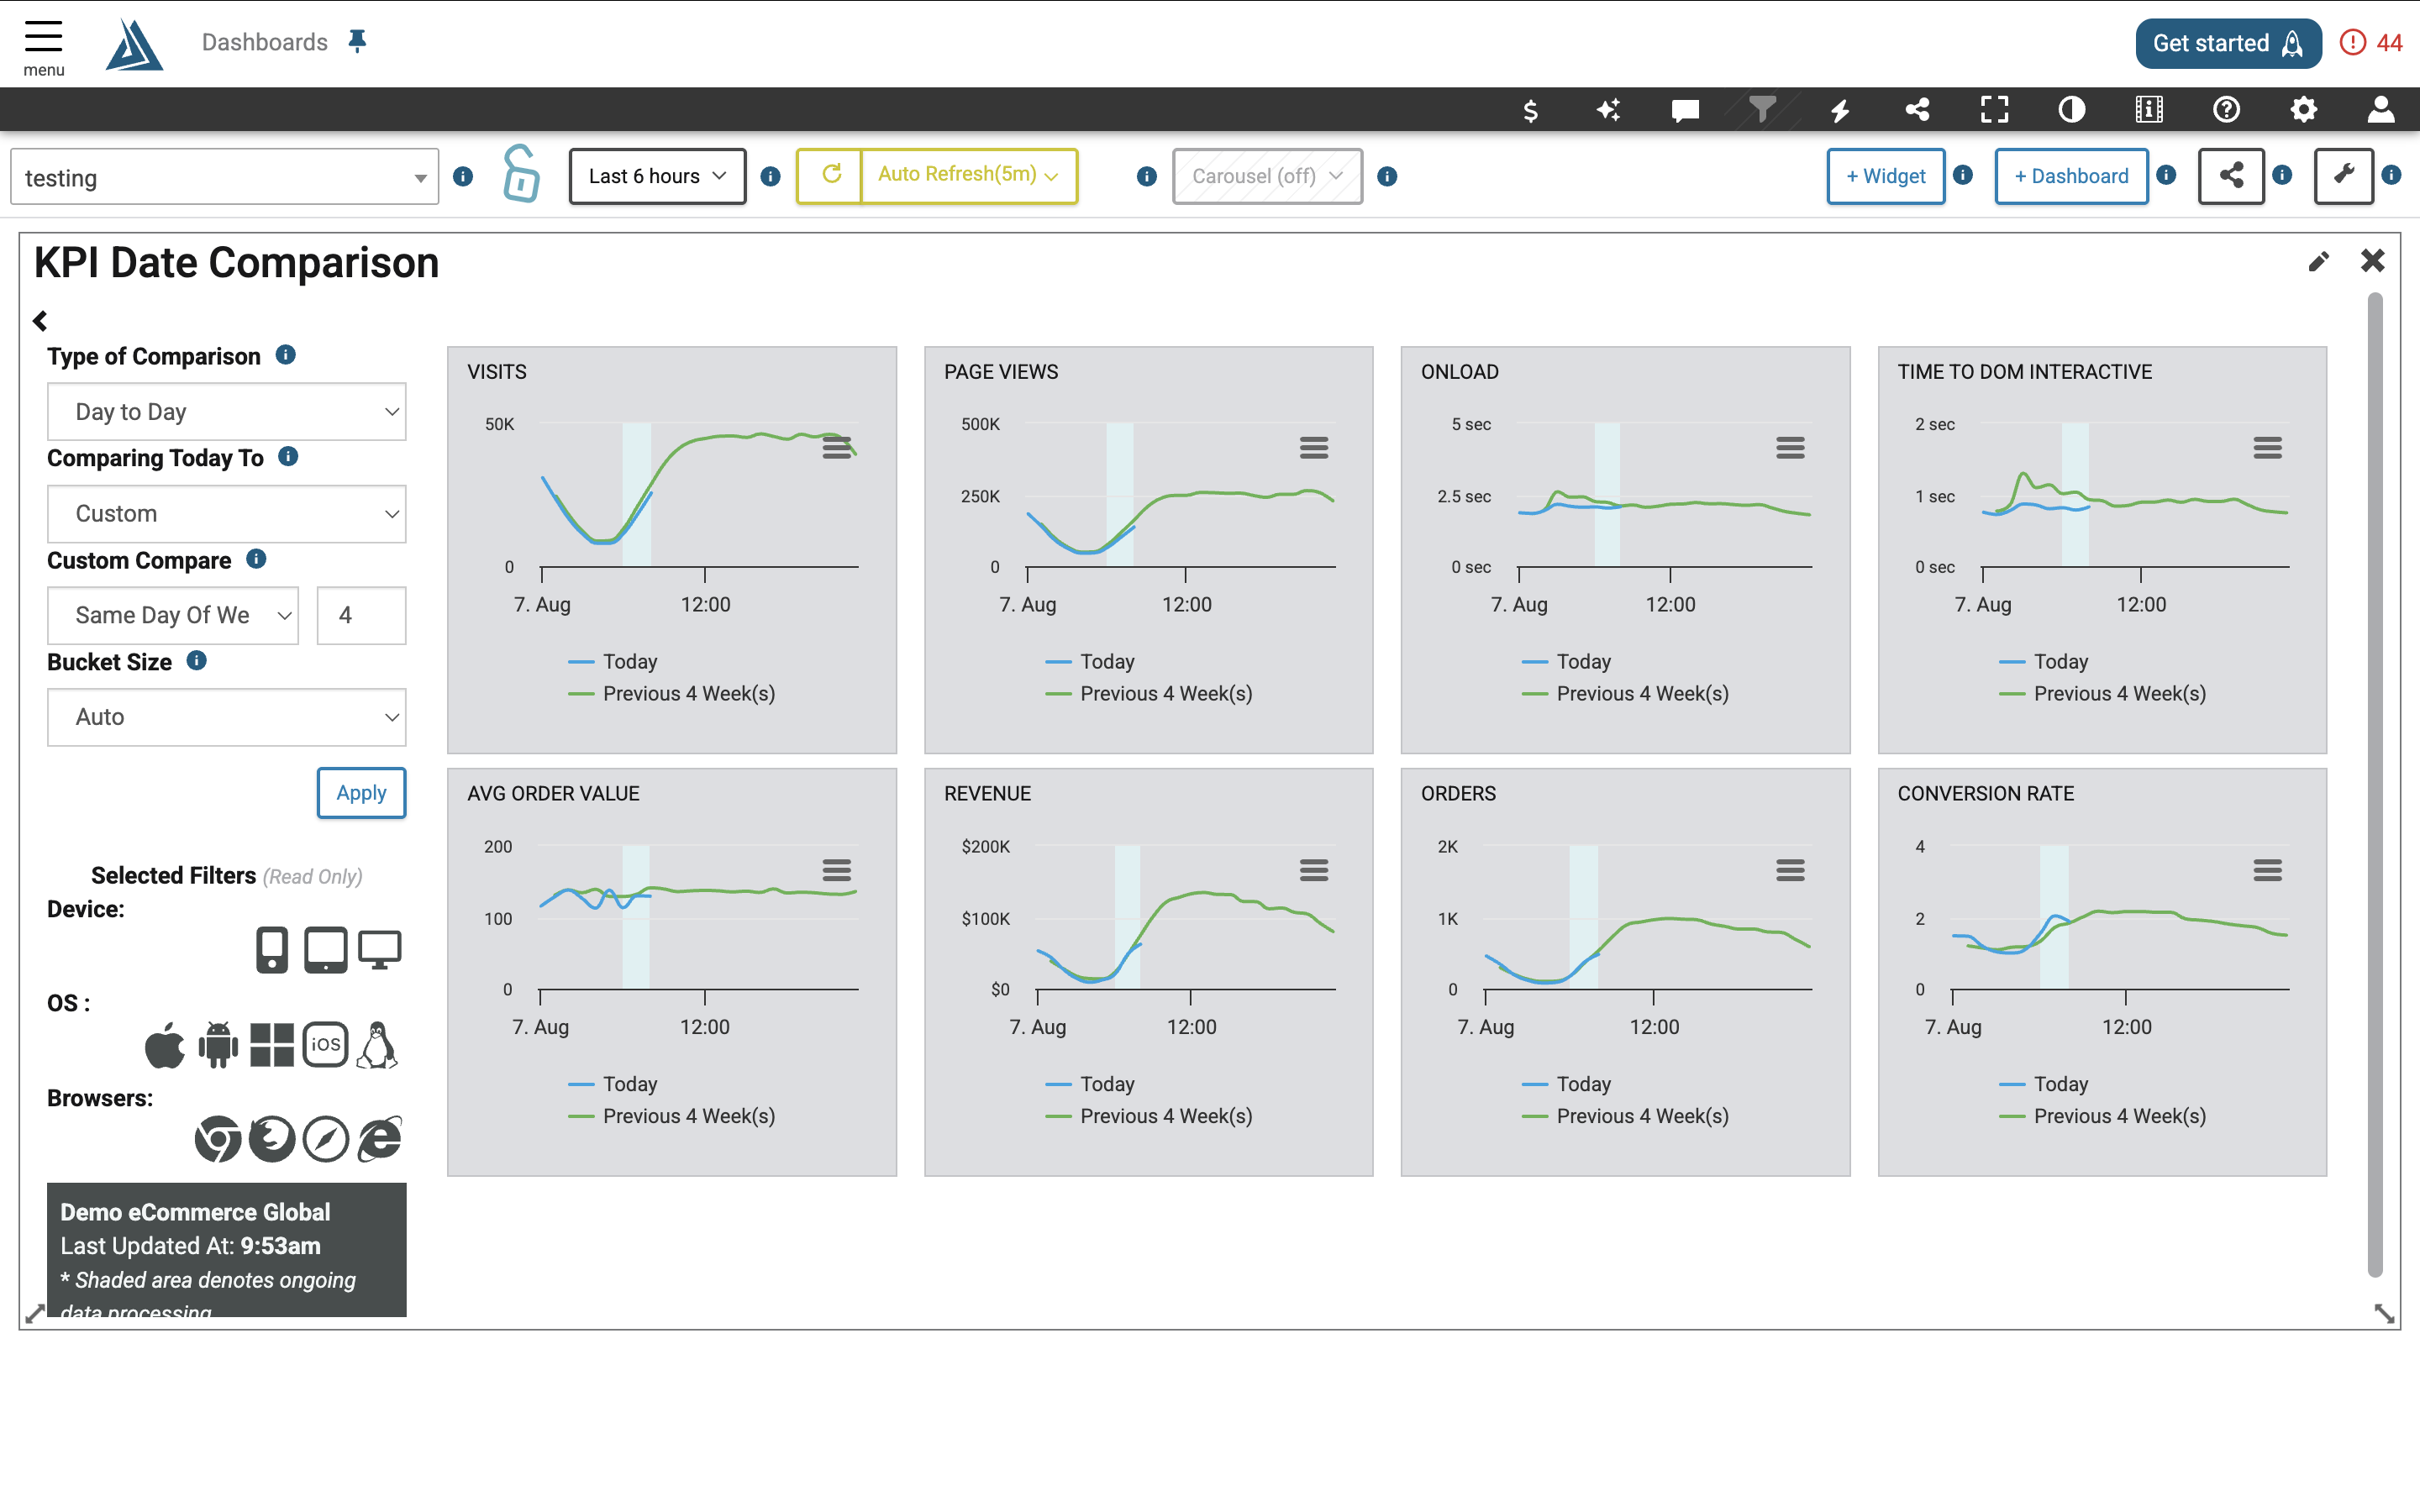
Each measured metric in the comparison has an individual card showing a graph of that metric over time.
Utilized metrics are listed below:
|
|
Hover your mouse over the lines of each graph to get a tool tip reading for the nearest two comparison points.
A shaded region of the graph denotes ongoing data processing, once processing is complete that data will be available in the graph.
When not all data from the current hour has come in yet, the right most data point will show a normalized line denoting the projected number for the hour given the amount of time that has already passed.
If you're using a fixed bucket size (less than an hour) for the "today" line, you'll need to normalize those buckets to meet a comparable height as the line of hourly buckets.
On the left hand side of the widget, you can edit your comparison without going into the filter editing menu and update bucket size (control of the granularity of the graphs - hourly, every 30 min, 15 min, 10 min, 5 min, or 1 min. To optimize screen real estate, click the carrot arrow in the top left of the widget to hide or show this panel.
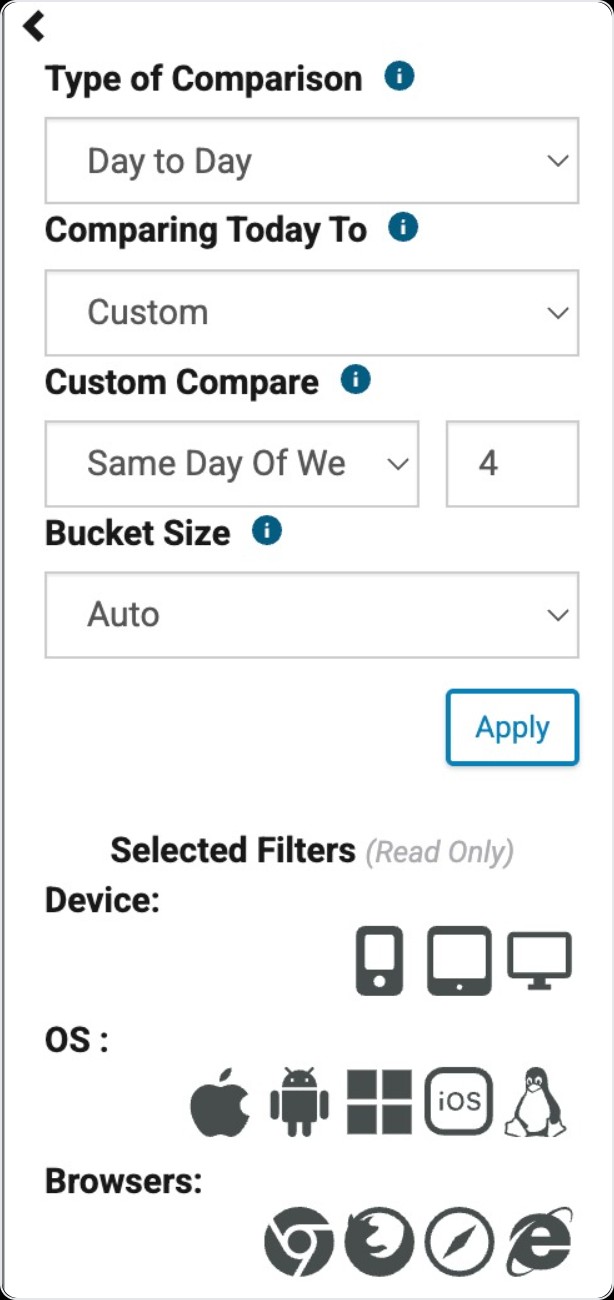
Note: KPI Date Comparison widget does not abide by and operates independently of the Dashboard Time Period selector at the top of the page.
Find Widget
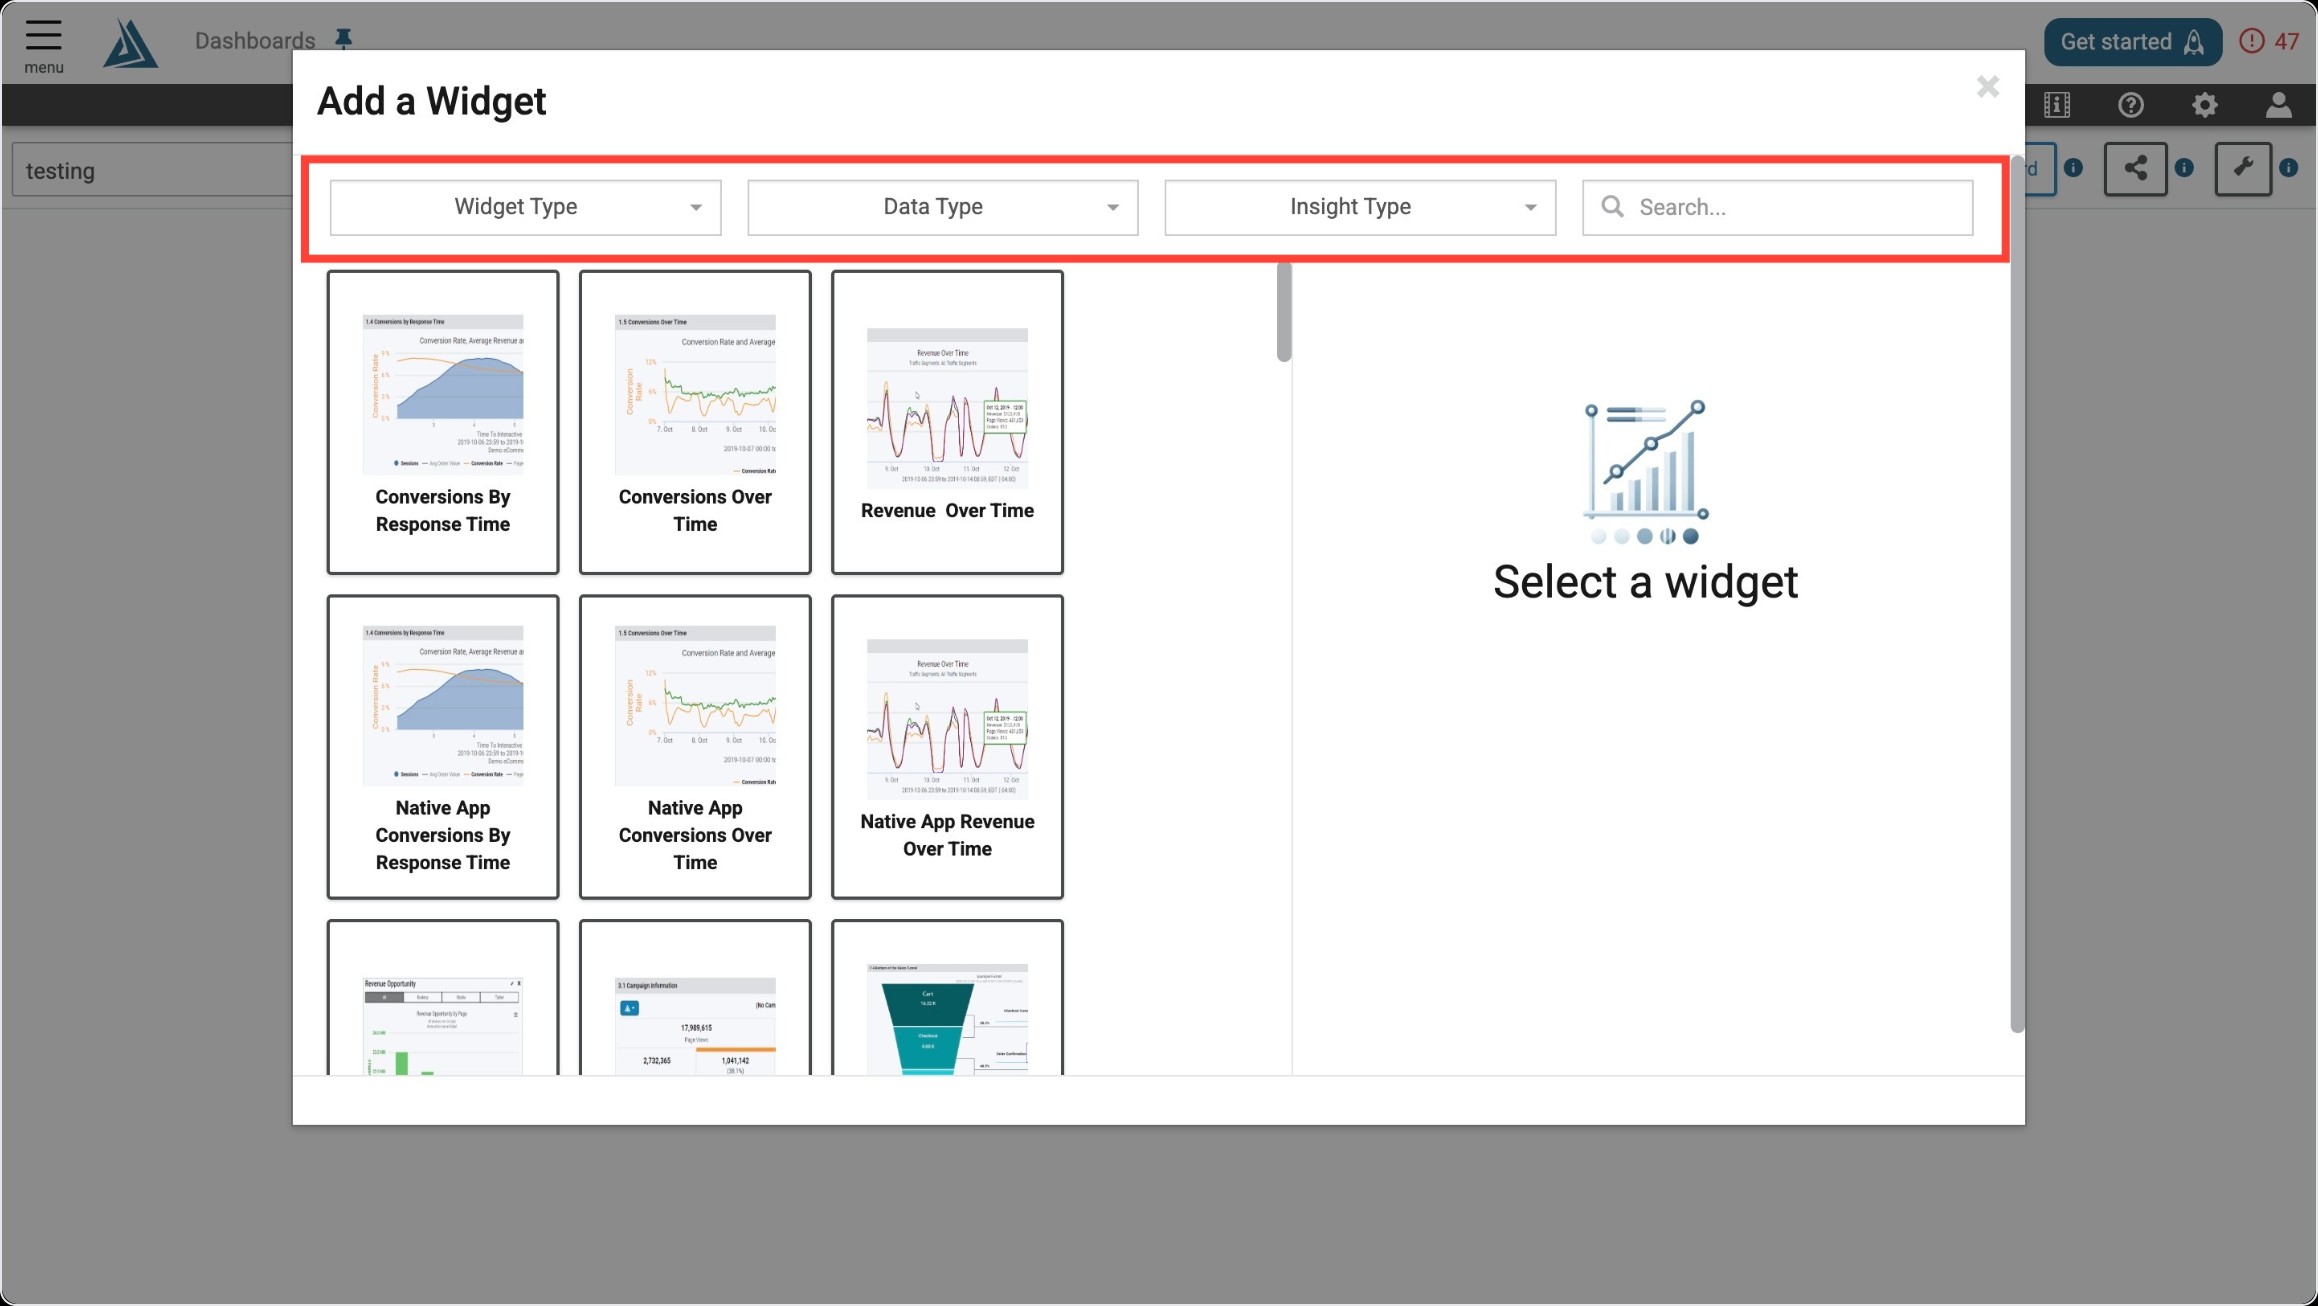
Once you enter the Add a Widget menu, you will see a variety of filter options on top. One way to find the KPI Date Comparison Widget is to use the filter options listed below.
|
Filter Title |
Filter Option |
|---|---|
|
Widget Type |
Comparisons |
|
Data Type |
Real User |
|
Insight Type |
Performance |
Another way to find the KPI Date Comparison Widget is to use the search bar at the top right of the menu.
Widget Configuration
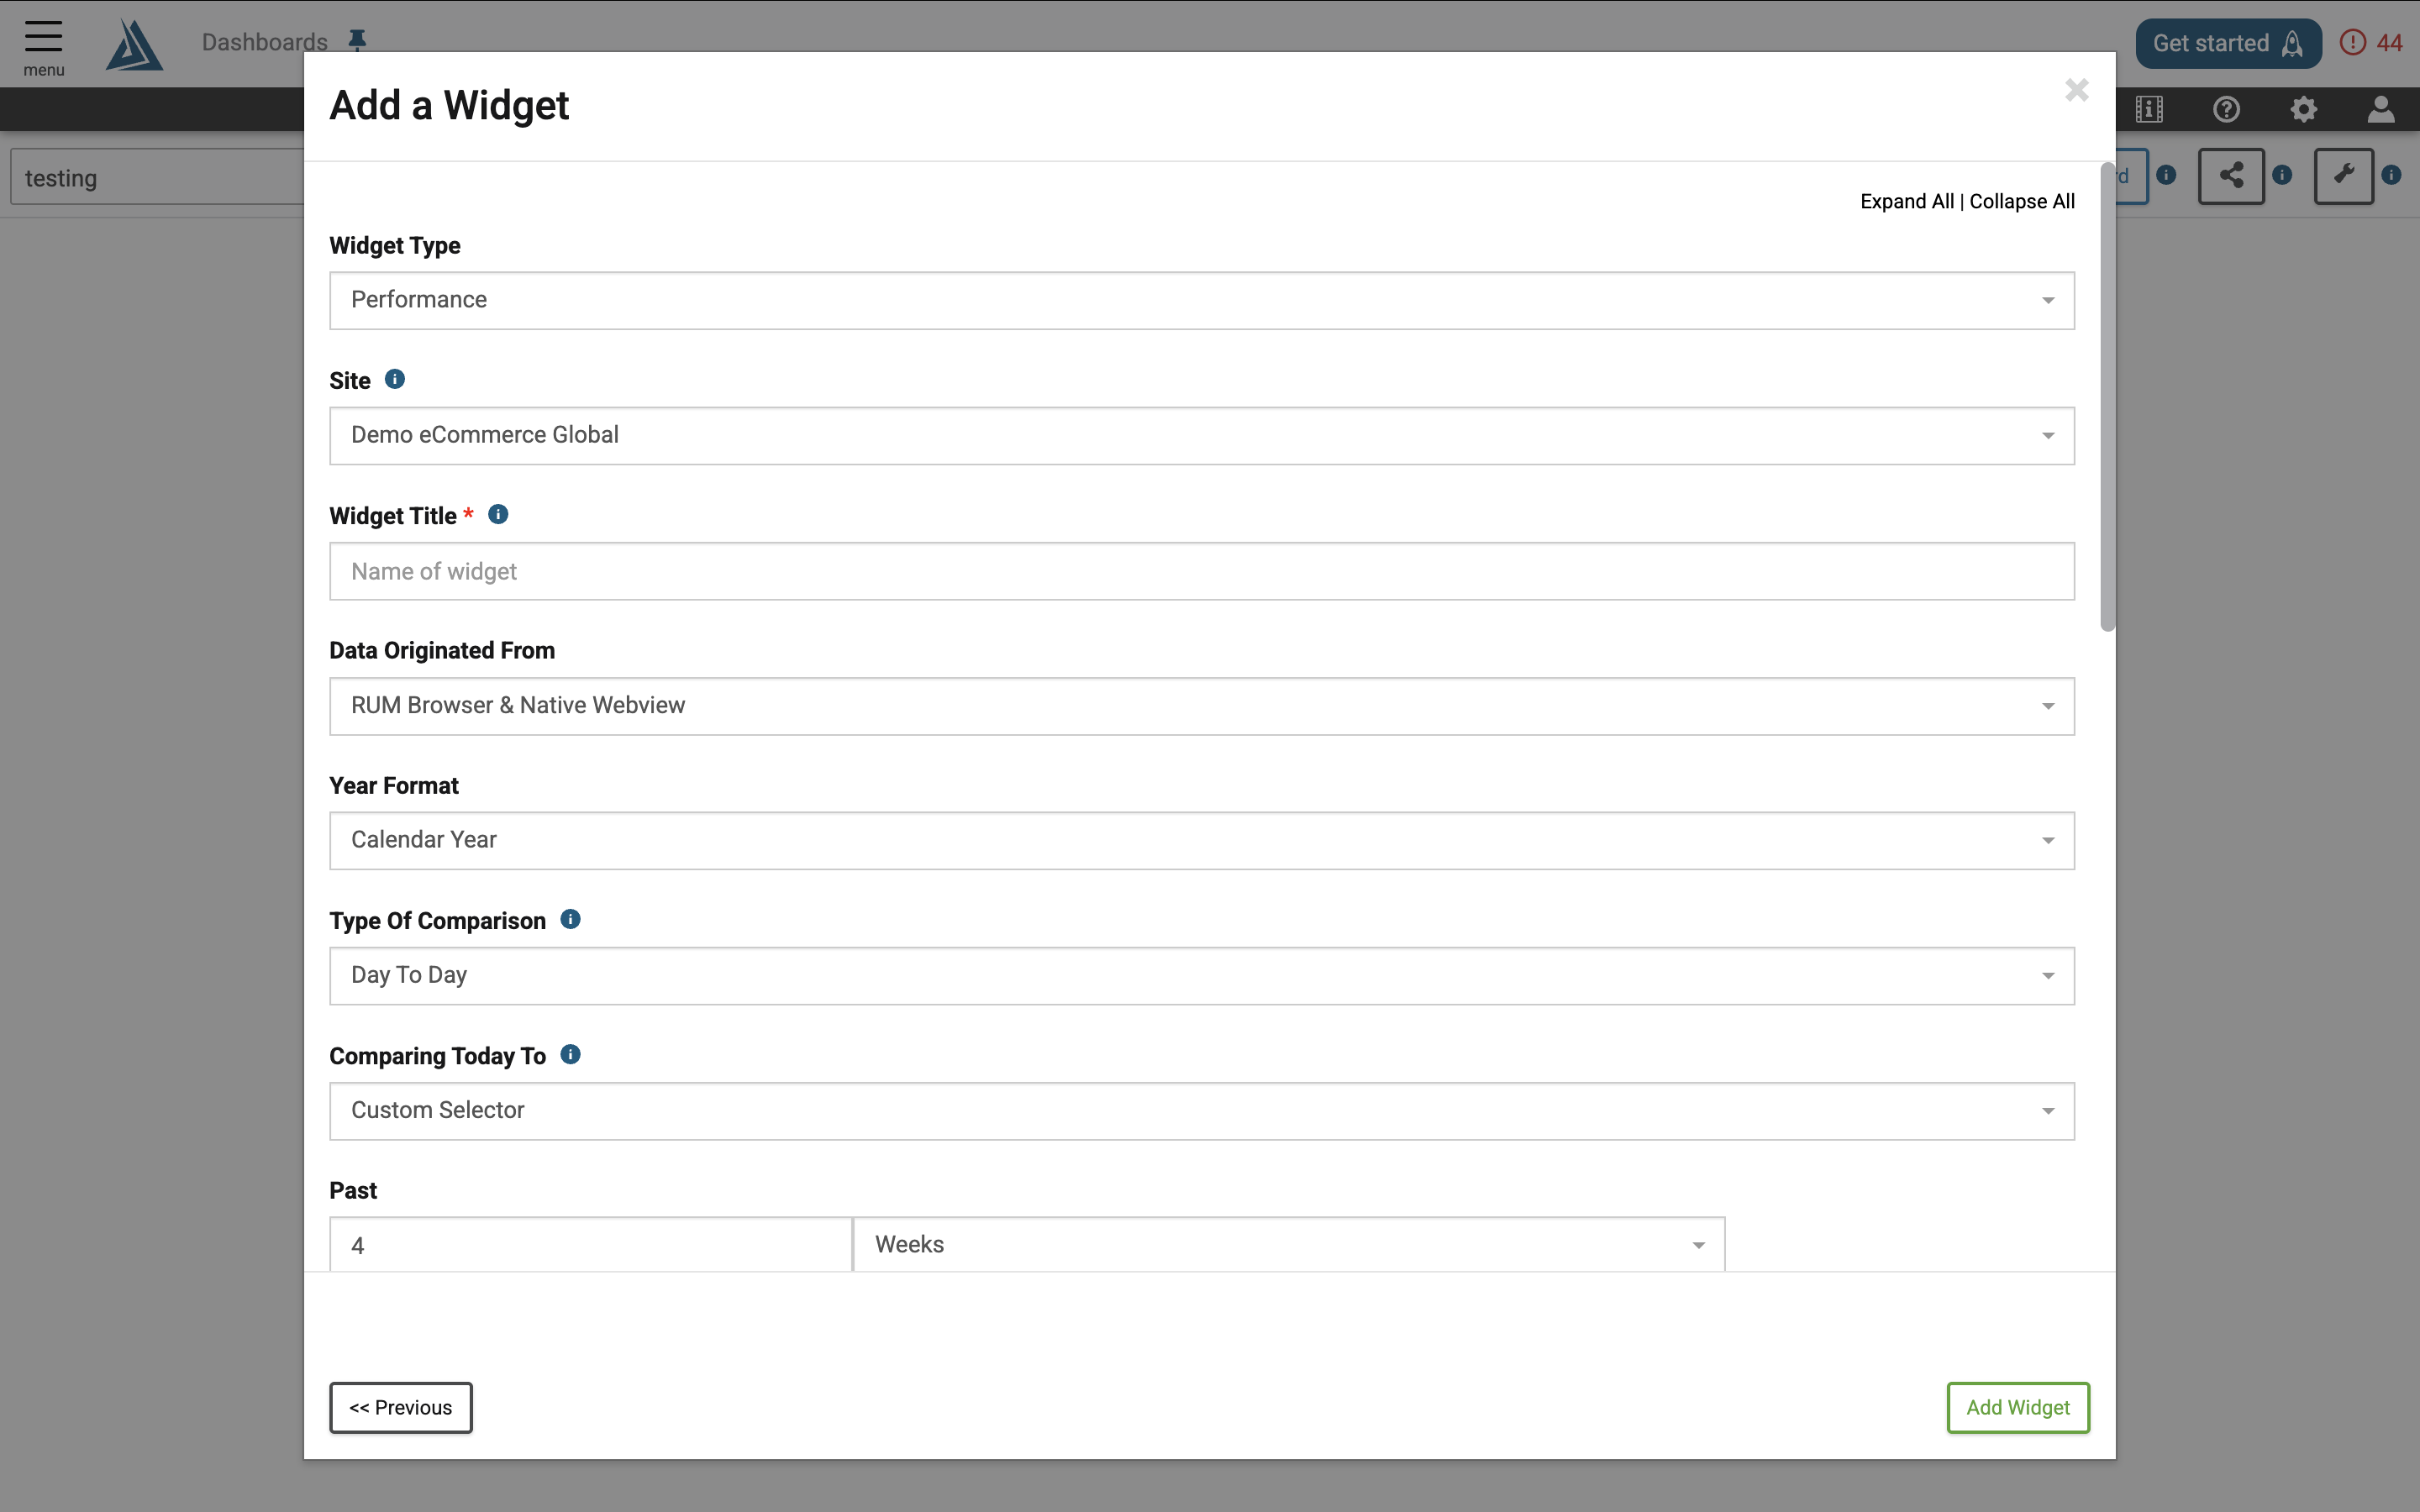
To configure this widget, fill out the widget title, set filters, and choose your type of comparison.
Type of Comparison
Once you have set your filters, you must choose the Type of Comparison. This is the most important step to gather the desired information. There are 3 different types of comparison with this widget with some comparisons offering additional options for details. Once comparisons are configured, create or update the widget.
|
Comparison |
Description |
Options |
|---|---|---|
|
Year to Year |
Gives a graph of the full year for each selected year as well as a line for the current year to date. |
|
|
Day to Day |
Choose between comparing today to the same day last month, last year, or a custom selection (such as the past 3 days or past 8 weeks) |
|
|
Custom |
Allows you to choose two custom dates. This is helpful when holidays do not align on the same day every year, allowing users to choose Labor Day this year and last year. |
|