Overview
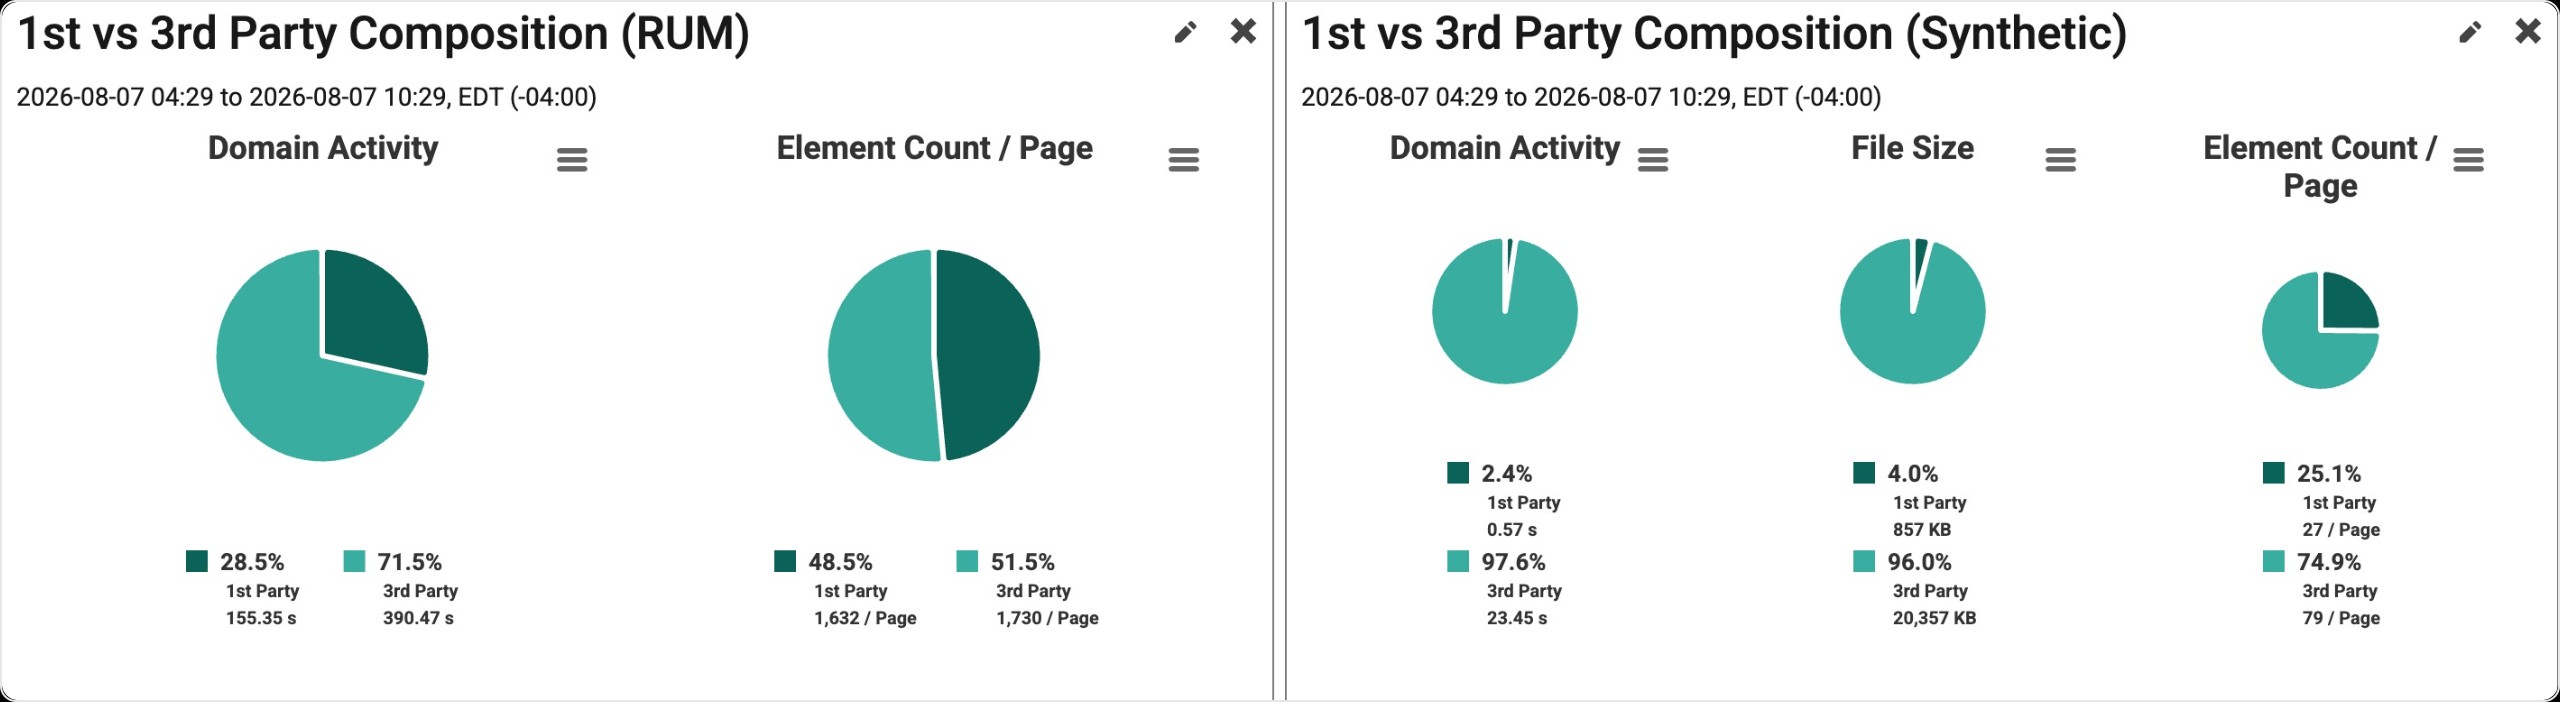
The 1st and 3rd Party Composition widget gives you a breakdown of the performance, size and amount of the content on your site. This widget is available for both Real User and Synthetic Data.
|
This widget is available to be added to custom dashboards. For more information on custom dashboards, please visit How to Create Custom Dashboards, andCustom Dashboard Widgets. |
Note: 1st Party content is defined by the "First Party Domains" list in the site settings. All else is marked as 3rd Party.
|
Domain Activity |
The sum of the time content from a particular domain spent loading. In this context, it is the sum of time each of 1st and 3rd party domains spent loading, on average over the Dashboard Time Period. |
|---|---|
|
File Size |
The sum of the file sizes from each of the 1st and 3rd Party content, on average over the Dashboard Time Period. |
|
Element Count/Page |
The number of elements of each of the 1st and 3rd party content, on average over the Dashboard Time Period. |
Find Widget
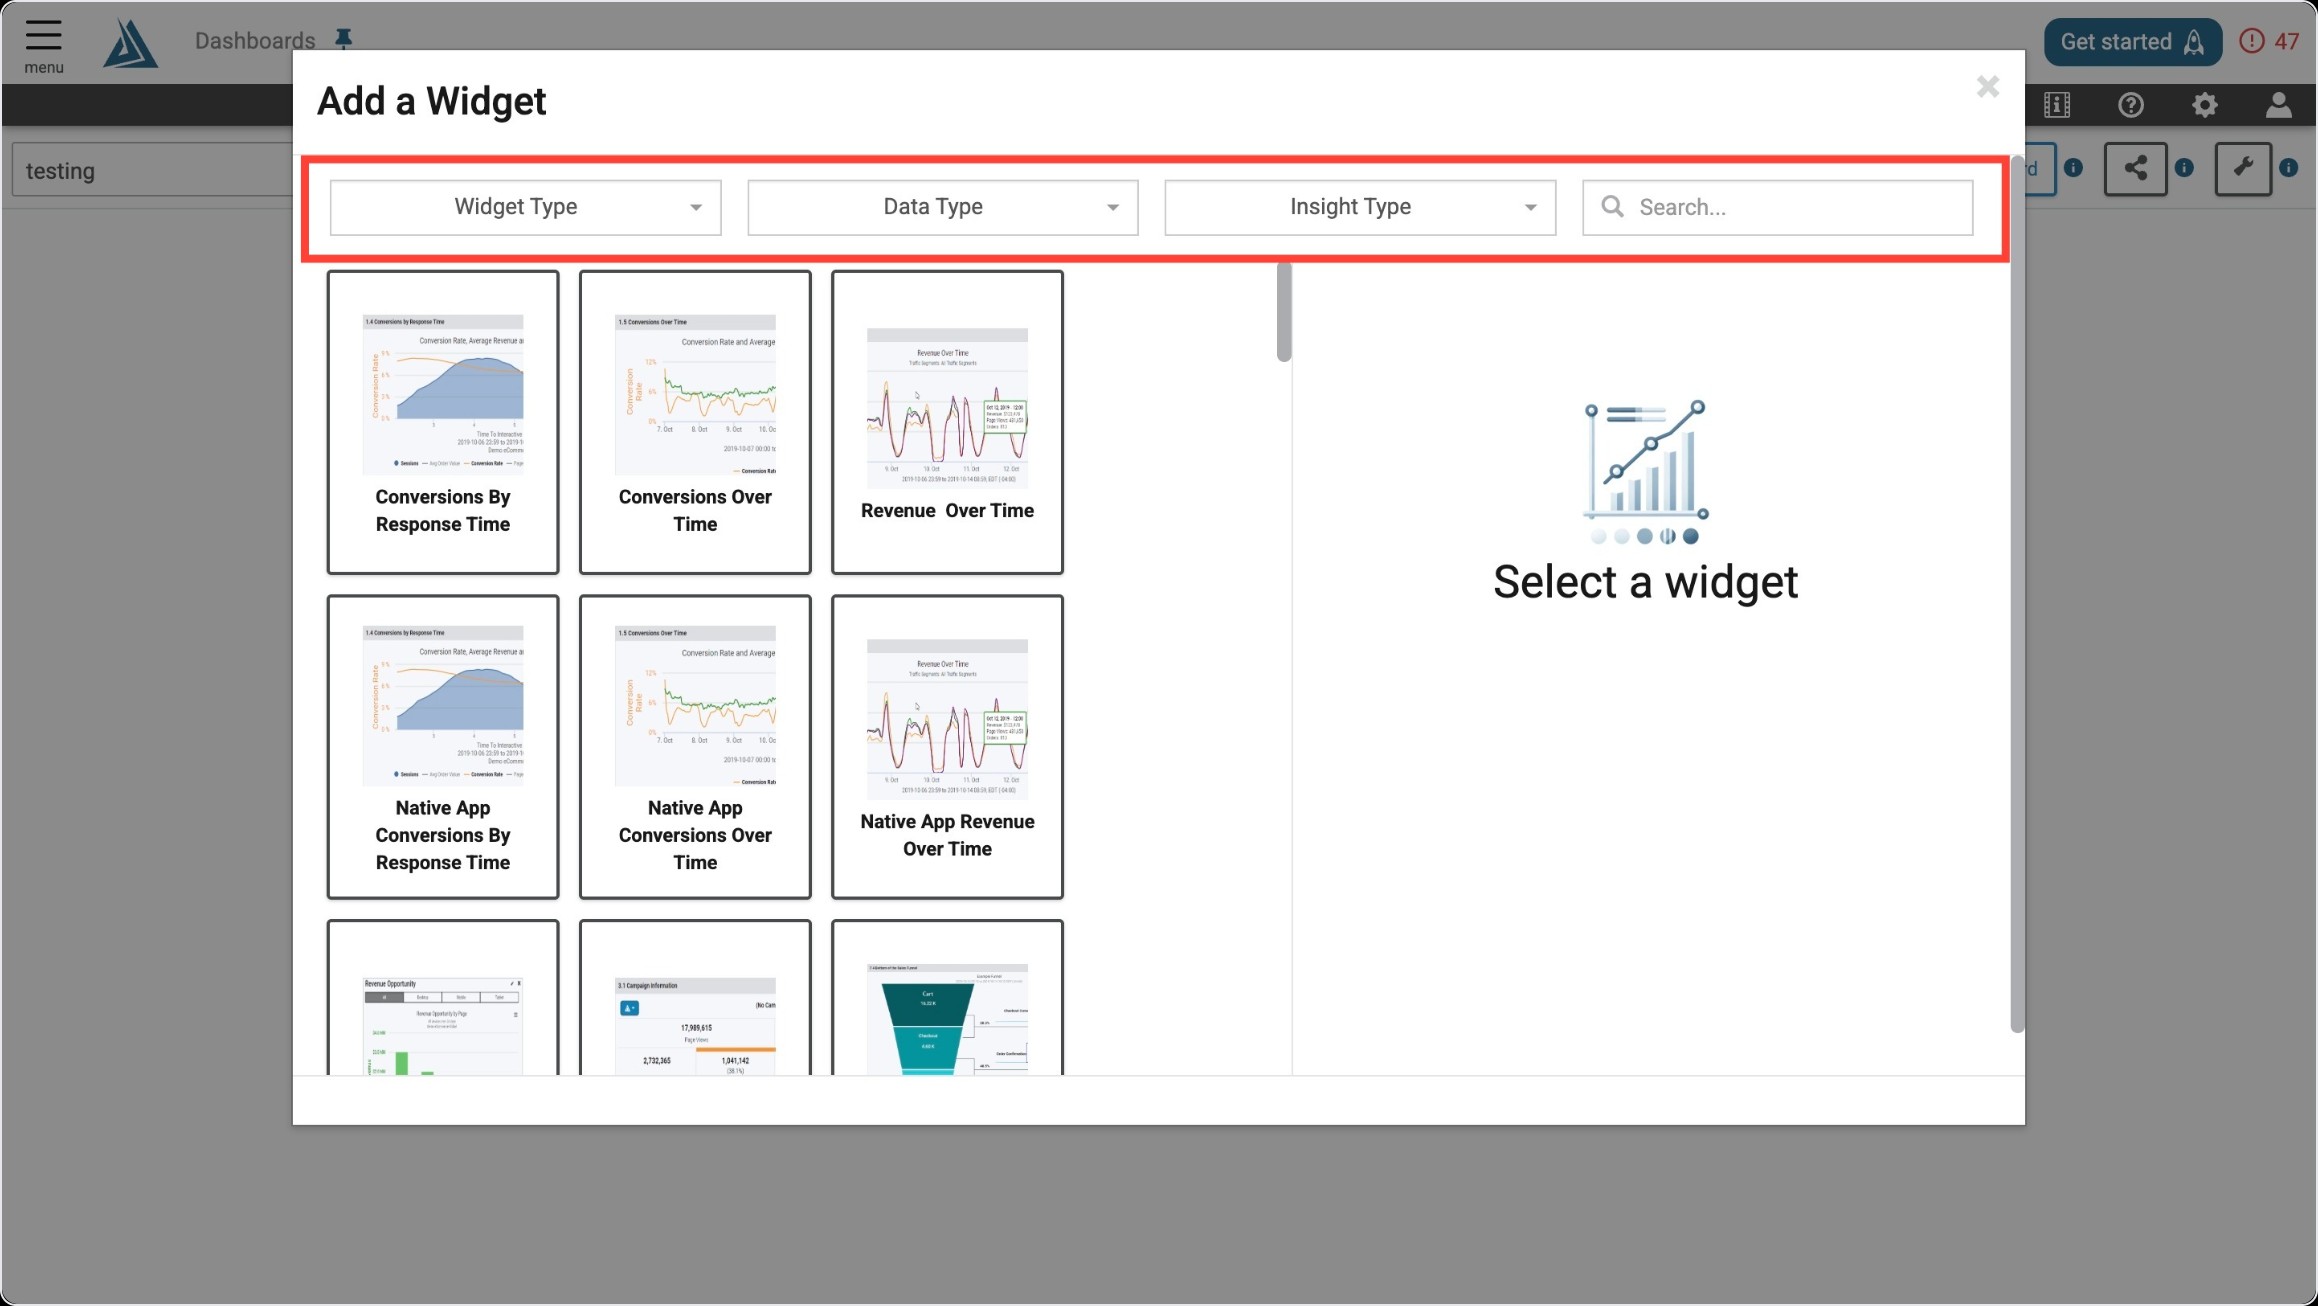
Once you enter the Add a Widget menu, you will see a variety of filter options on top. One way to find the Network Health Checks Performance Widget is to use the filter options listed below.
|
Filter Title |
Filter Option |
|---|---|
|
Widget Type |
Comparisons |
|
Data Type |
Real User OR Synthetic |
|
Insight Type |
Governance/Compliance |
Another way to find the Network Health Checks Performance Widget is to use the search bar at the top right of the menu.
Widget Configuration
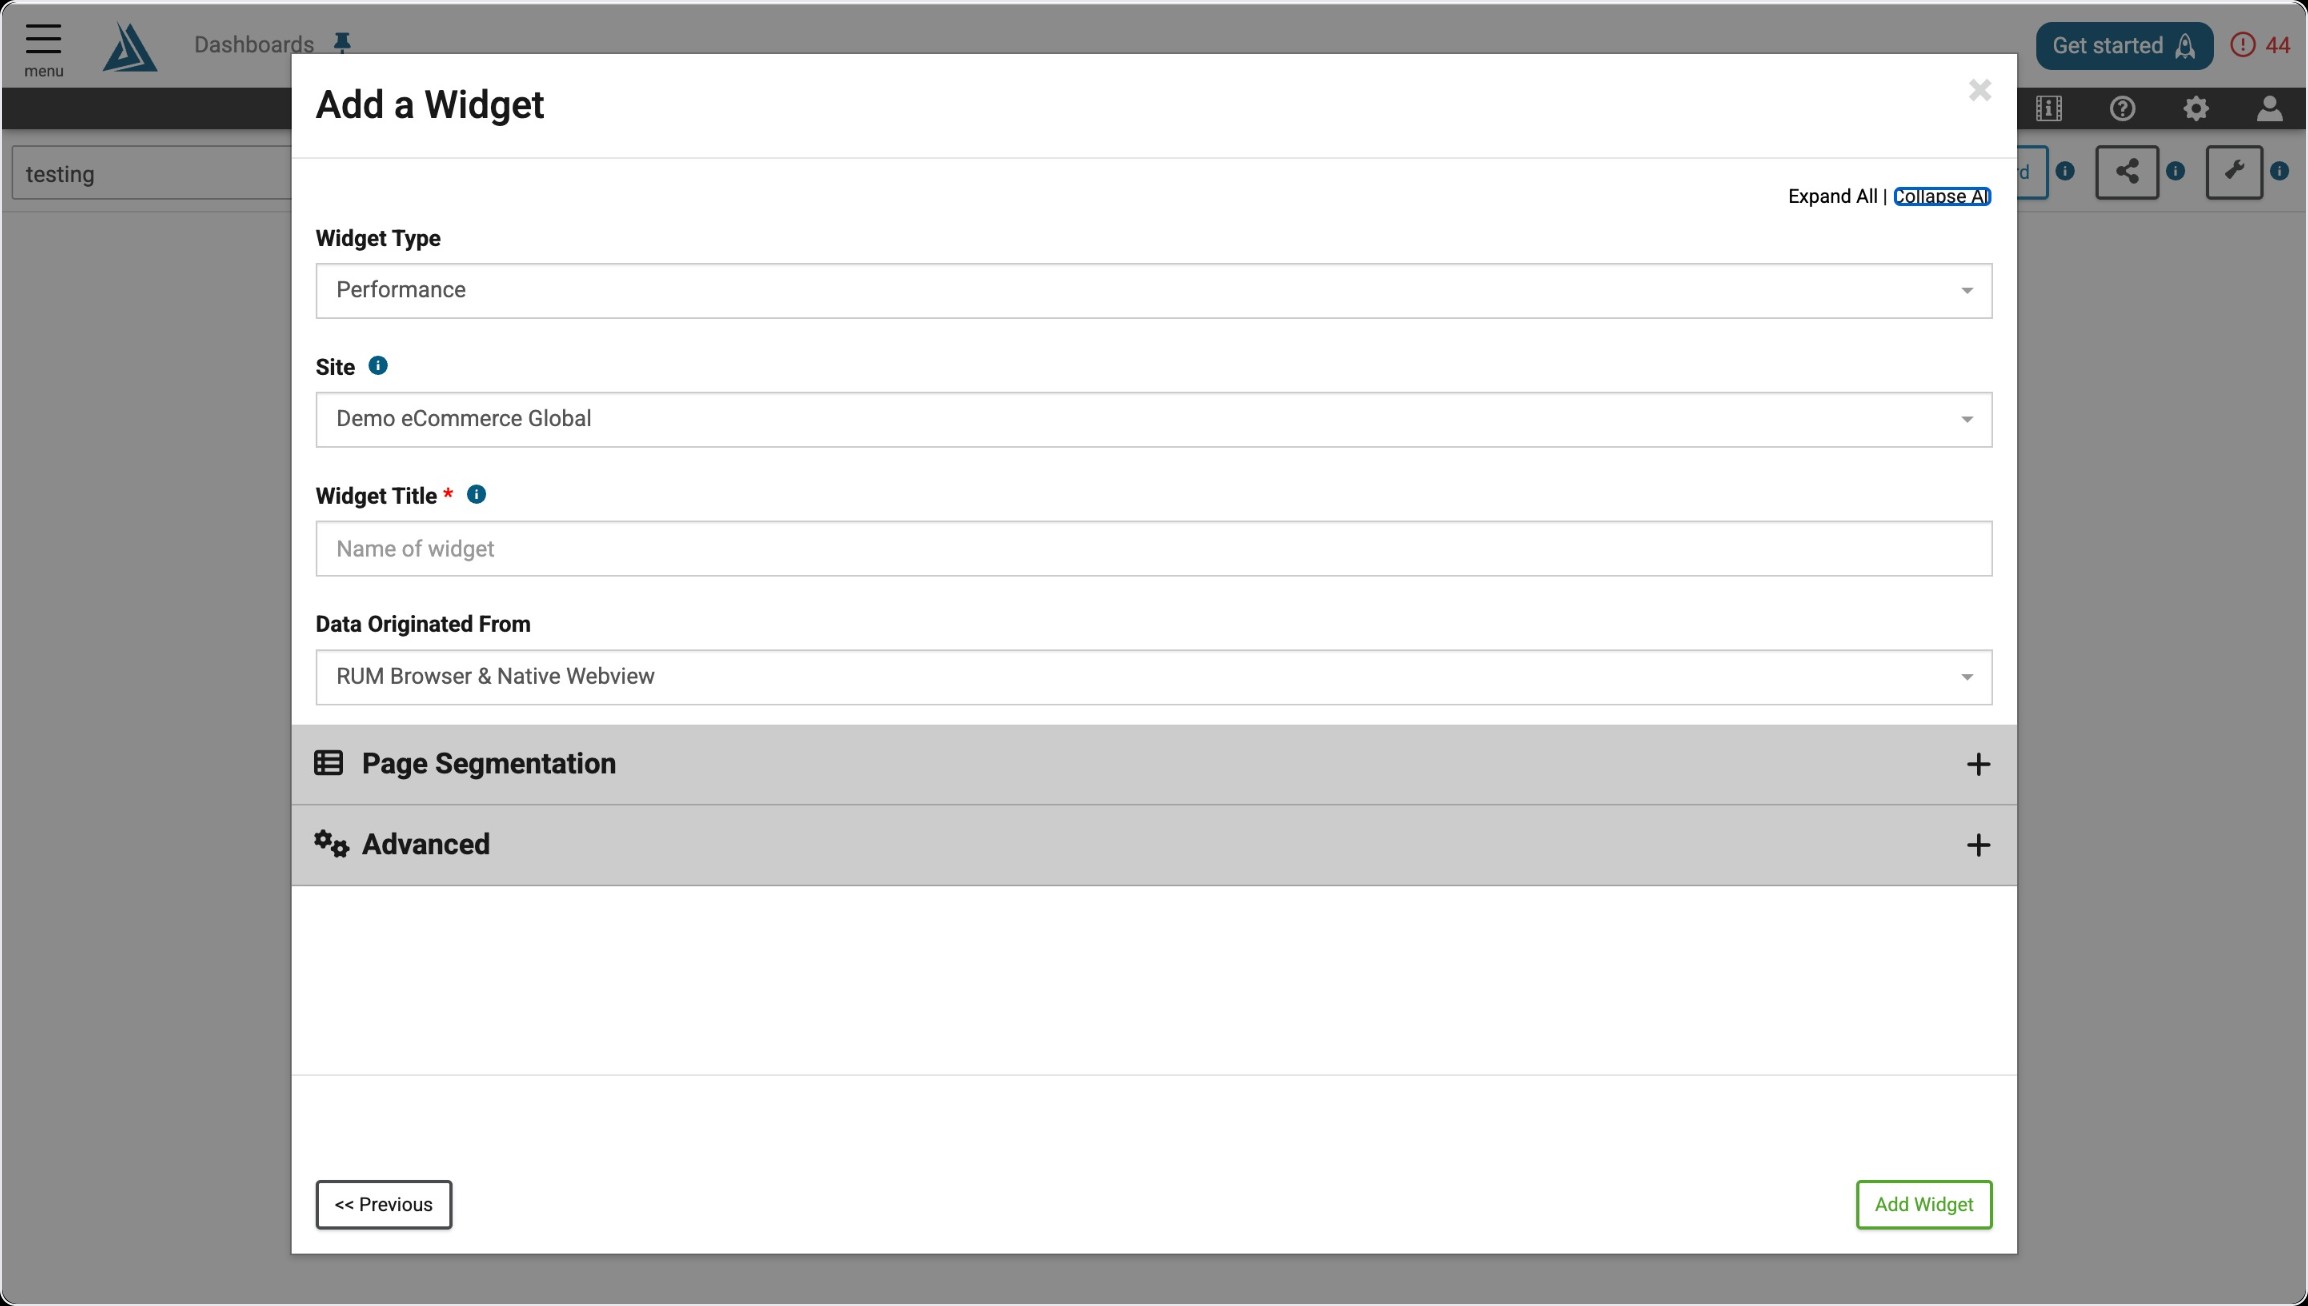
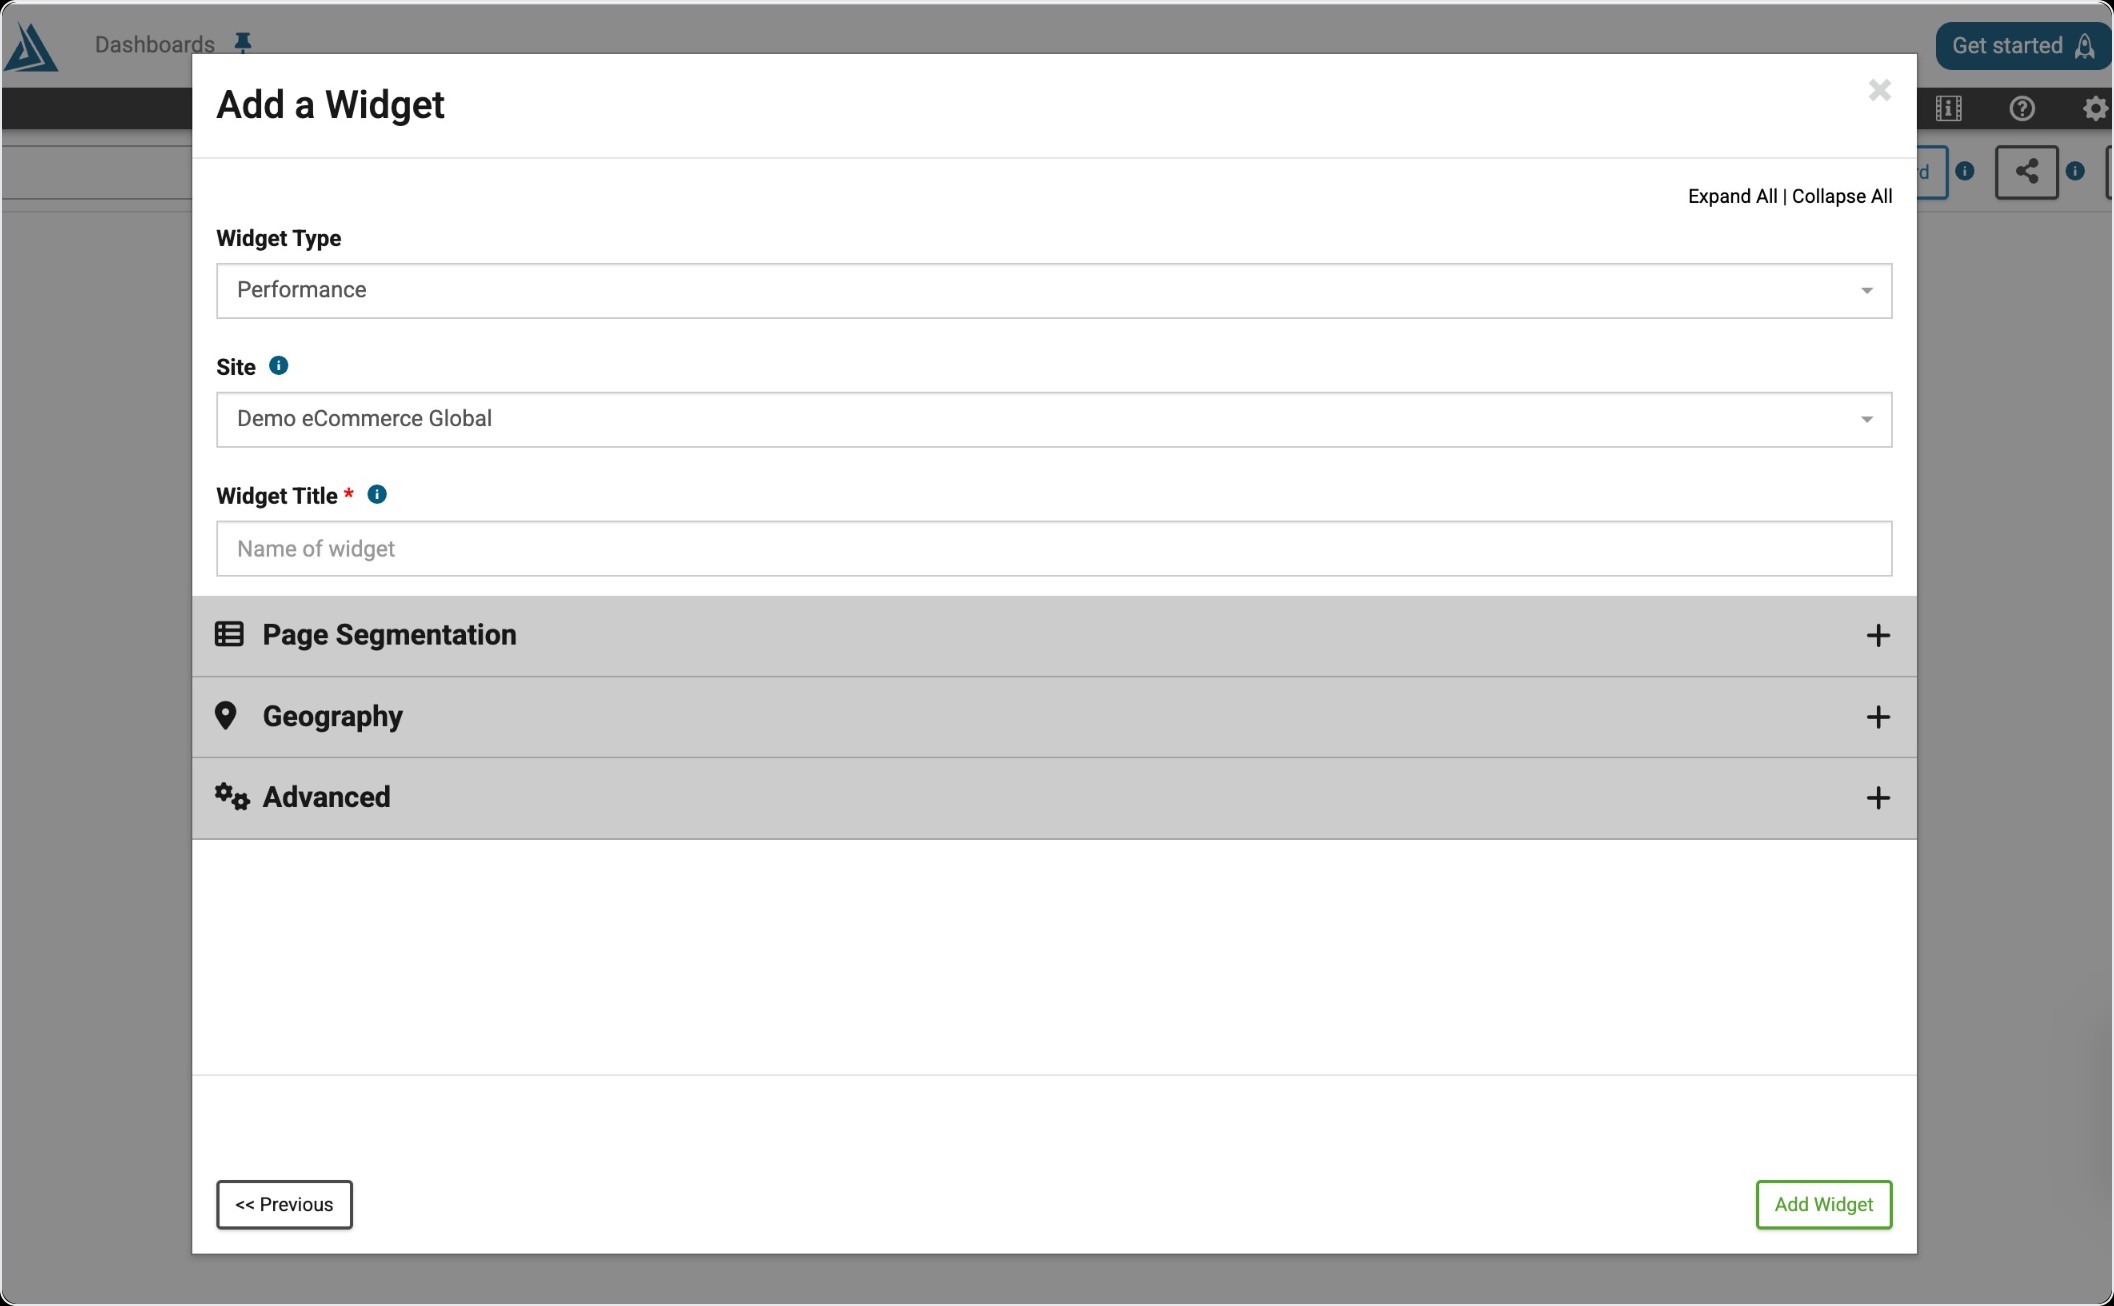
The only required configuration for this widget is a title. The Page Segmentation and Geography filters are also available in the configuration window, but can be applied after the widget is created as well.