Overview
The Year by Year Comparison Widget shows daily revenue in a line graph for selected years for comparison. Each year is a separate line in the graph.
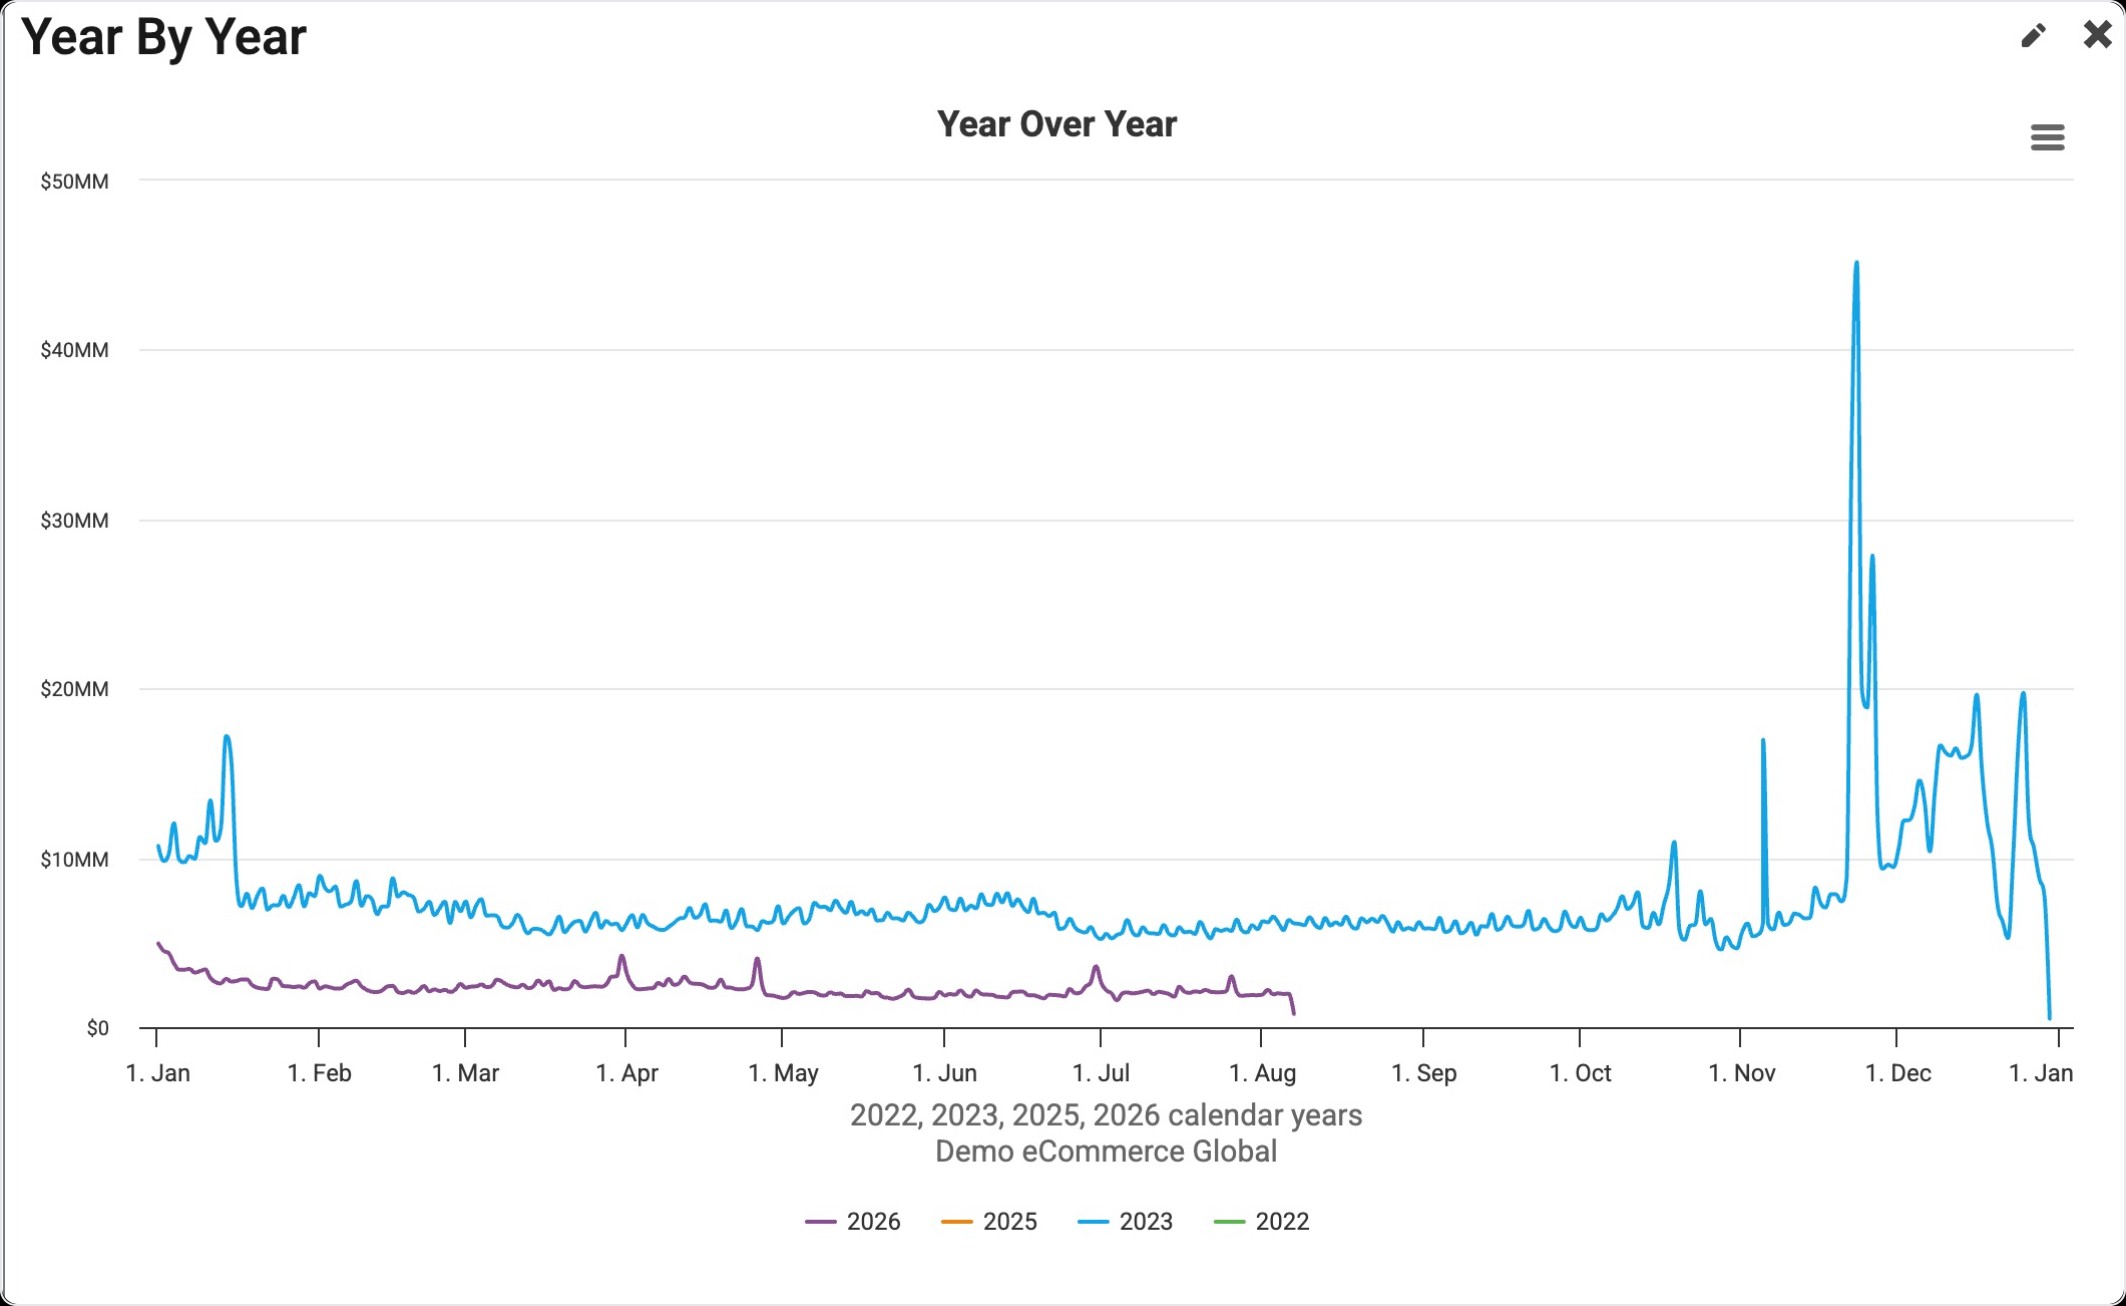
Due to this widget displaying daily data points, it updates shortly after midnight each day.
It's a good dashboard to have to give you a glimpse at annual revenue trends.
Special Notes on the Year by Year Comparison Widget:
-
The widget does not abide by and operates independently of the Dashboard Time Period selector at the top of the page.
-
Due to the vast amount of data this widget needs to query, the initial load may take upward of 20-30 seconds. Subsequent loads will then be very quick as usual.
Find Widget
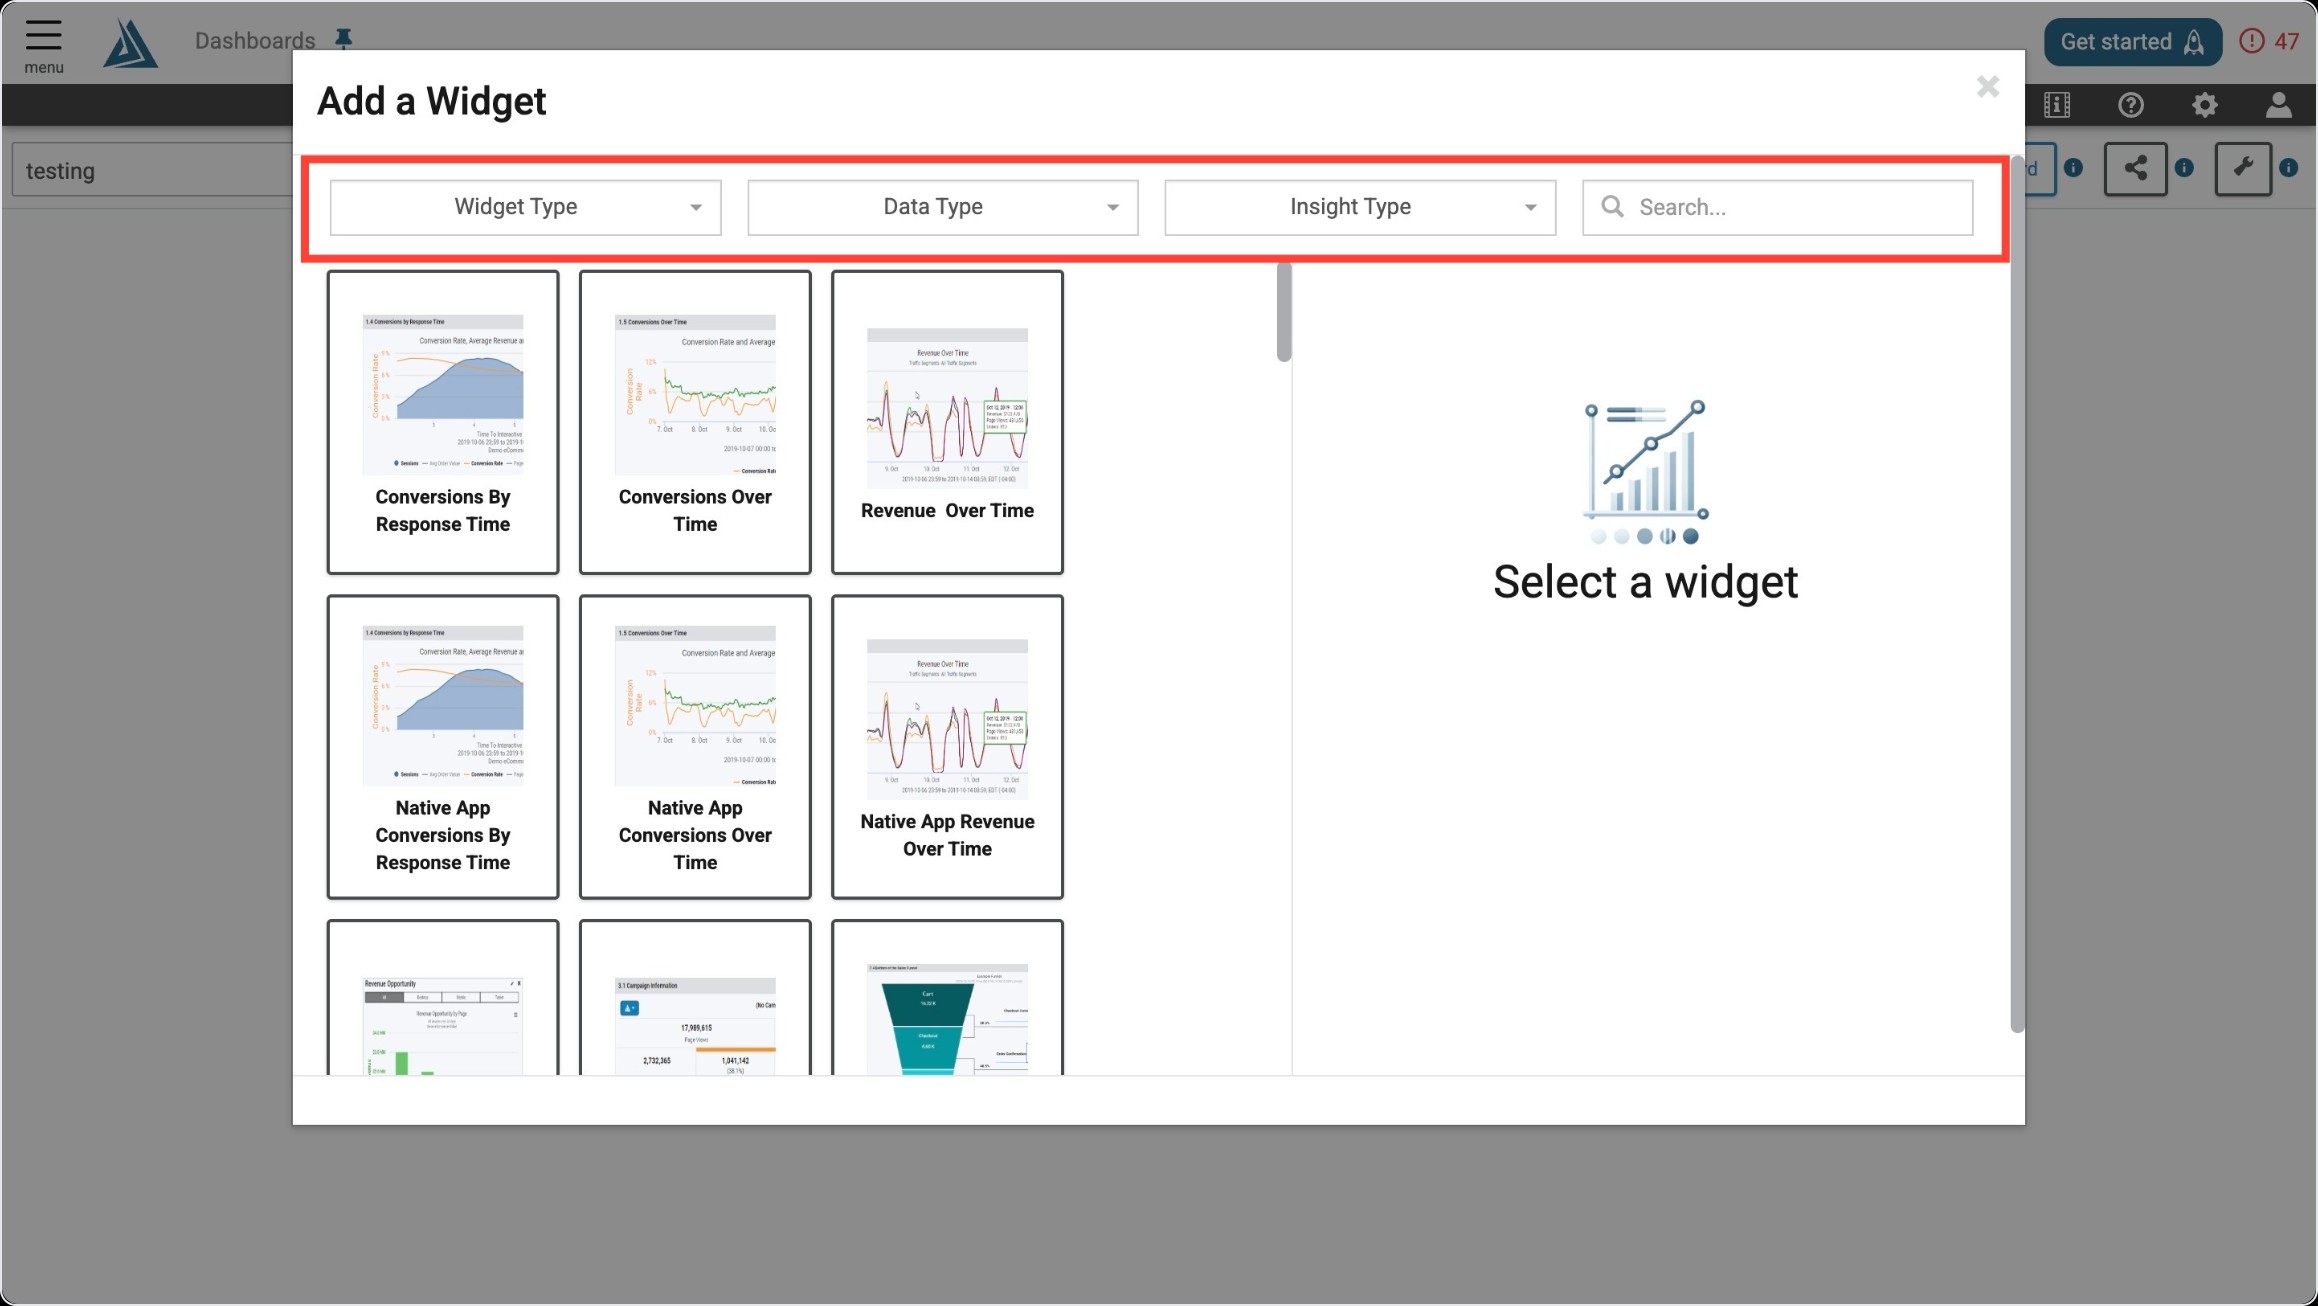
Once you enter the Add a Widget menu, you will see a variety of filter options on top. One way to find the Year by Year Comparison Widget is to use the filter options listed below.
|
Filter Title |
Filter Option |
|---|---|
|
Widget Type |
Comparisons |
|
Data Type |
Real User |
|
Insight Type |
Performance |
Another way to find the Year by Year Comparison Widget is to use the search bar at the top right of the menu.
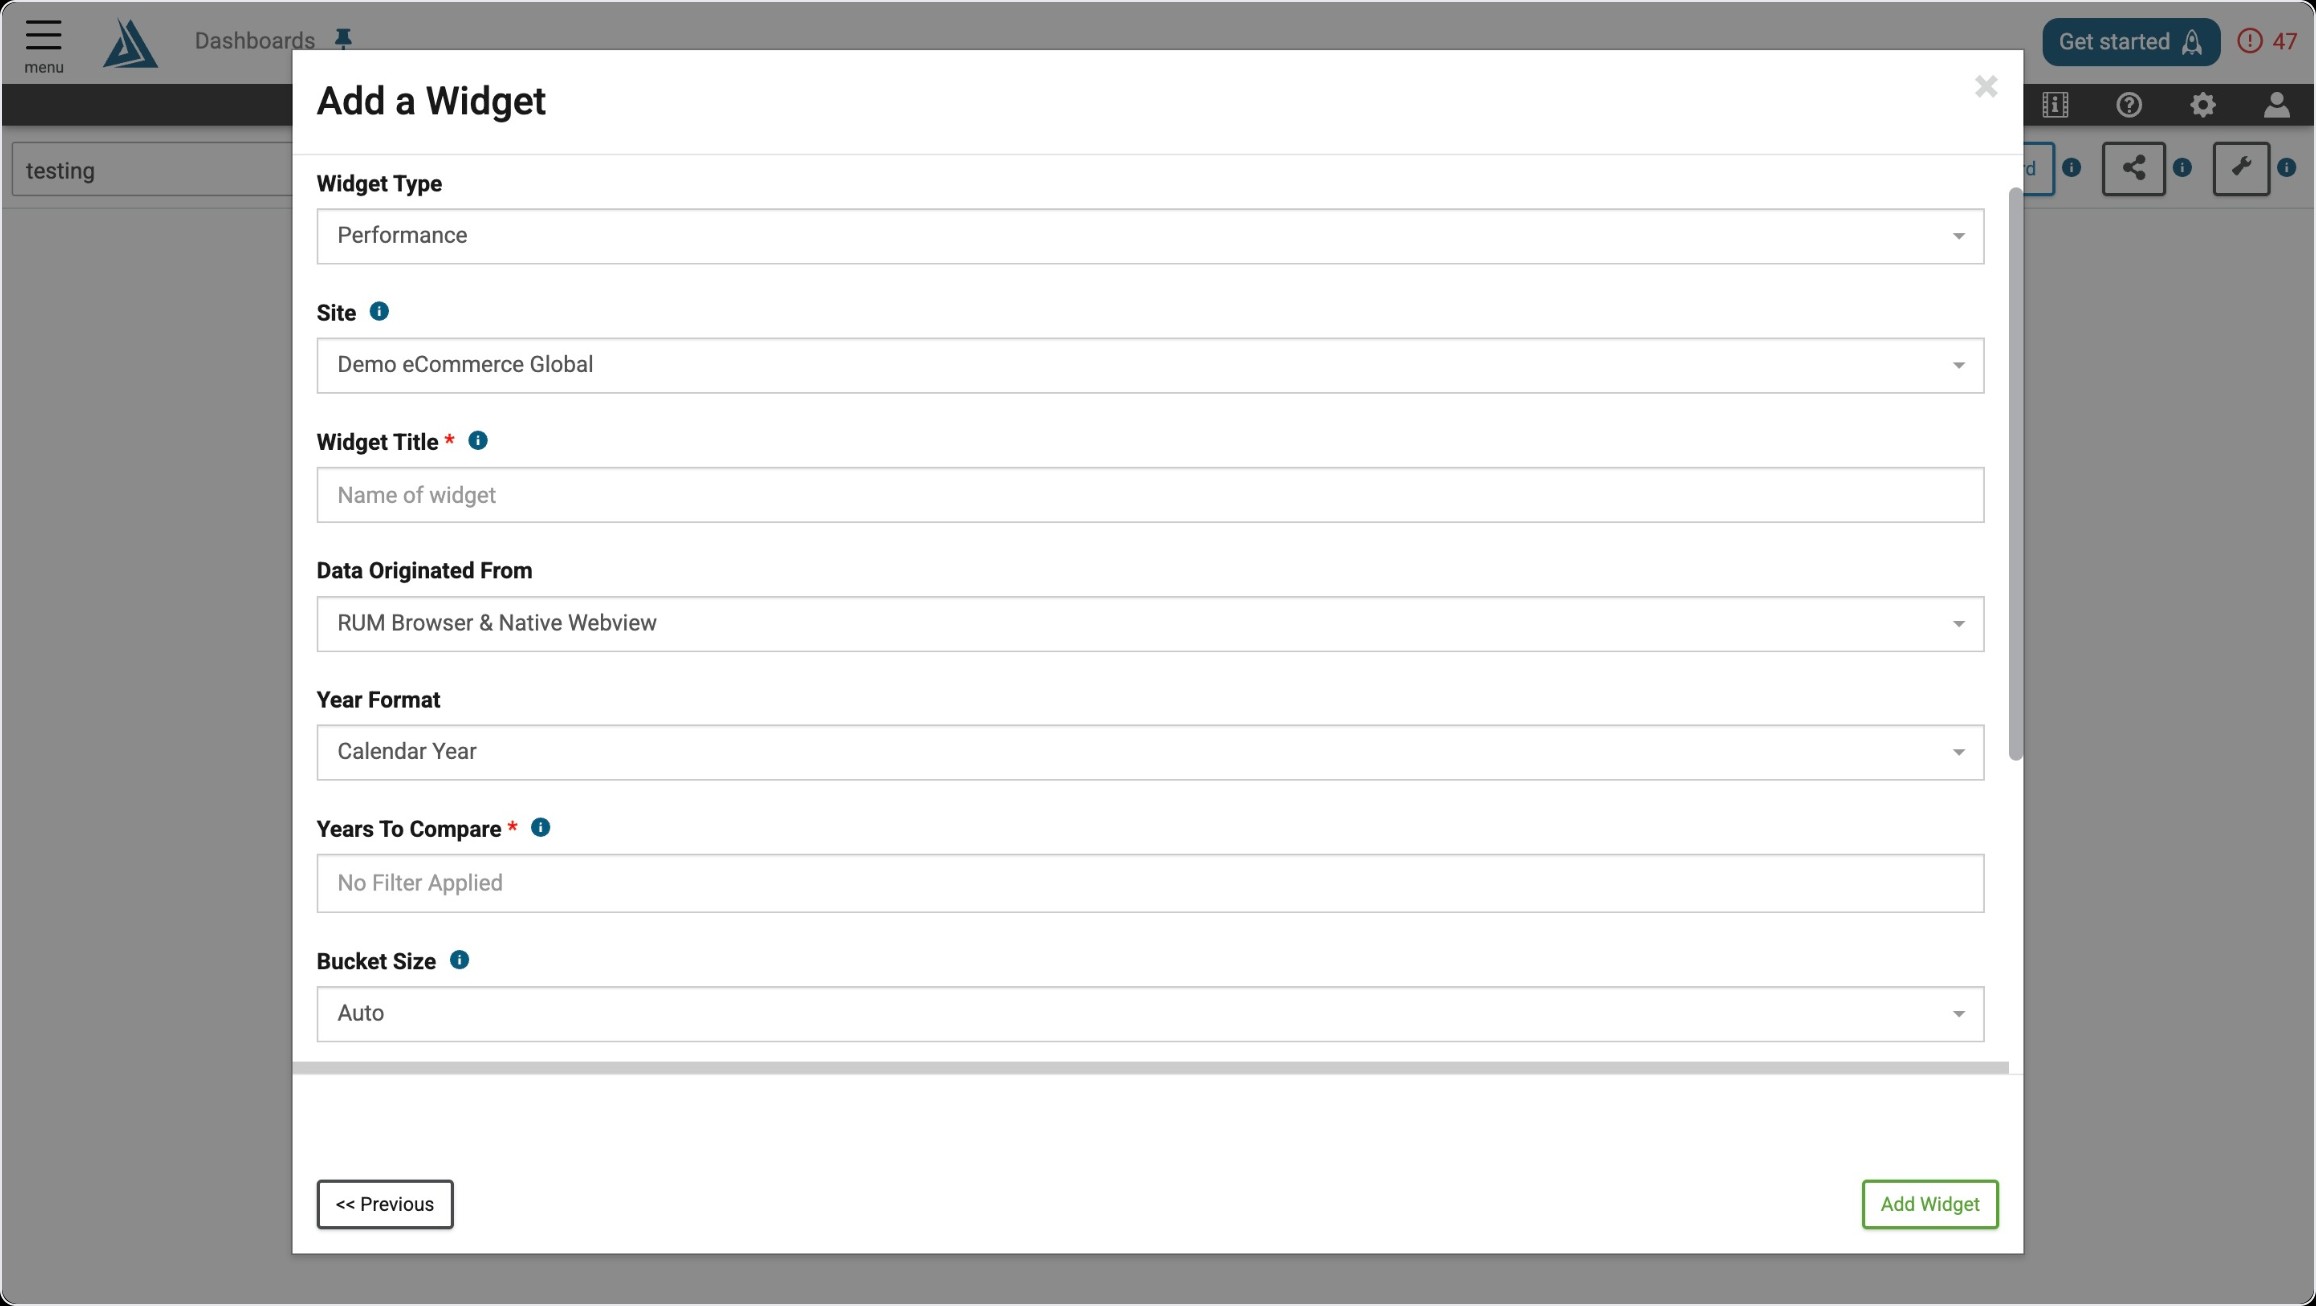
Widget Configuration
To configure this widget, fill out all required sections and apply any filtering you need.