Overview
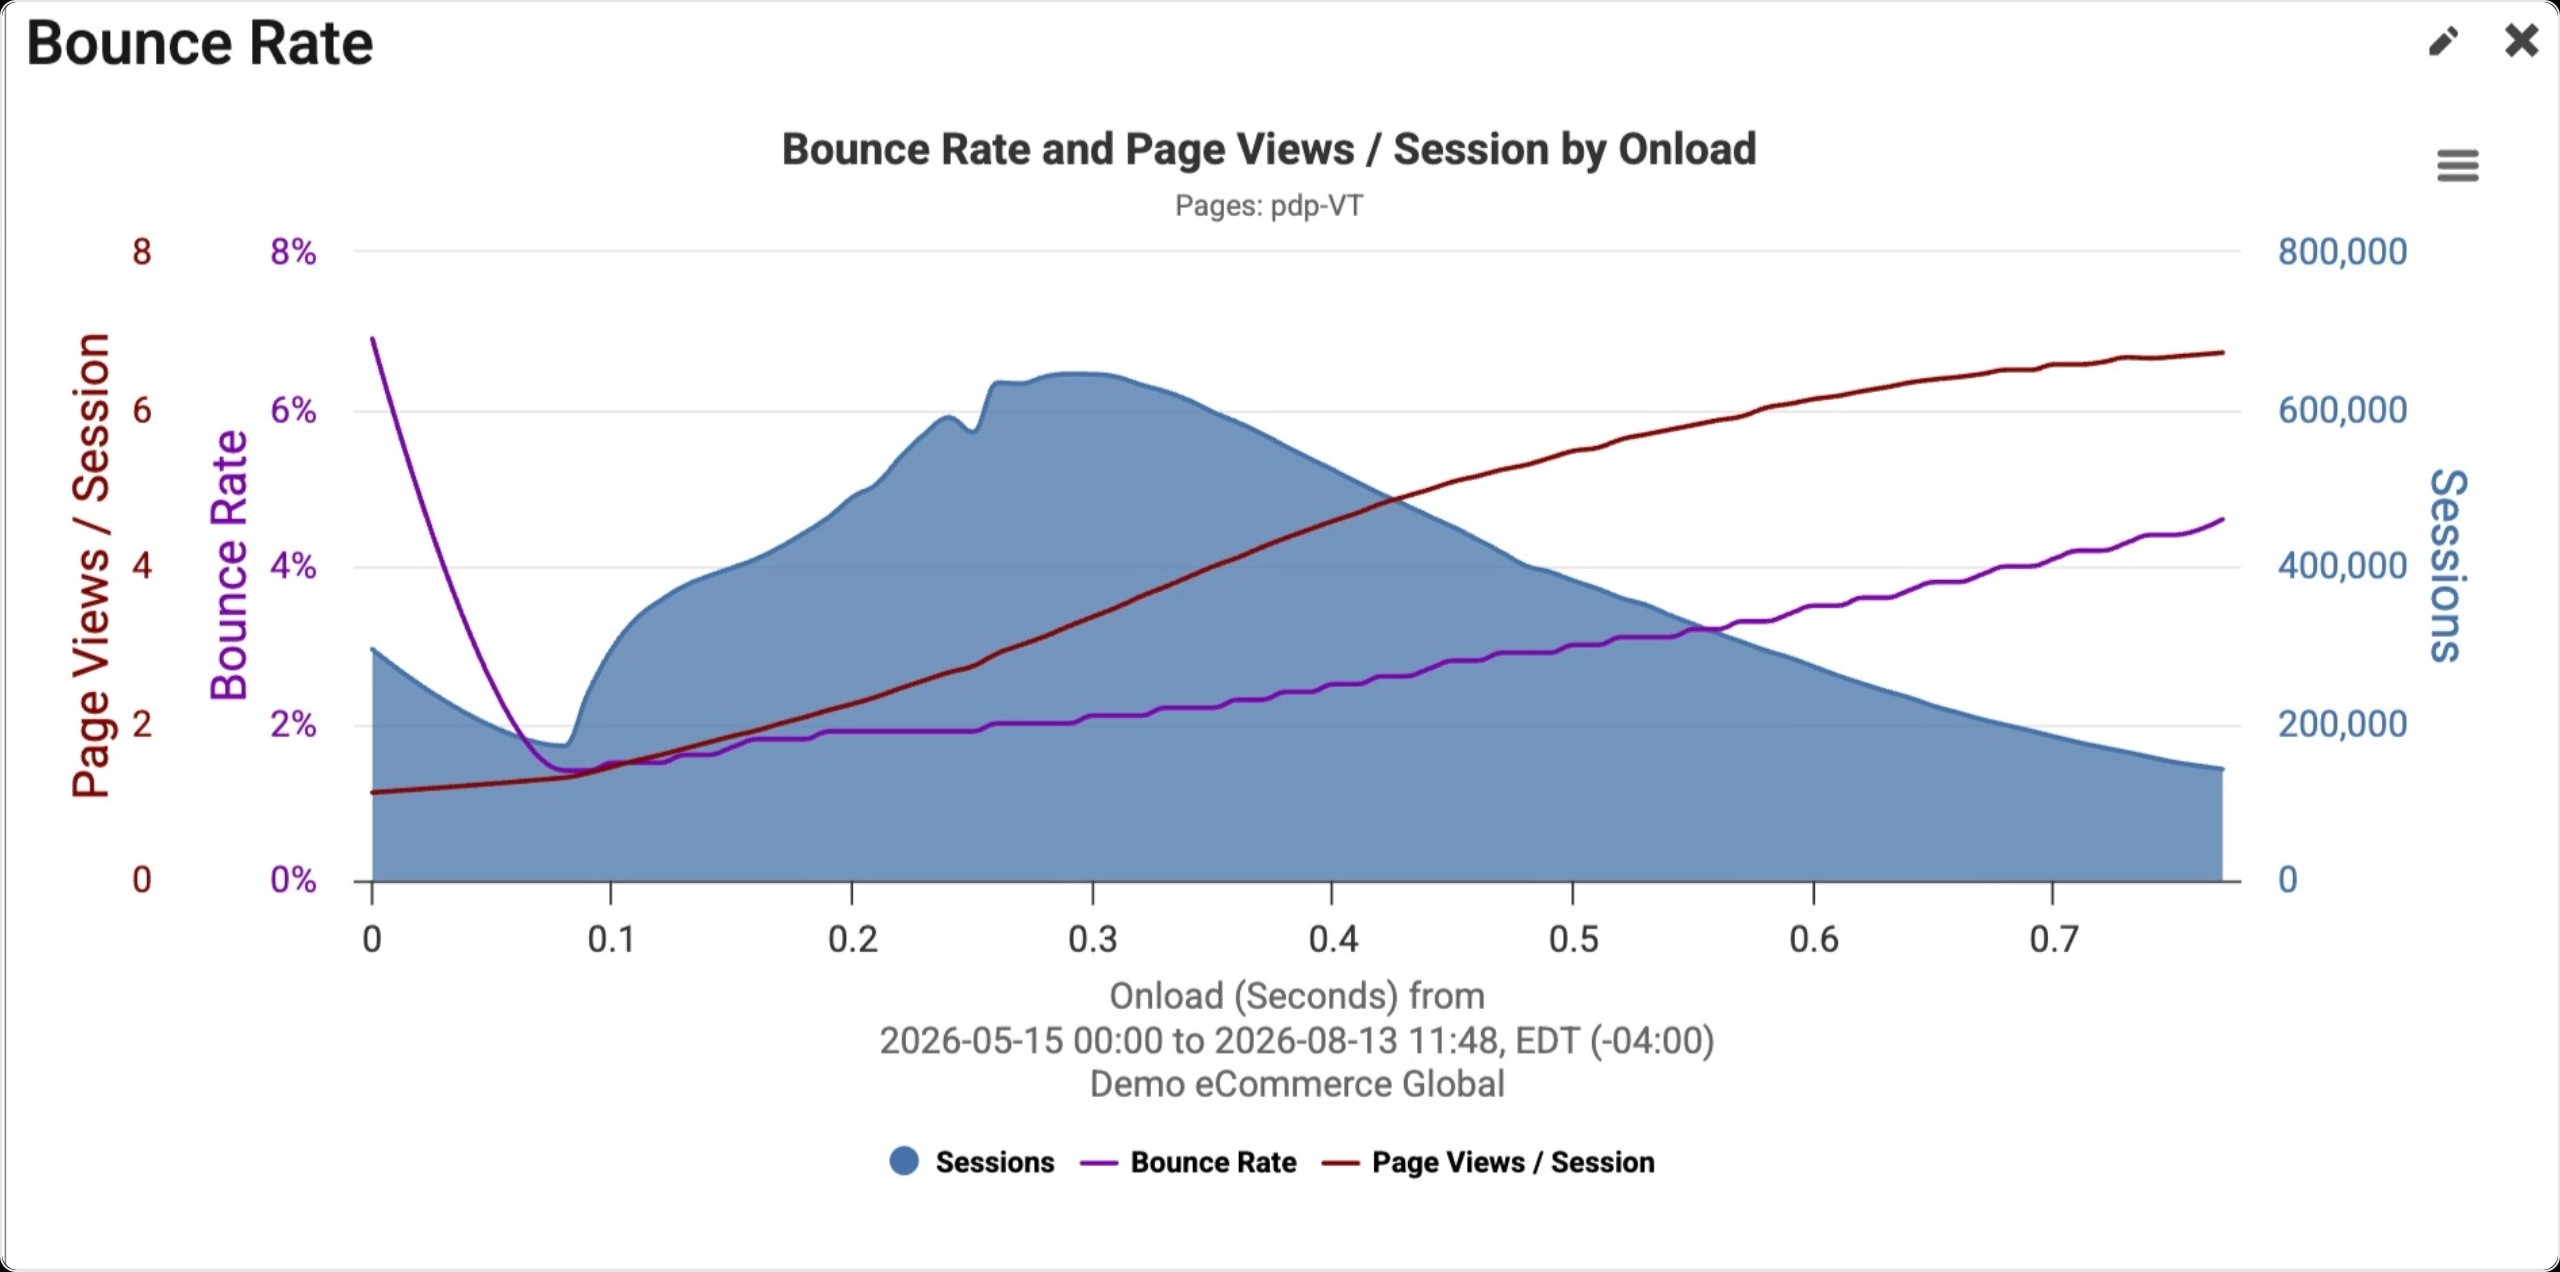
The Bounce Rate widget gives you real-time insight into the relationship between user behavior (bounce rate, page views/session) and performance on your site. This graph will abide by the time period selector on the dashboard.
Widget Description
-
Typically bounce rate increases as page speed increases. And vice versa - the quicker the page loads, the lower the bounce rate.
-
The shaded region in the graph is a histogram of sessions where each 0.1 second cohort represents the number of visitors who received the page at x seconds.
-
In addition to bounce rate and sessions, this graph also shows average page views/session. You can toggle these lines on and off in the graph by clicking them in the legend.
Find Widget
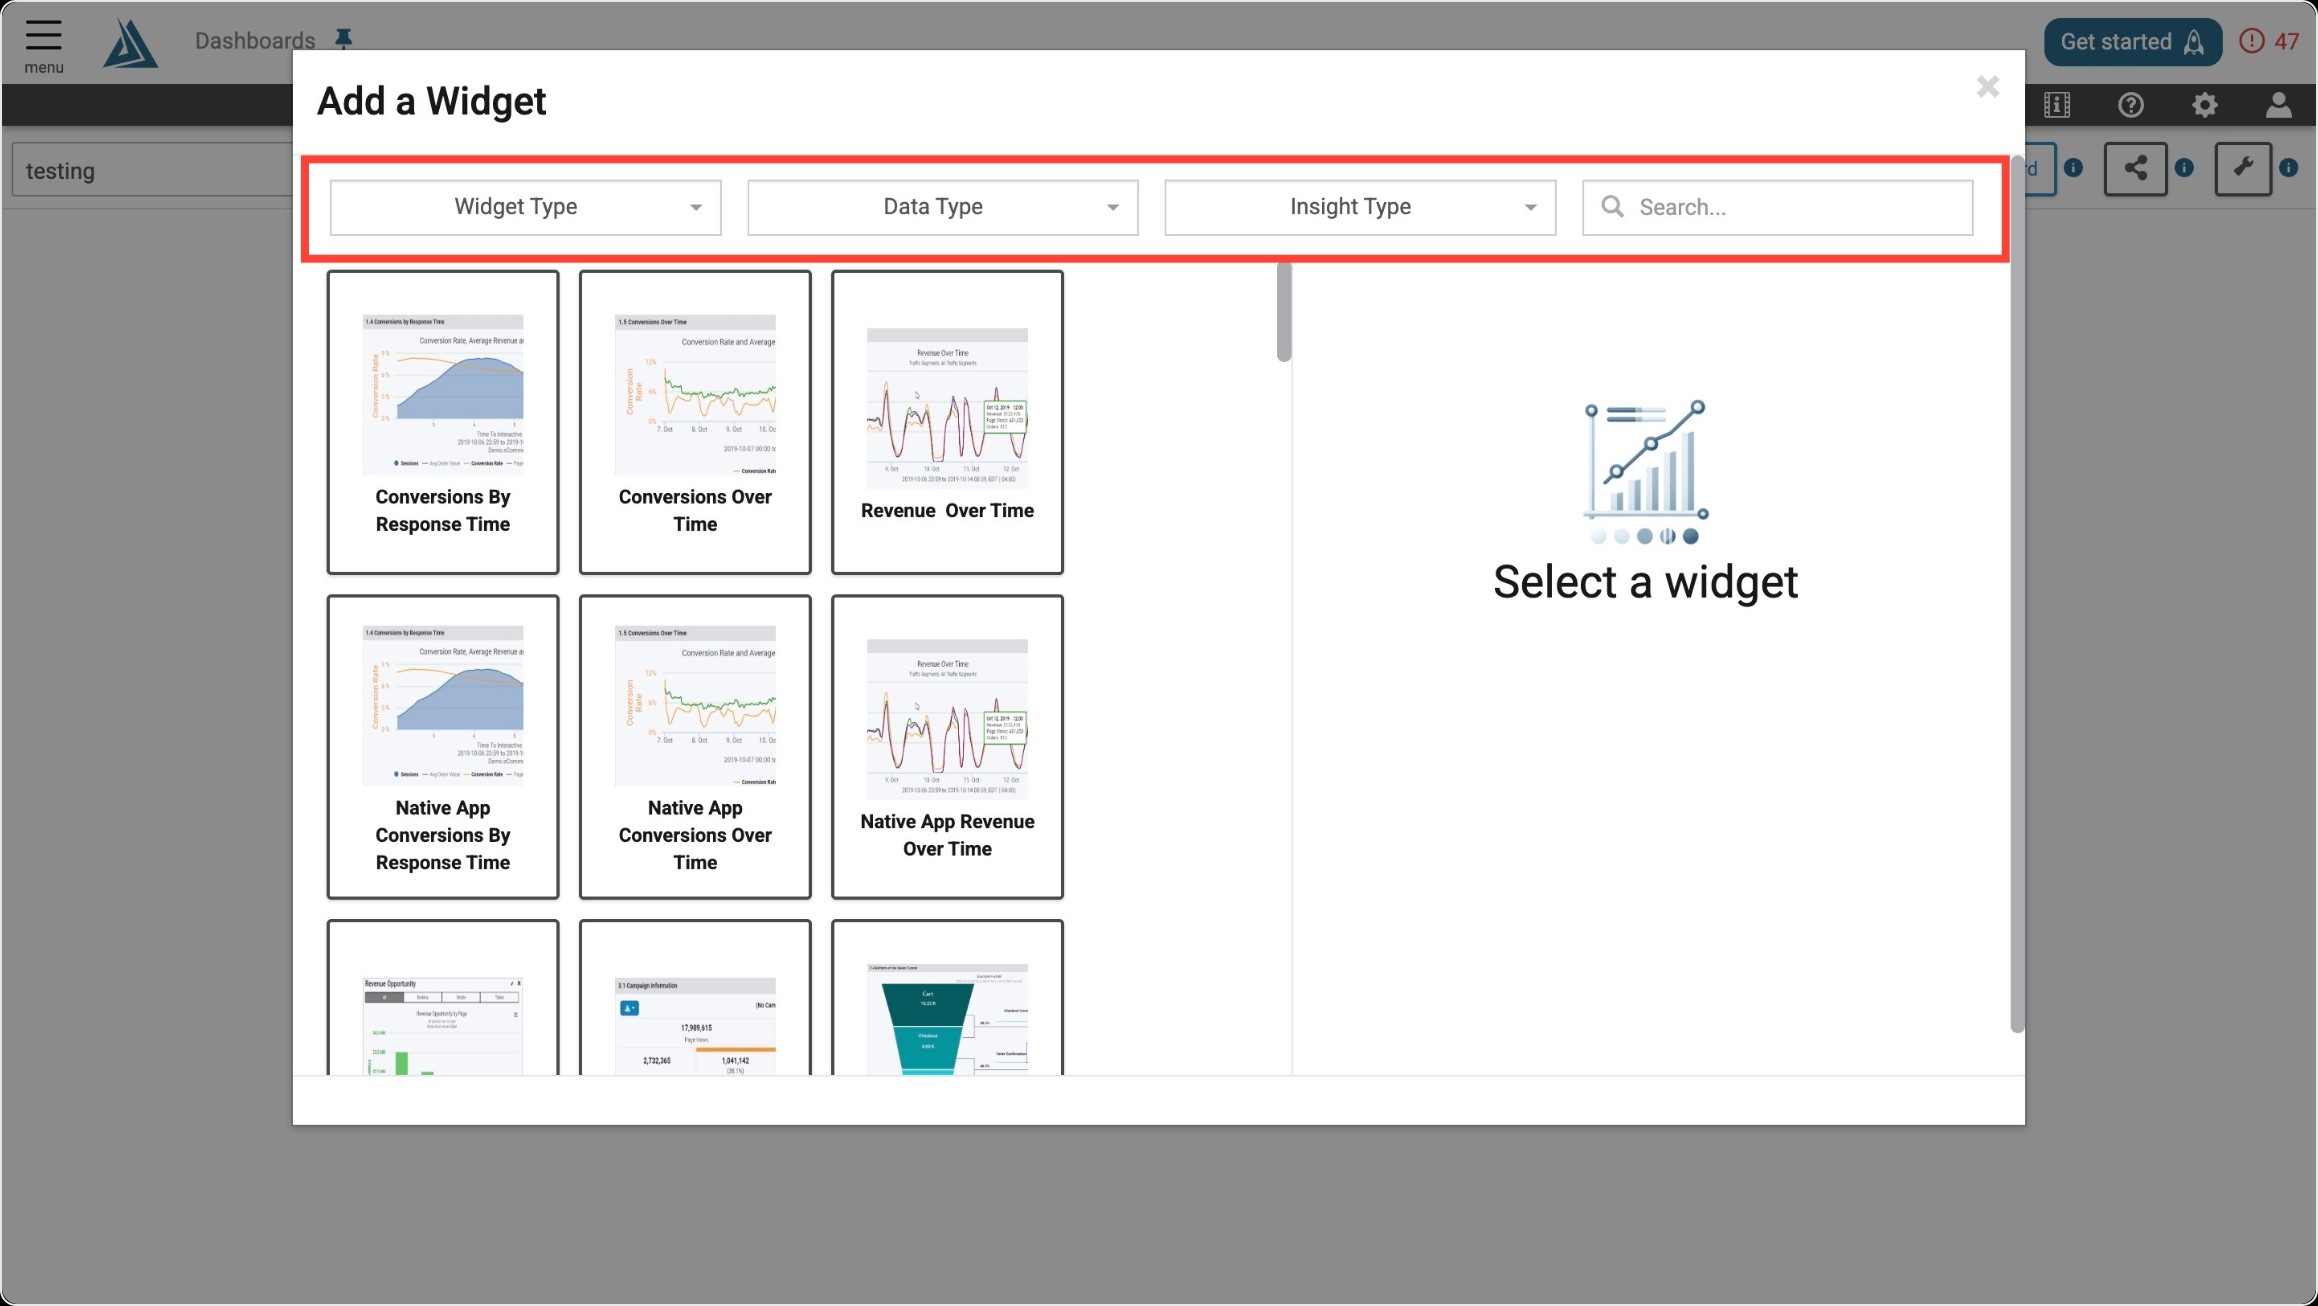
Once you enter the Add a Widget menu, you will see a variety of filter options on top. One way to find the Bounce Rate Widget is to use the filter options listed below.
|
Filter Title |
Filter Option |
|---|---|
|
Widget Type |
Summaries |
|
Data Type |
Real User |
|
Insight Type |
Performance |
Another way to find the Bounce Rate Widget is to use the search bar at the top right of the menu.
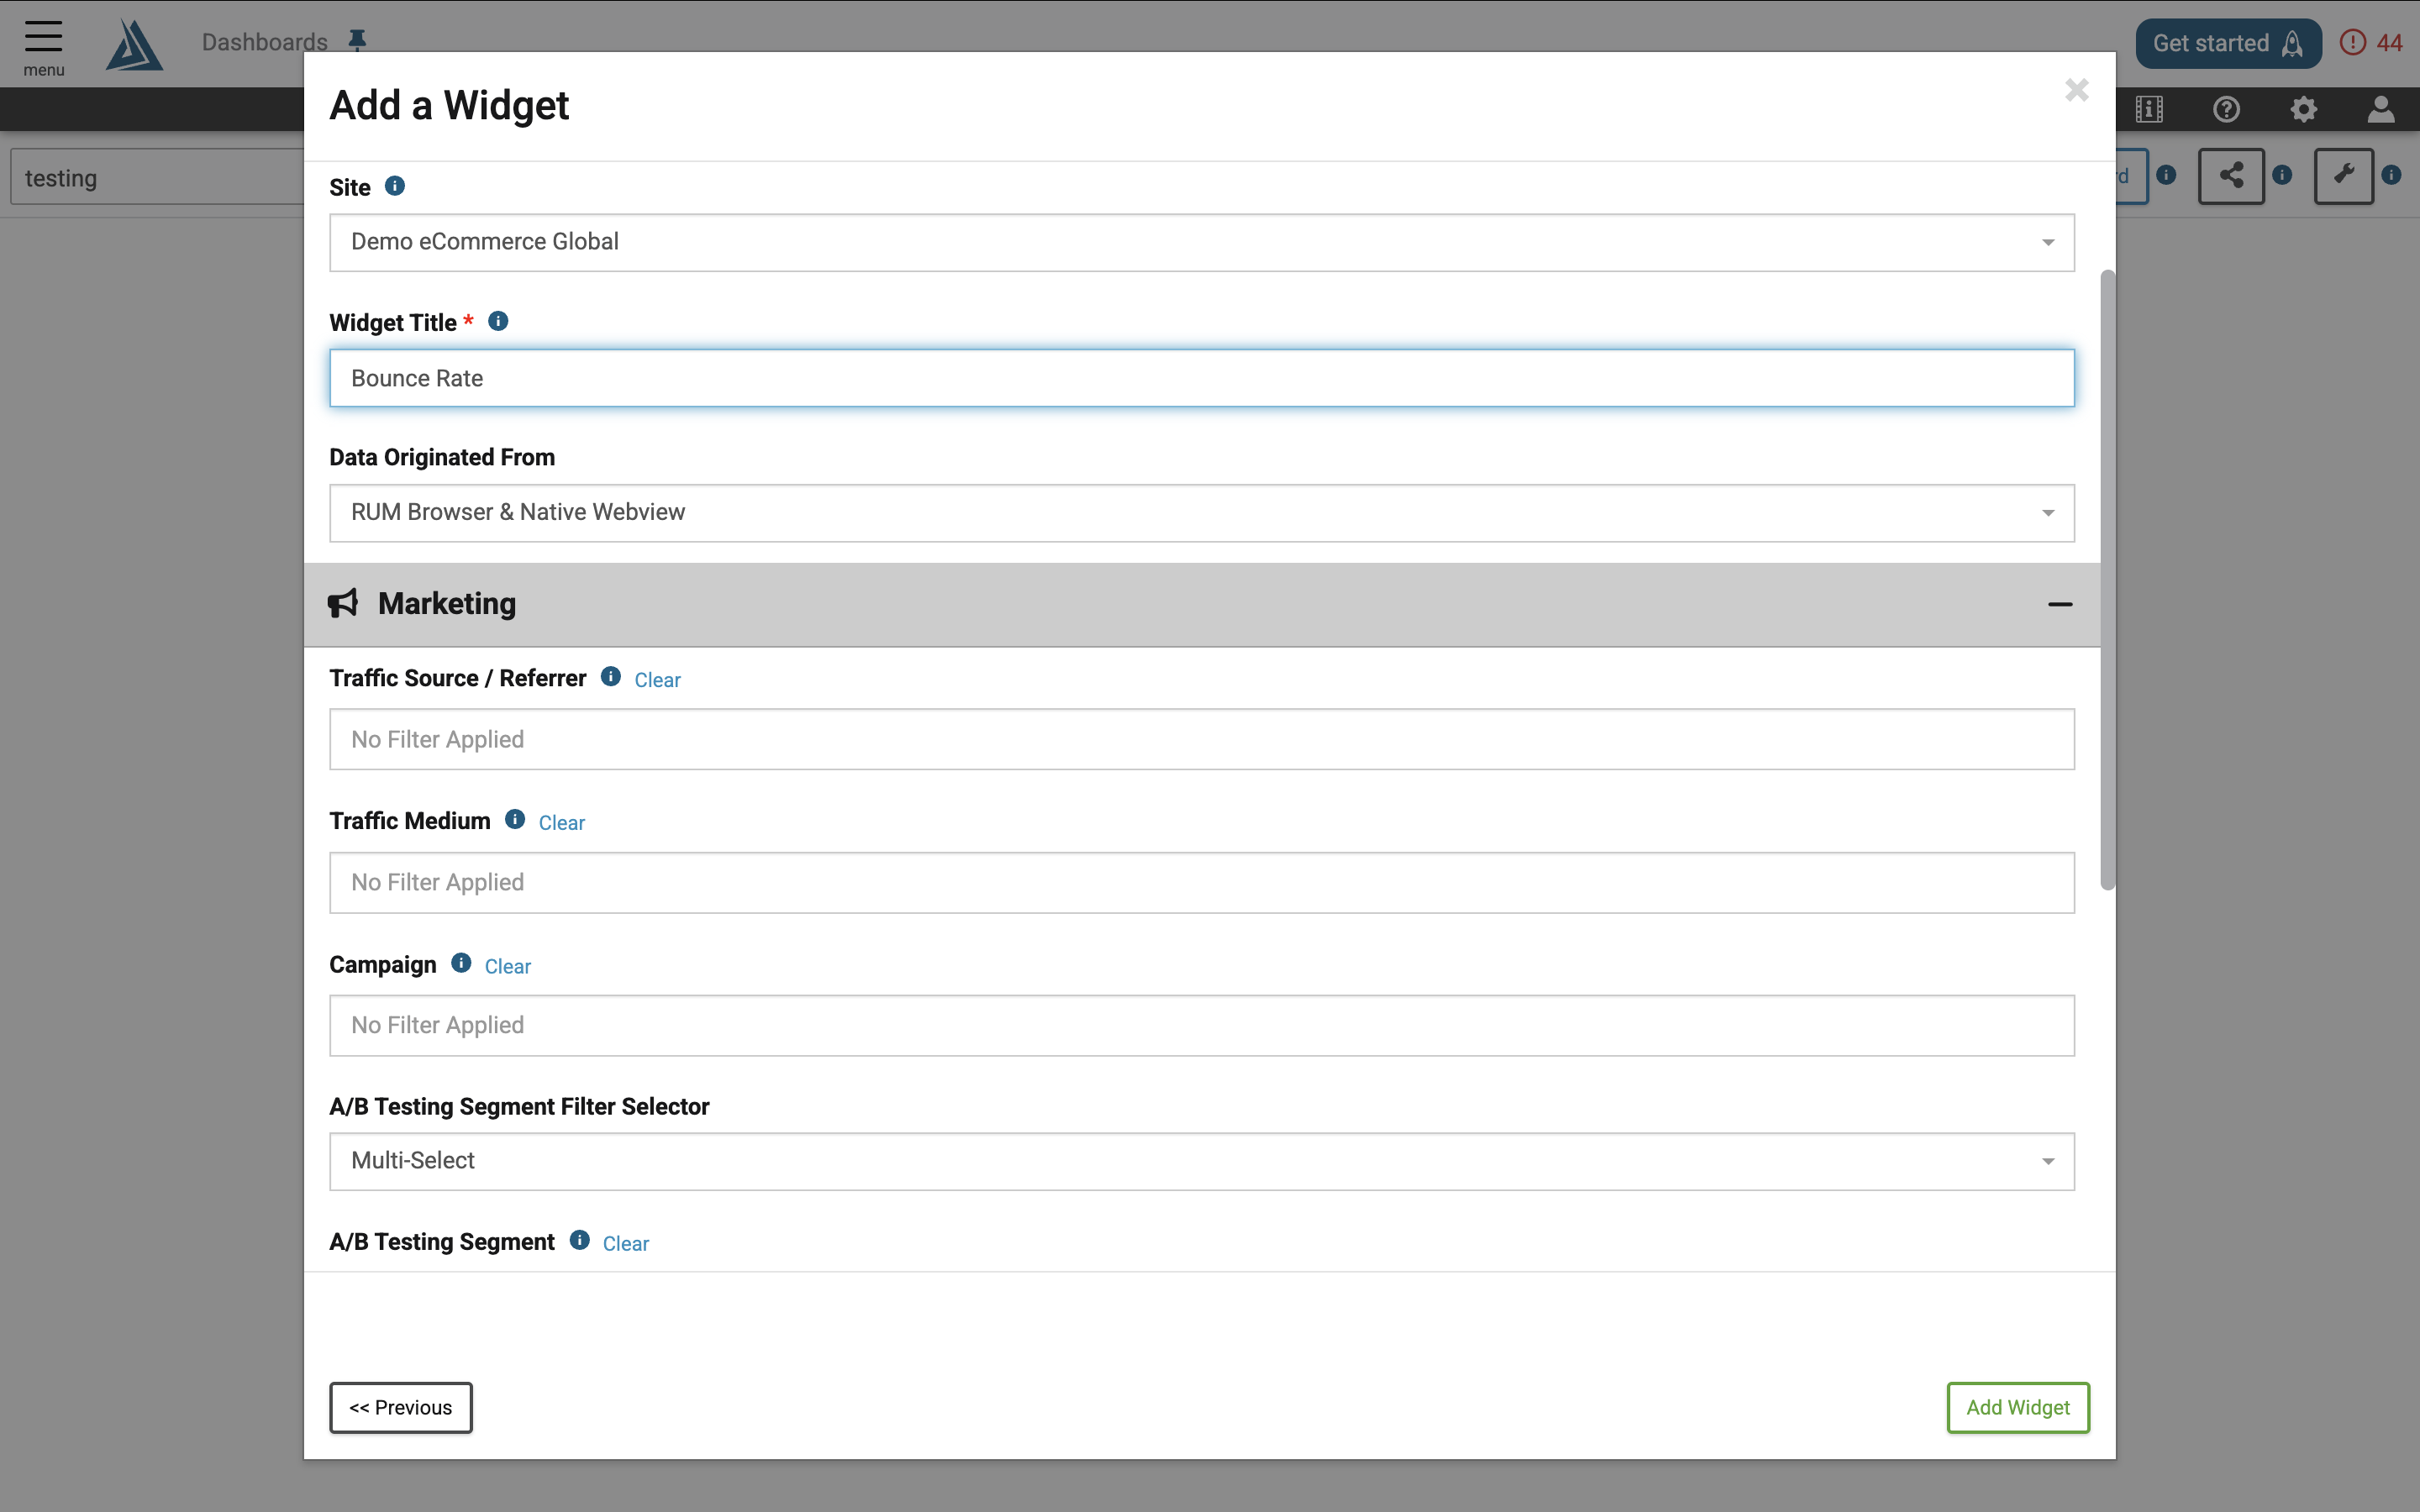
Widget Configuration
To configure this widget, fill out all required sections and apply any filtering you need.