

Overview
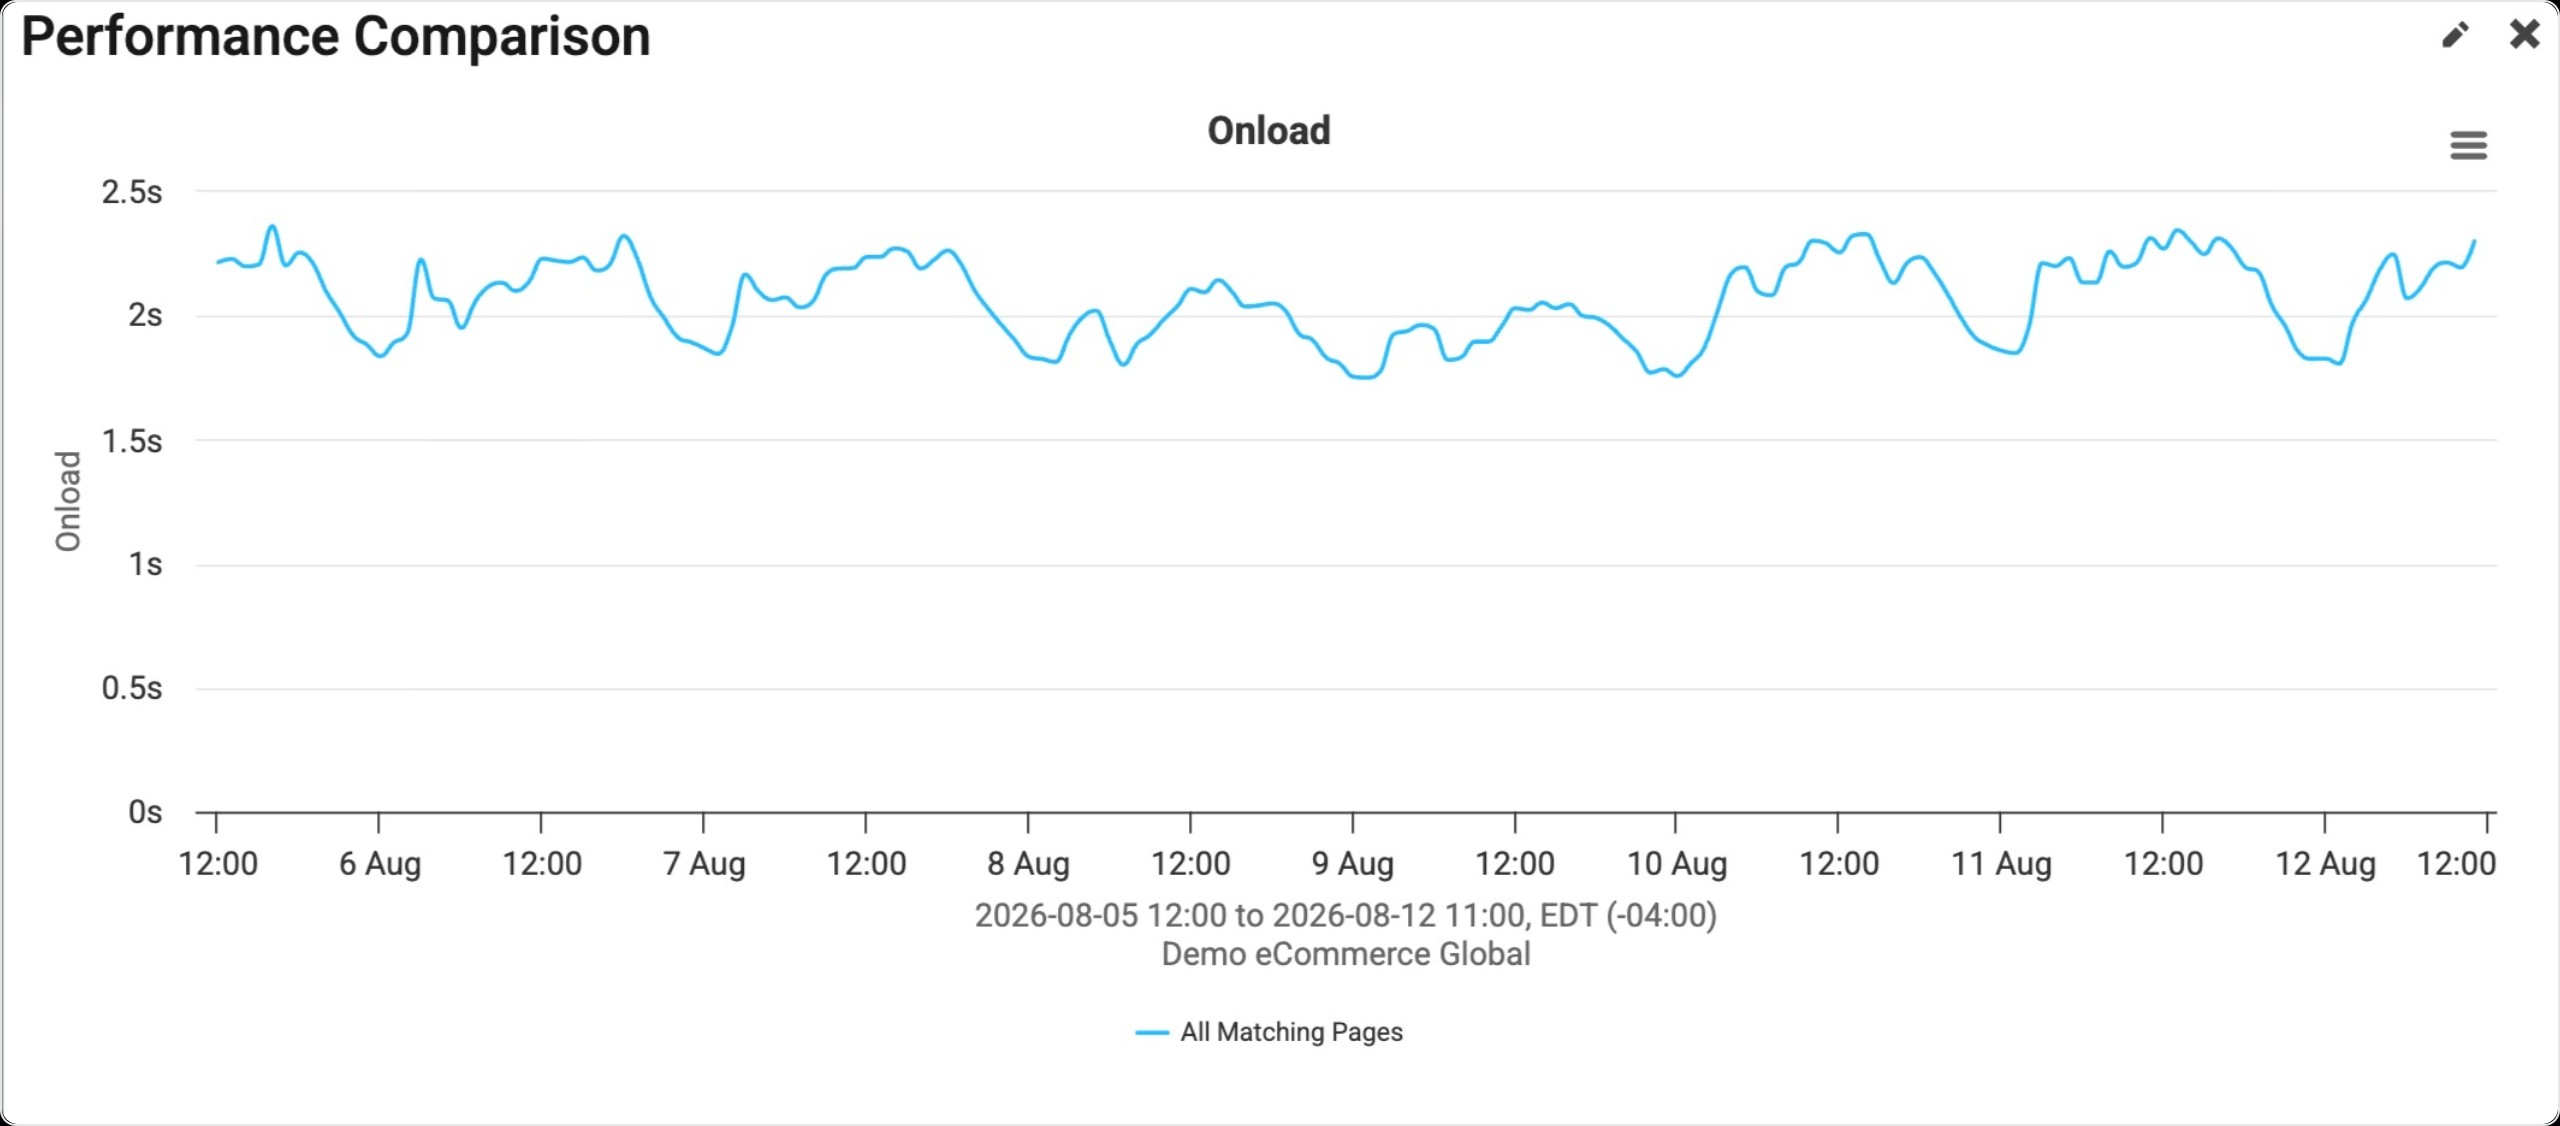
This widget is a line graph over time with each line representing a separate page for performance comparison that can be used with both RUM or Synthetic data.
Find Widget
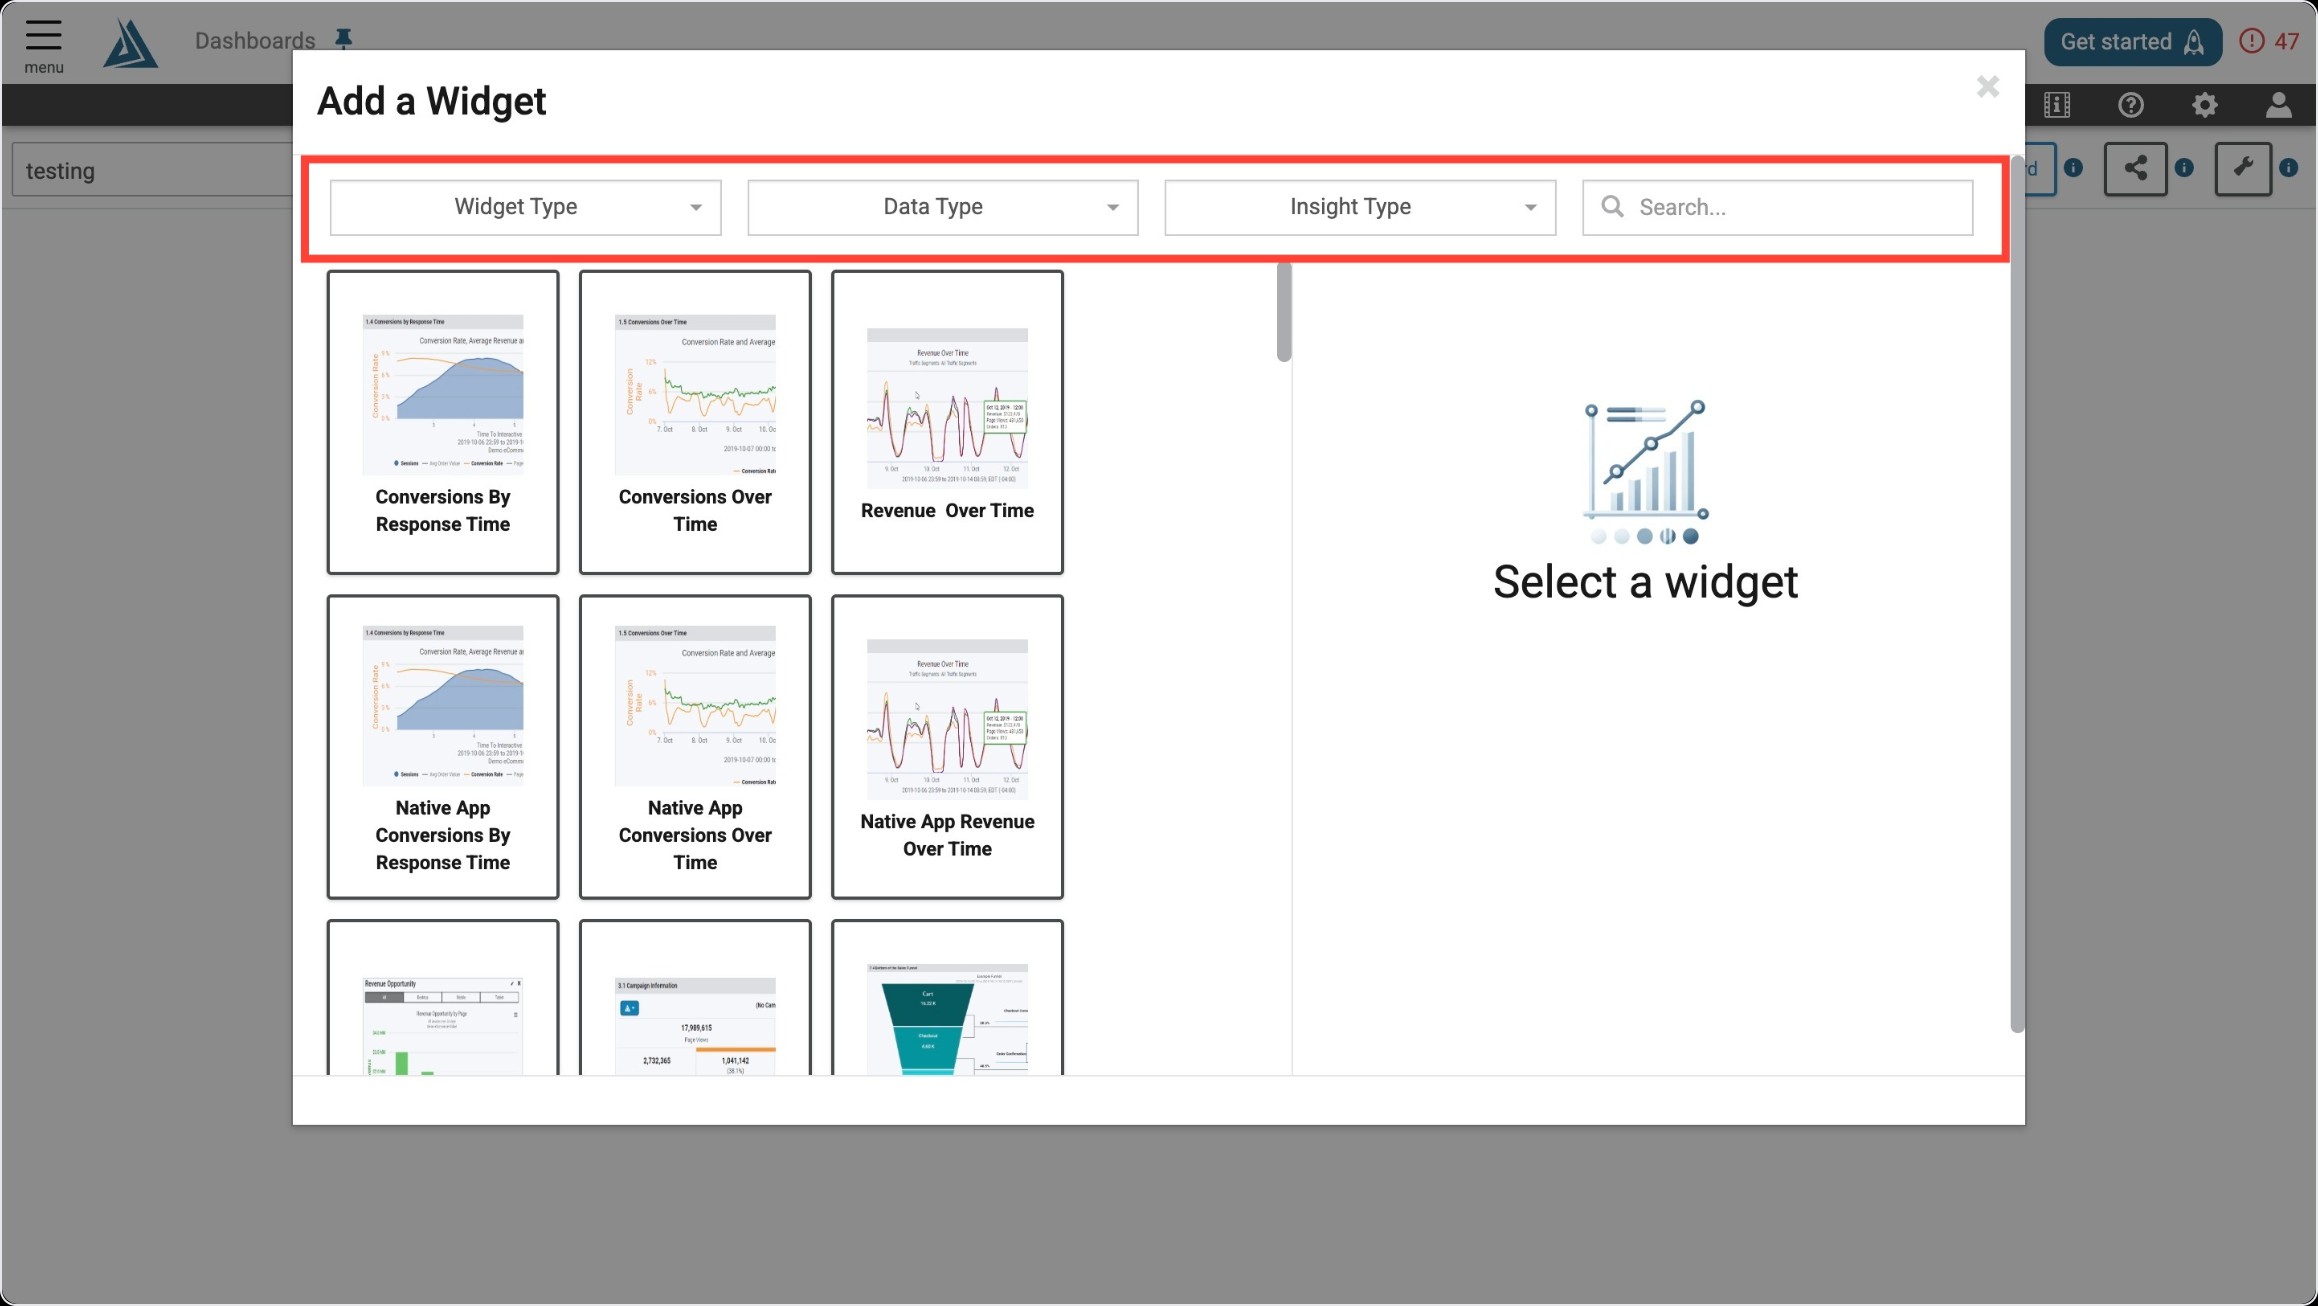
Once you enter the Add a Widget menu, you will see a variety of filter options on top. One way to find the Performance Comparison Widget is to use the filter options listed below.
|
Filter Title |
Filter Option |
|---|---|
|
Widget Type |
Comparisons |
|
Data Type |
Real User OR Synthetic |
|
Insight Type |
Performance |
Another way to find the Performance Comparison Widget is to use the search bar at the top right of the menu.
Widget Configuration
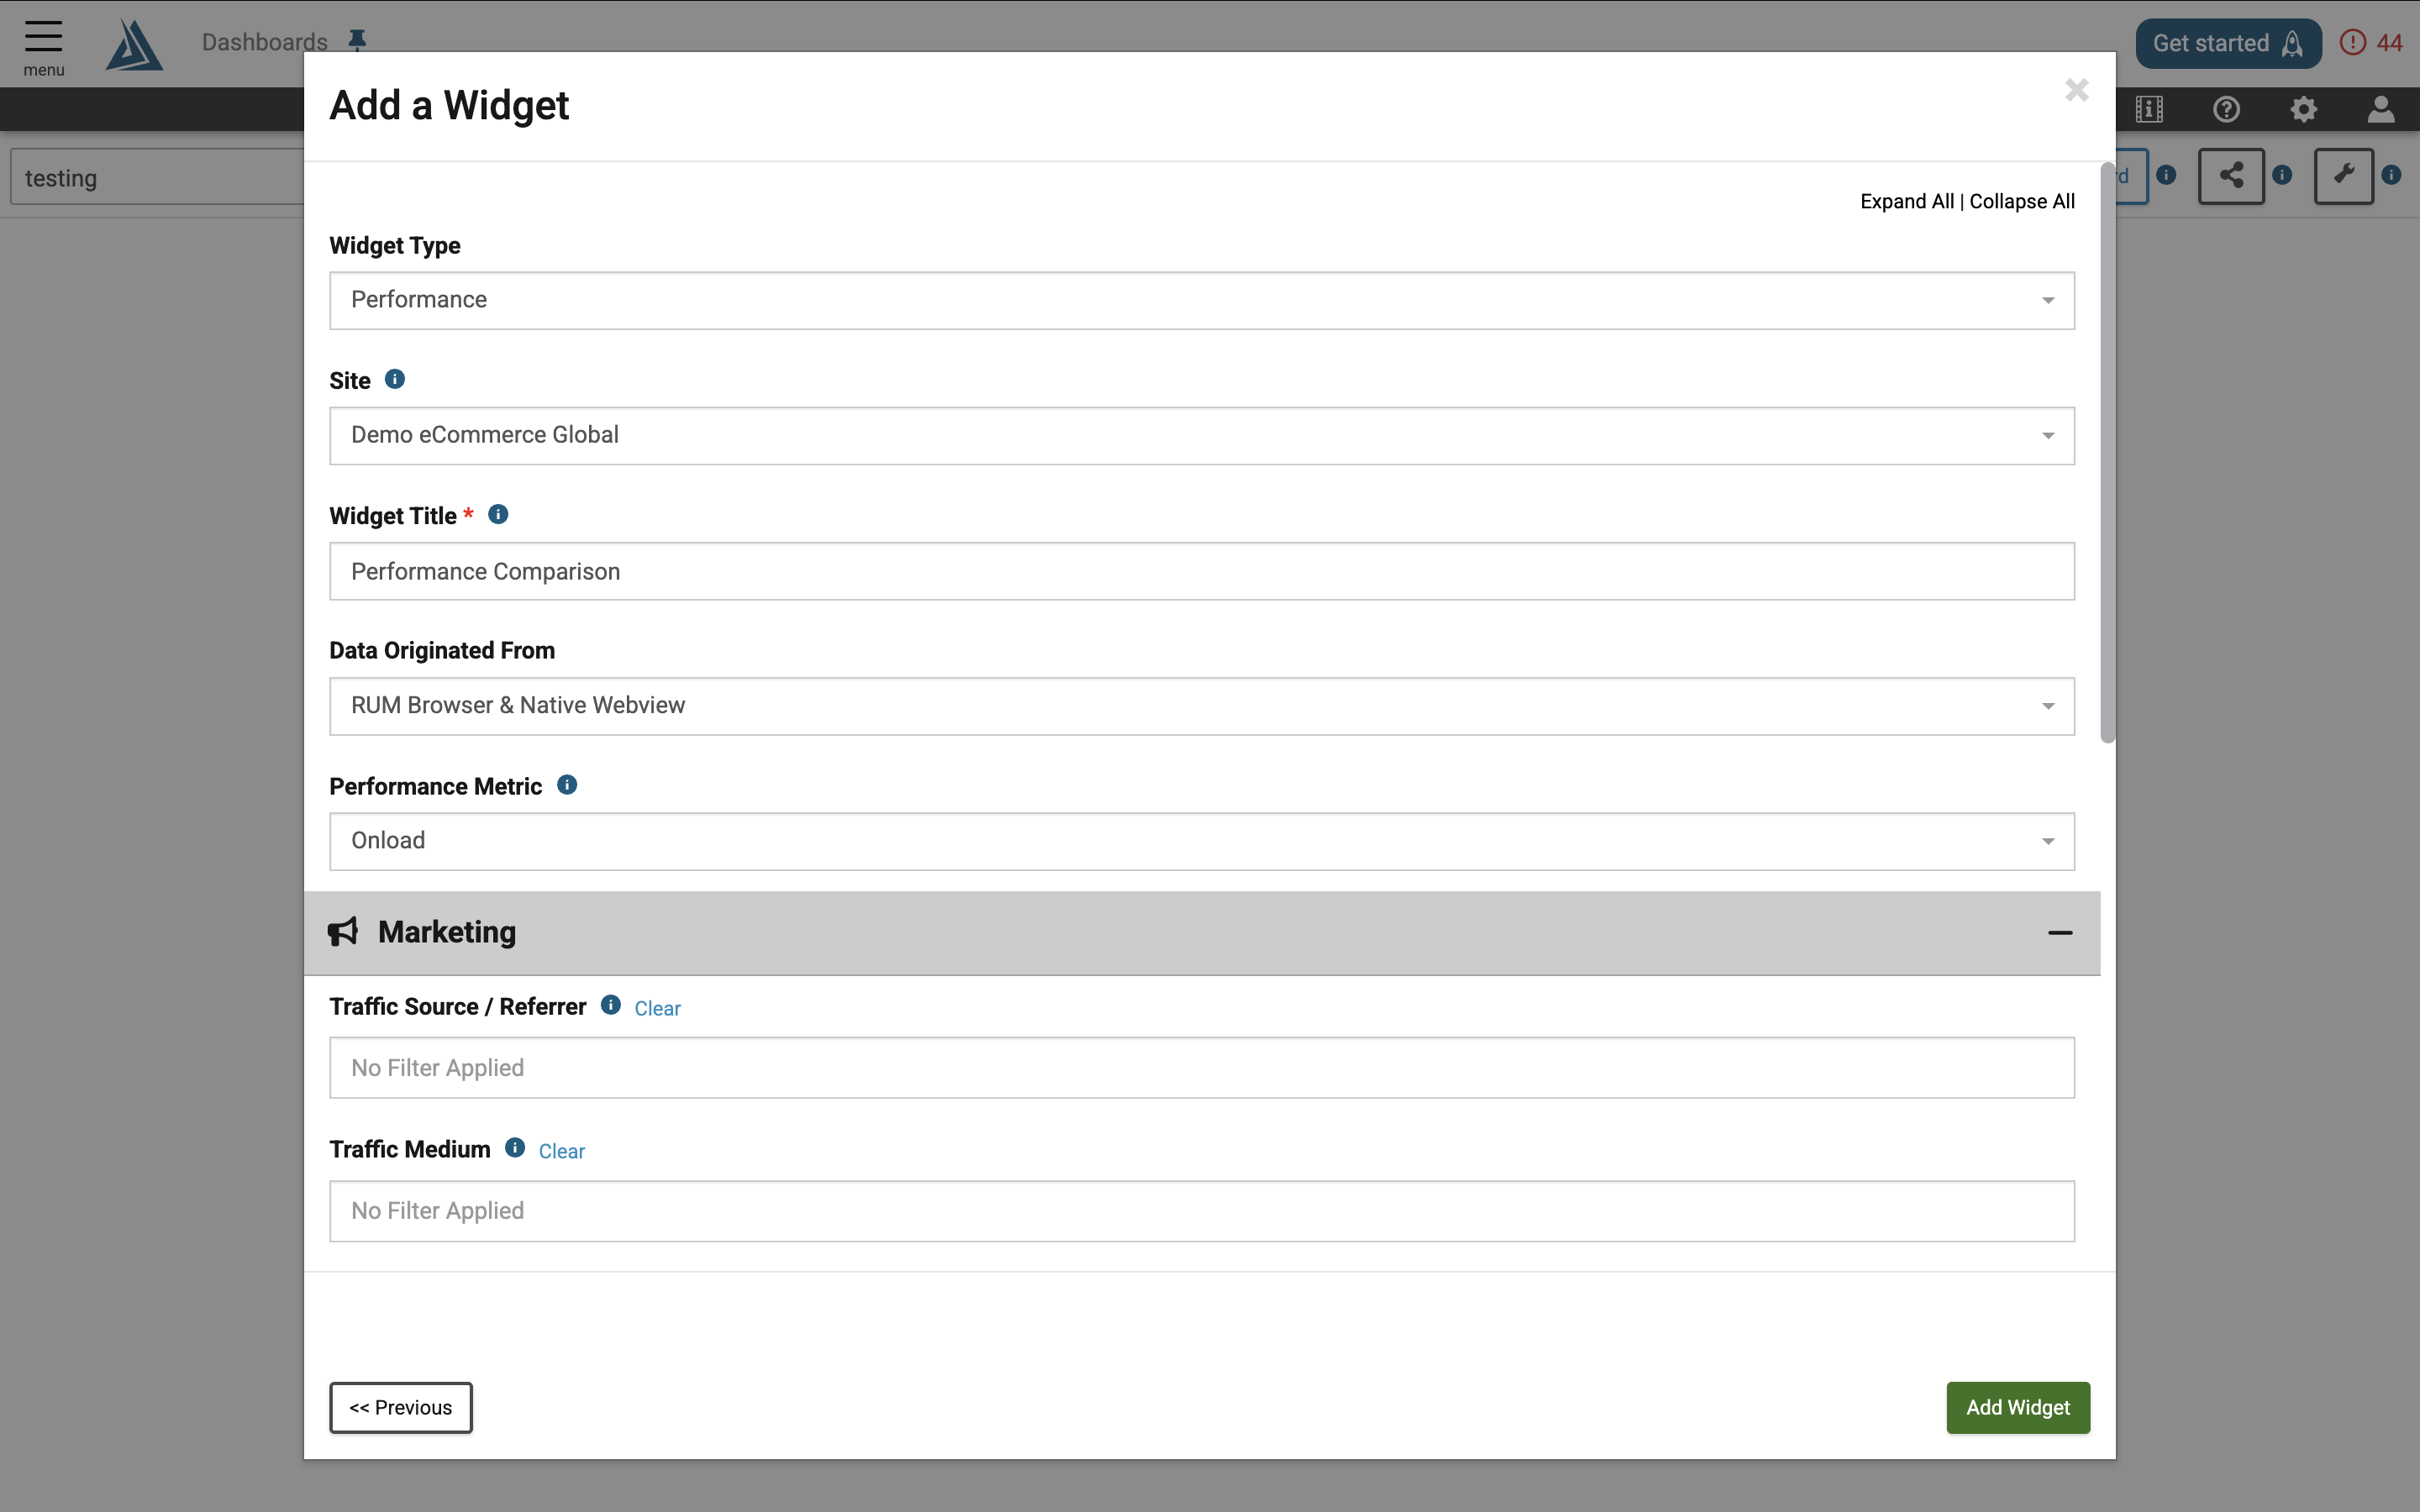
To configure this widget, fill out all required sections, choose the appropriate data origin, and apply any filtering you need.
Performance Metrics
The following metrics can be viewed on the Performance Comparison Widget
|
Onload |
Time to DOM Content Loaded |
Largest Contentful Paint |
First Input Delay |
Base Page |
|
DOM Duration |
Time to Interactive |
Total Blocking Time |
DNS |
SSL |
|
Time to DOM Interactive |
First Contentful Paint |
Cumulative Layout Shift |
TCP |
First Byte |