Overview
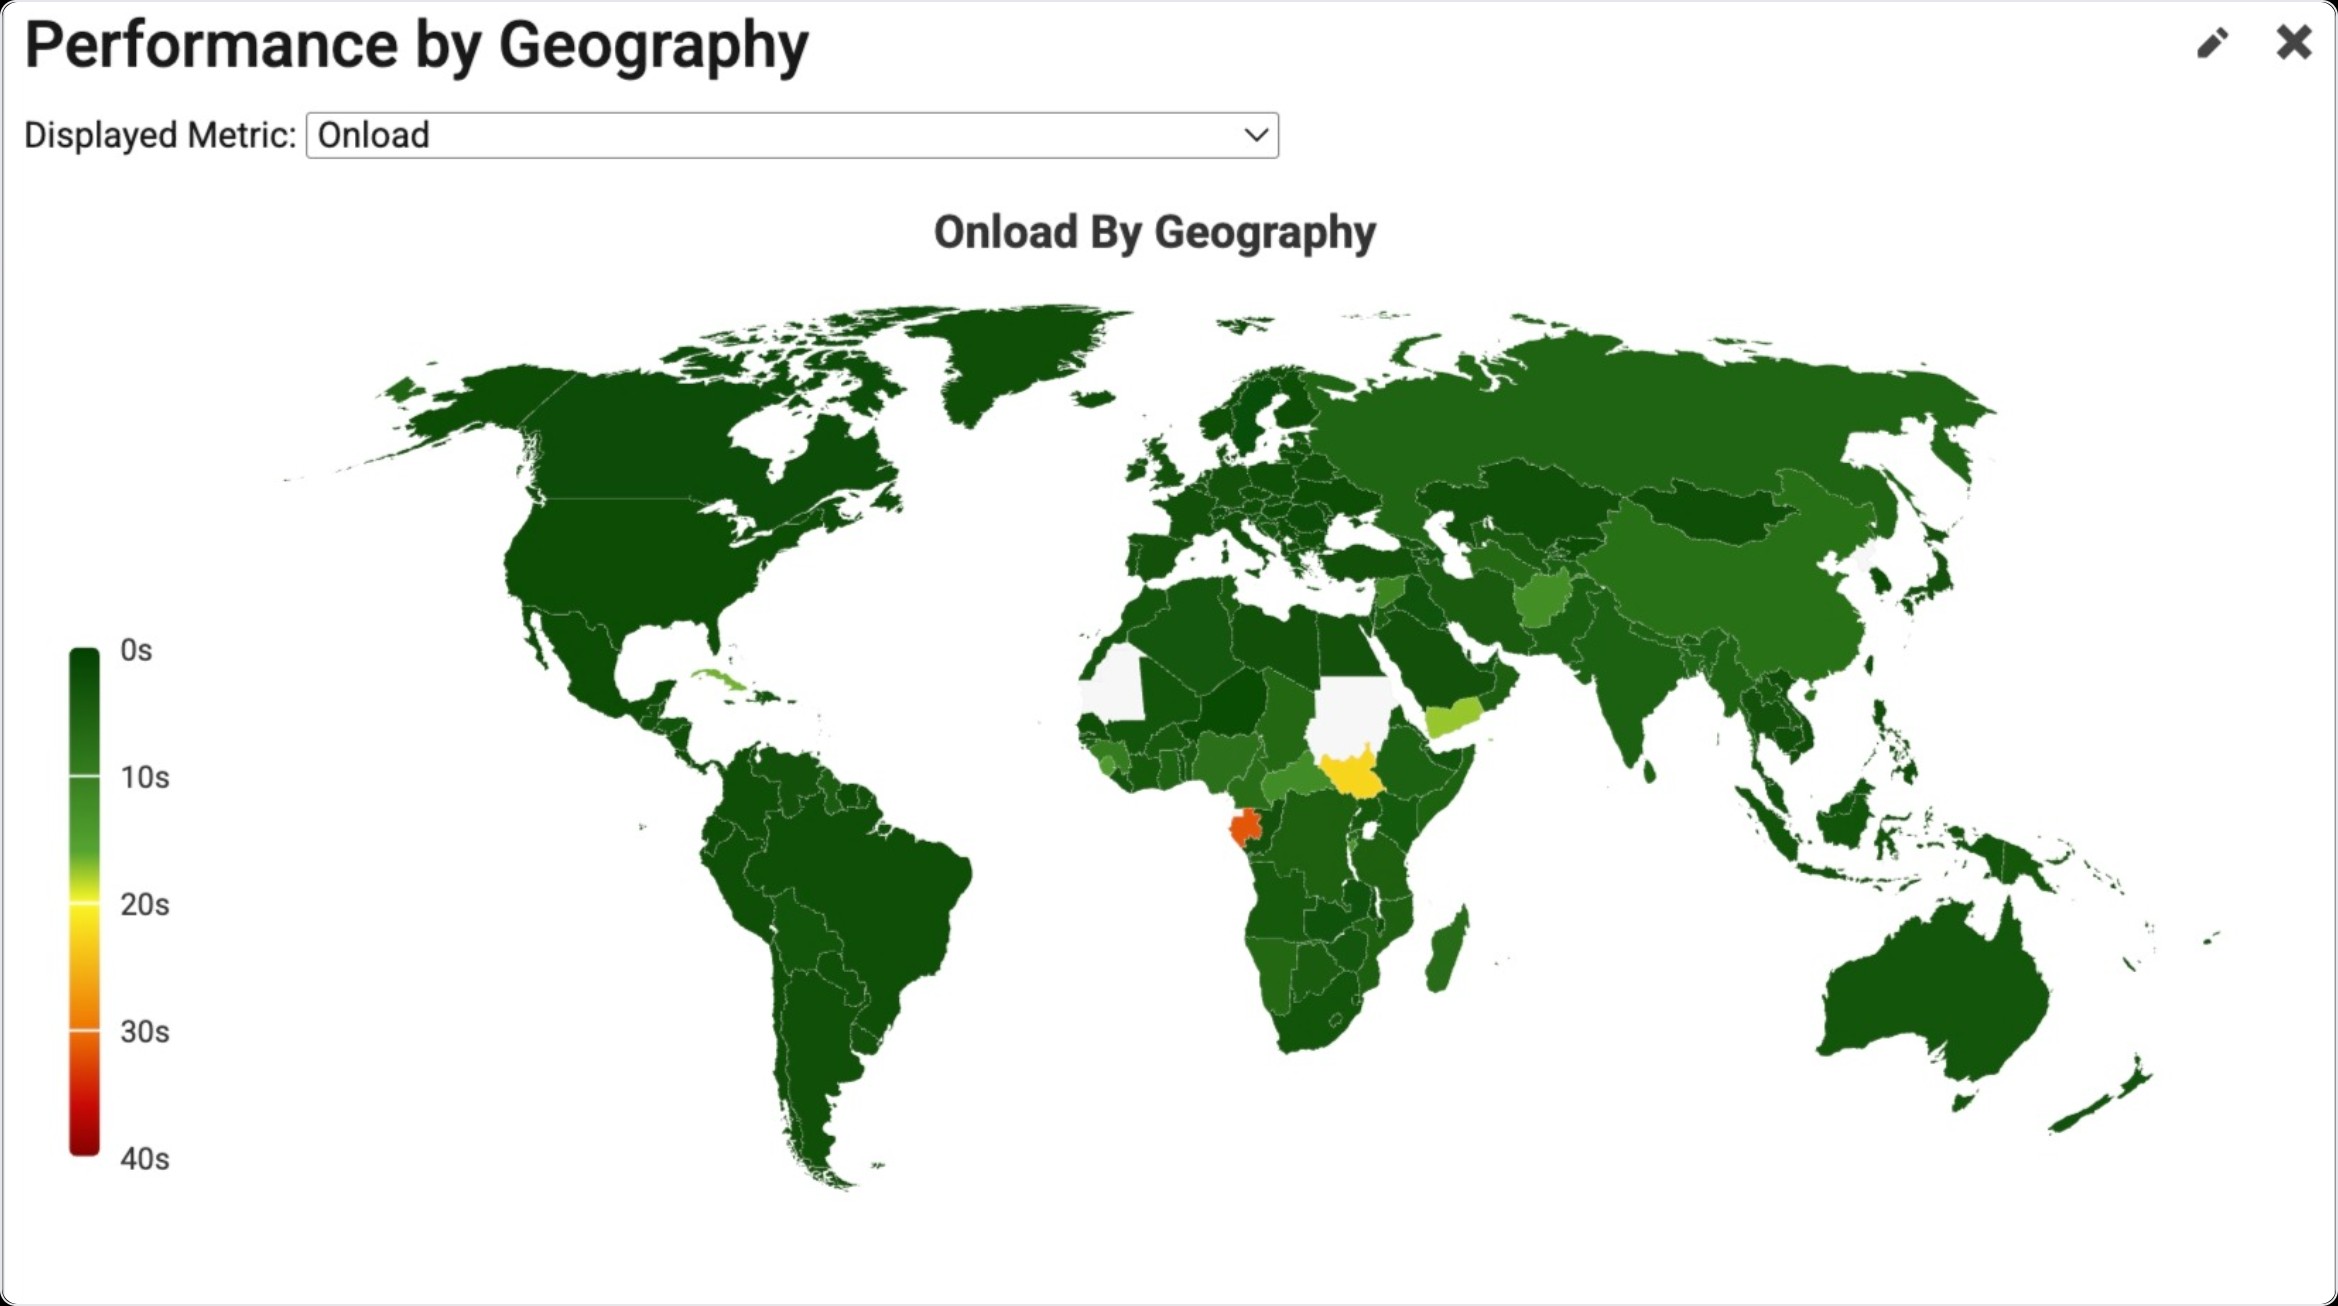
This widget is a global performance heat map, available for both Synthetic and RUM data.
Find Widget
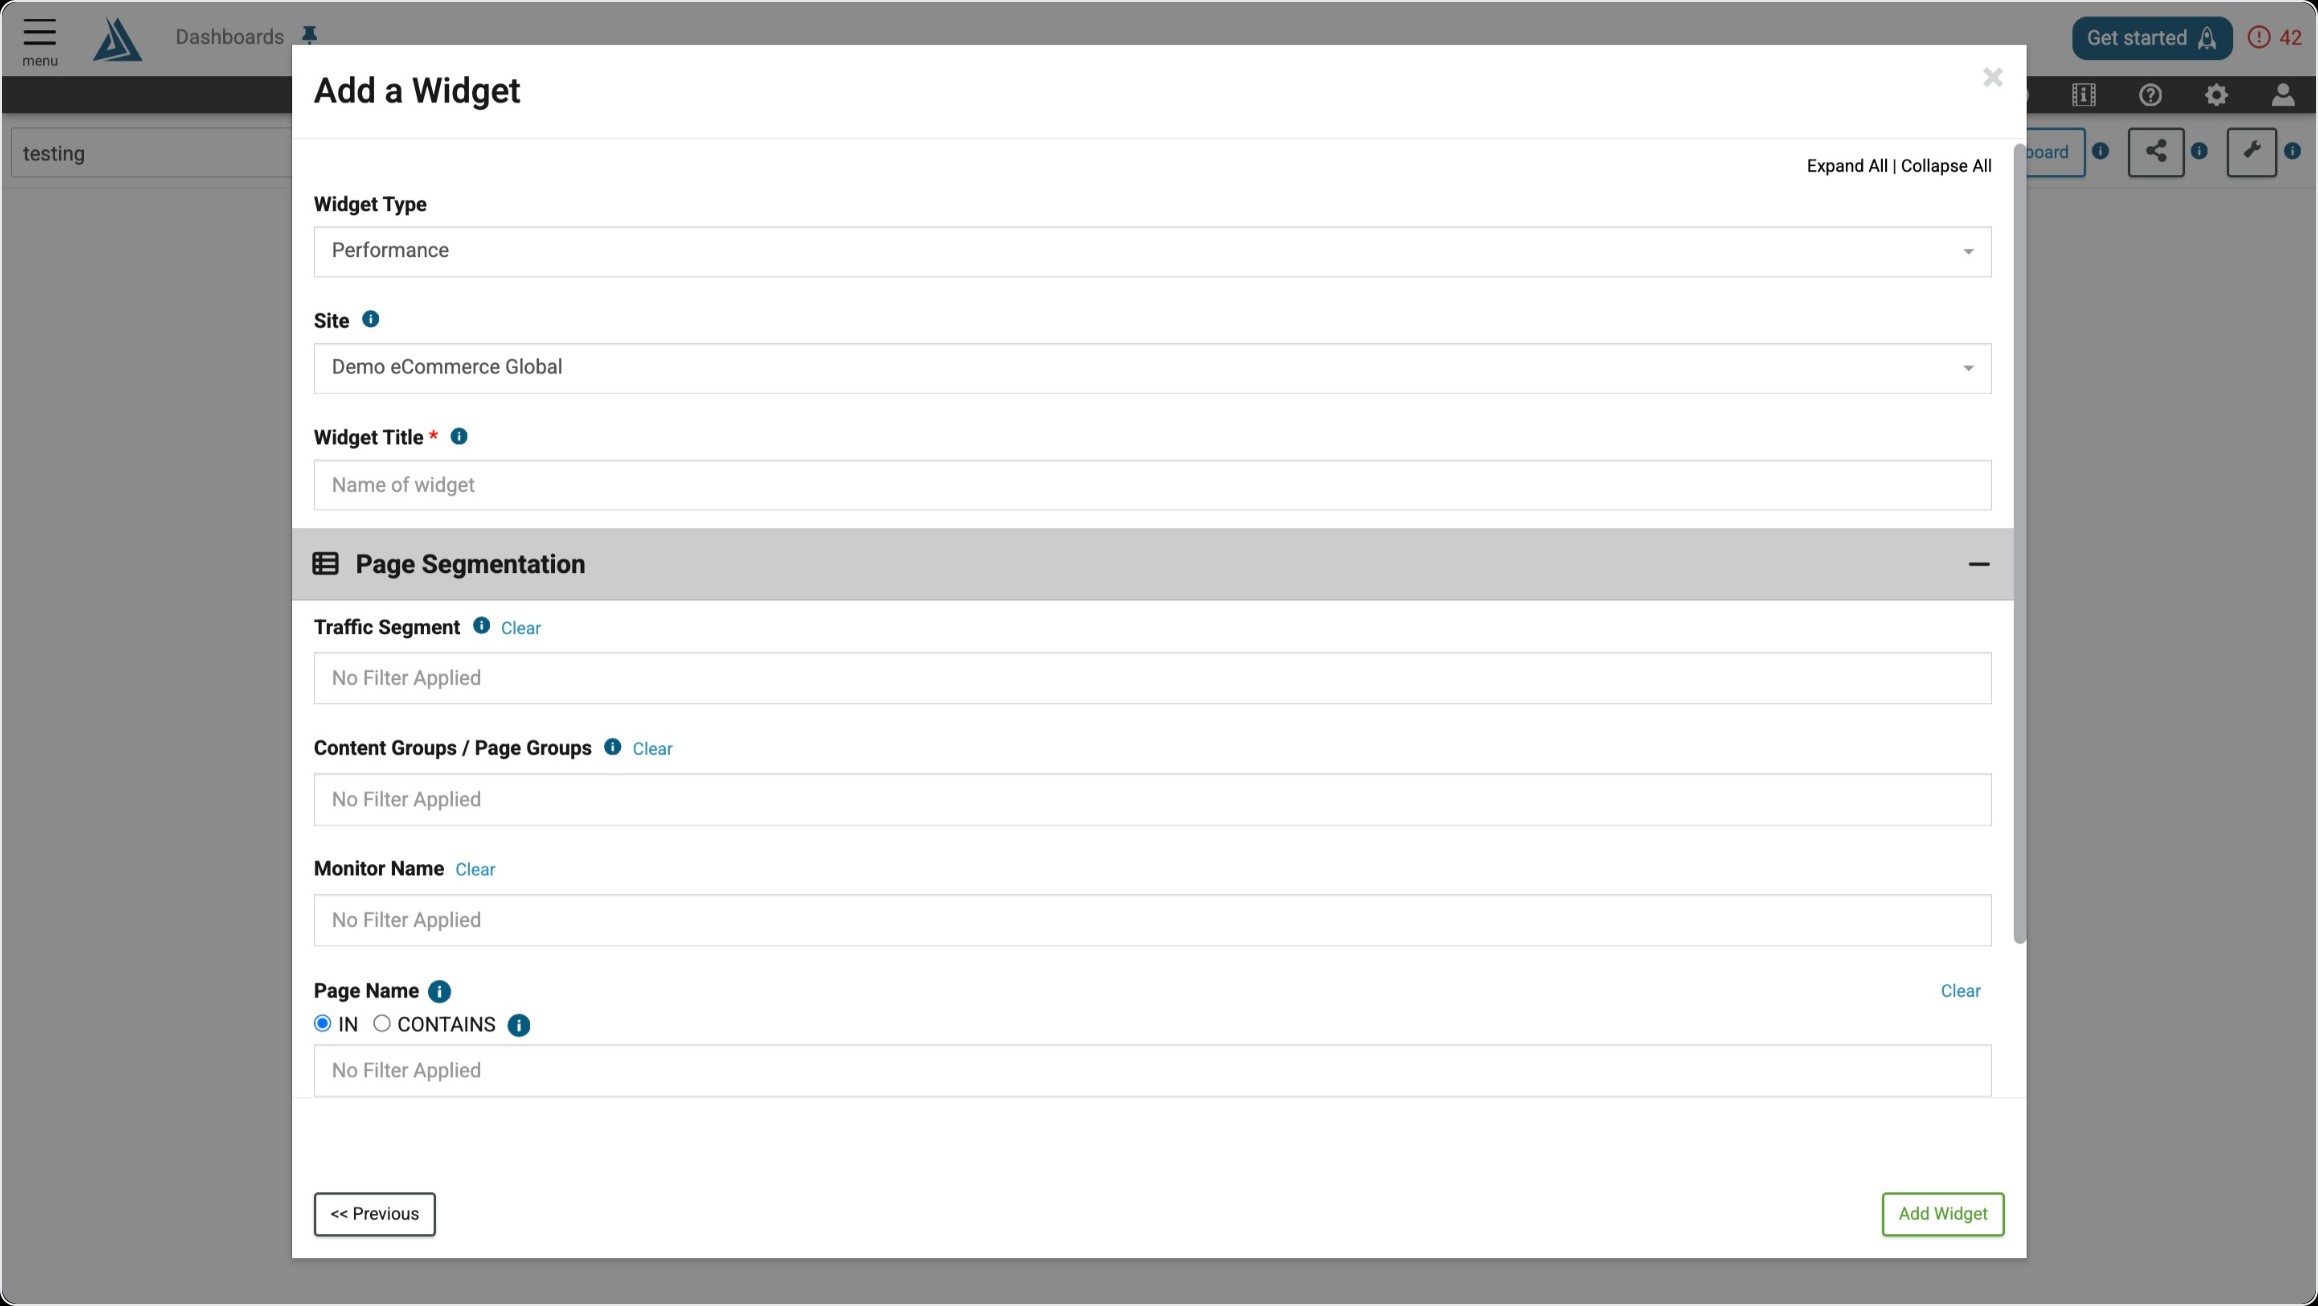
Once you enter the Add a Widget menu, you will see a variety of filter options on top. One way to find the Performance Widget is to use the filter options listed below.
|
Filter Title |
Filter Option |
|---|---|
|
Widget Type |
Summaries |
|
Data Type |
Real User OR Synthetic |
|
Insight Type |
Performance |
Widget Configuration
To configure this widget, fill out all required sections and apply any filtering you need.
Displayed Metric
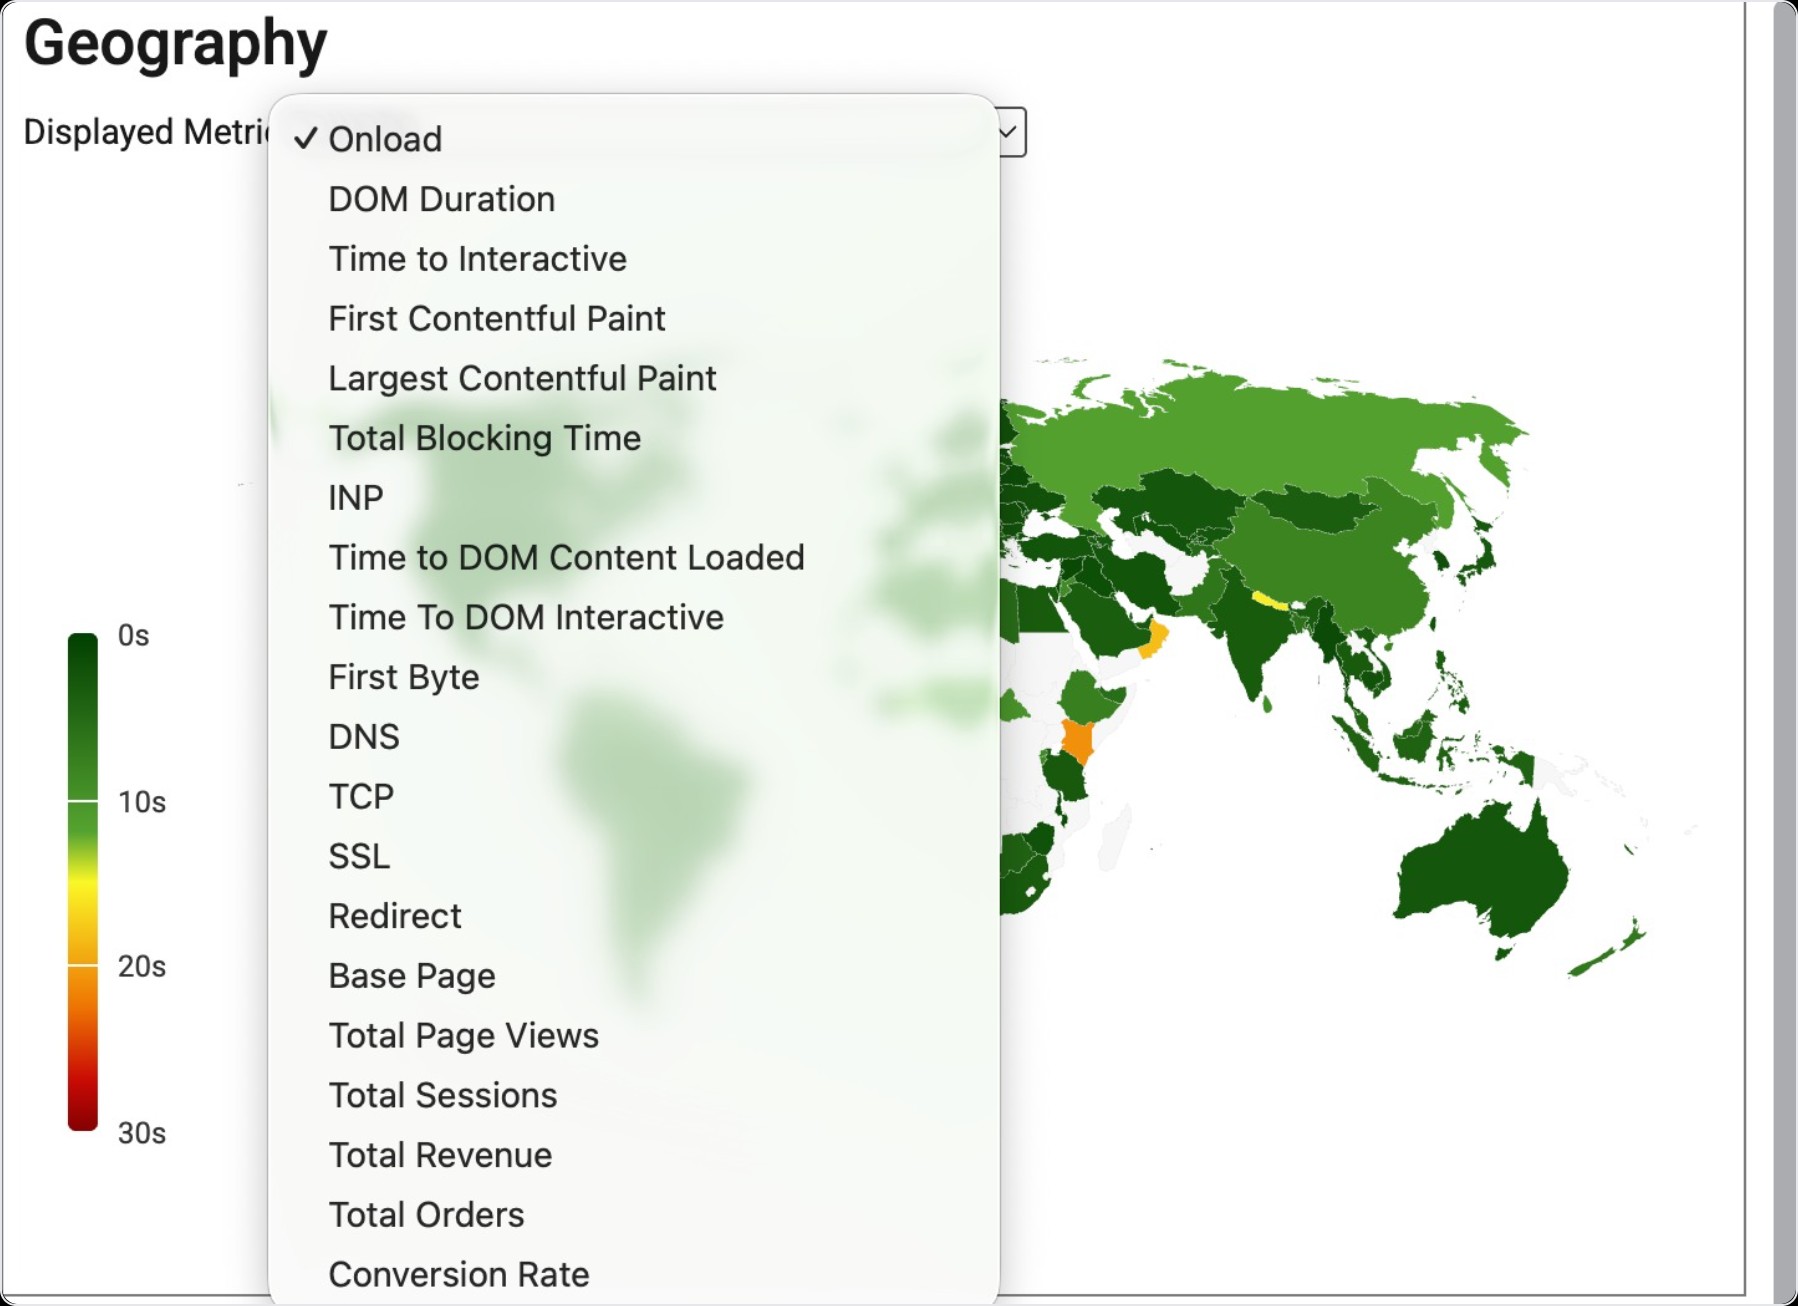
To change the displayed metric for this widget, click on the drop down menu at the top.
Map Navigation
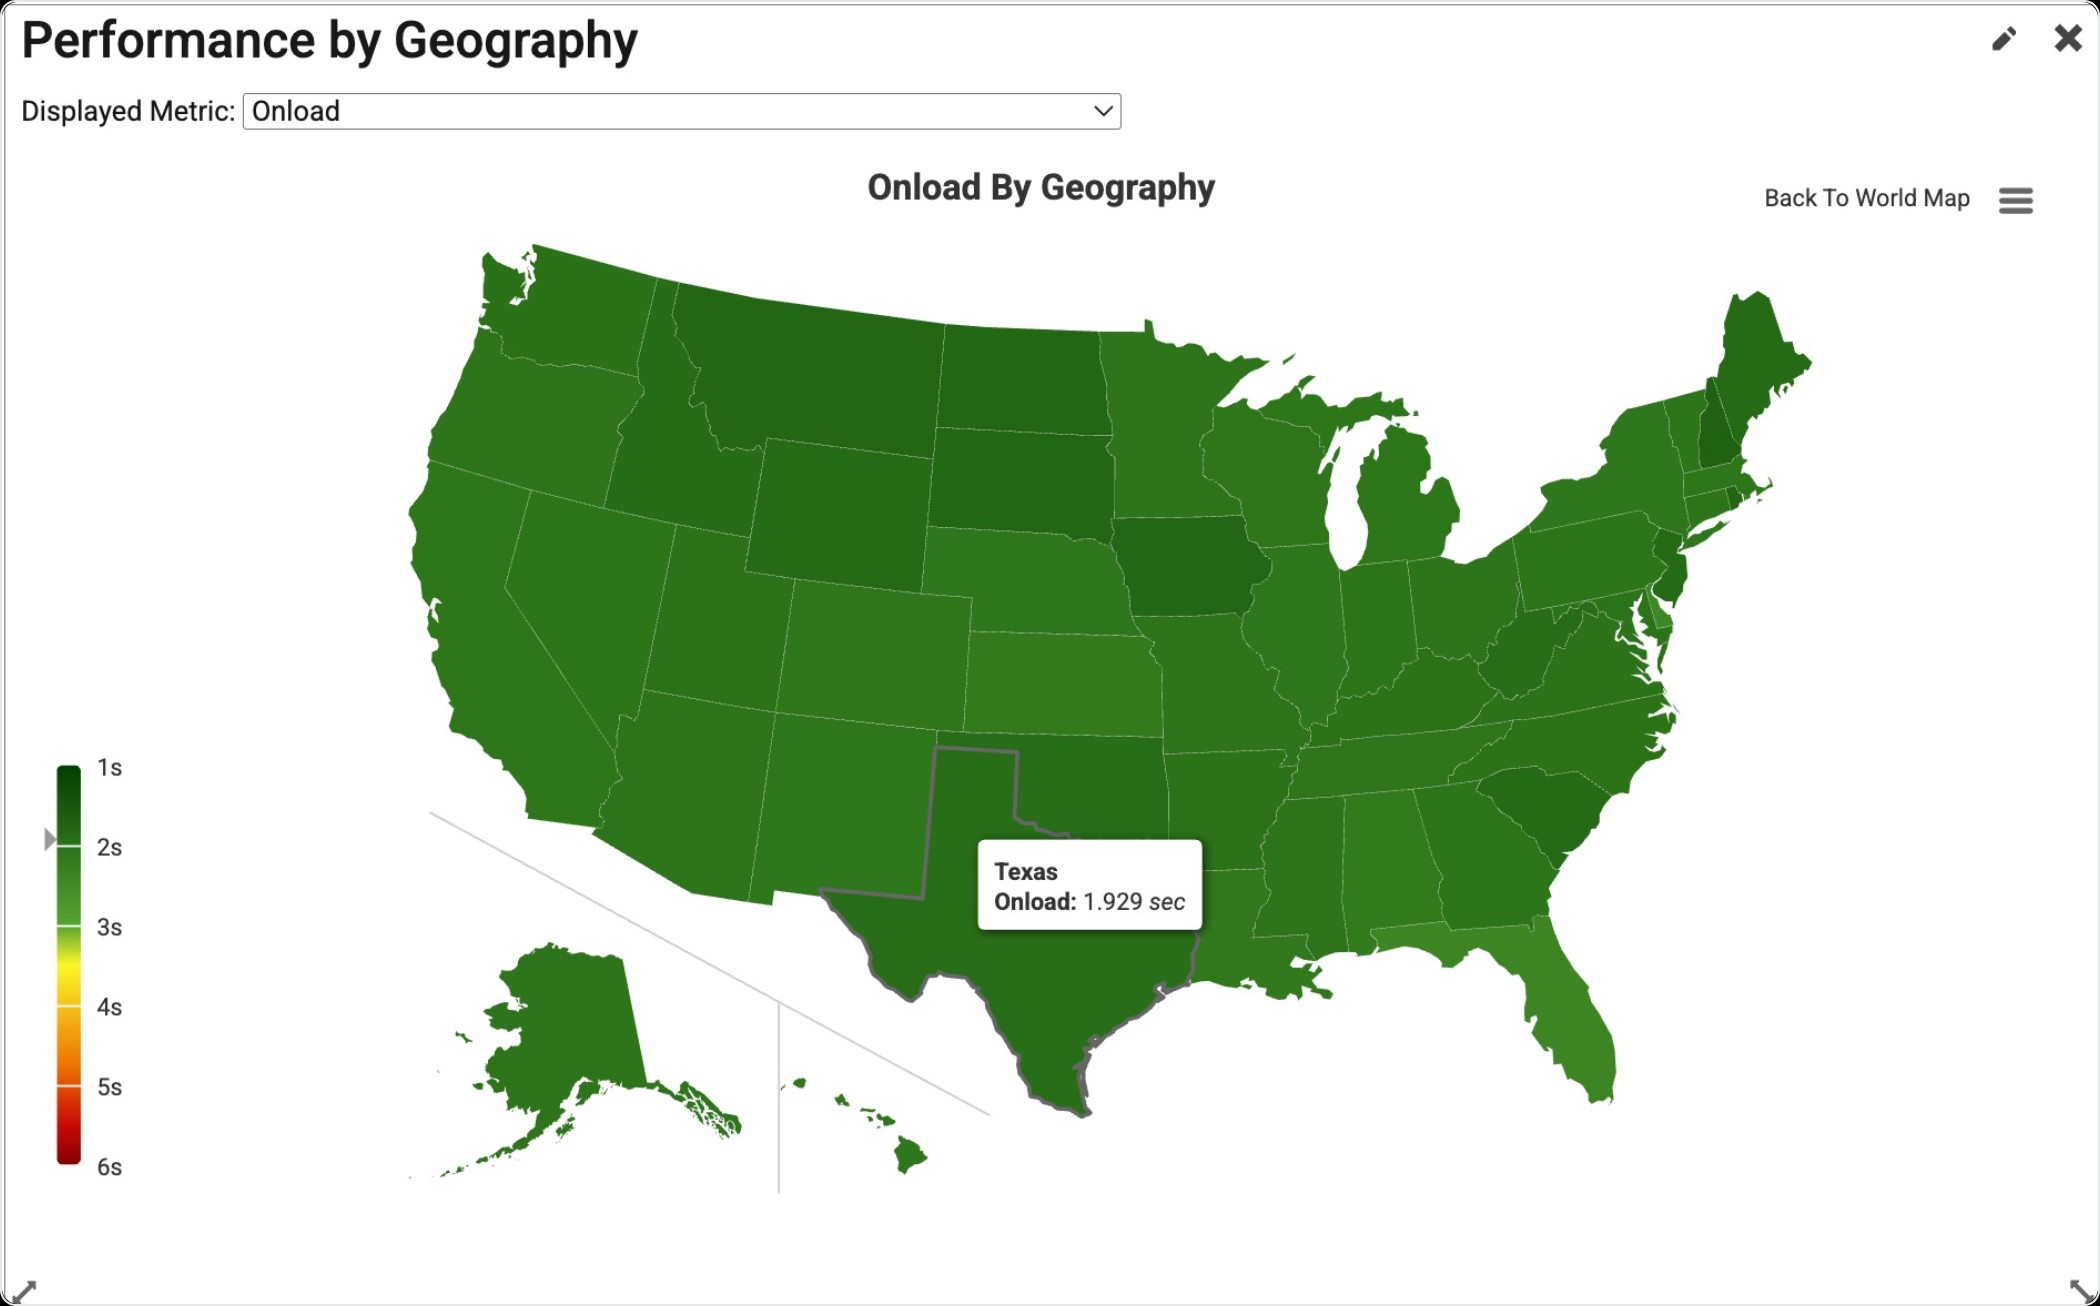
Hovering your mouse over the countries and regions displays a tool-tip reading of the name of the country or region and the Onload performance, over the Dashboard Time Period. As you move your mouse around the globe, an arrow appears on the legend to the left indicating where on the scale the performance for the country or region you are hovering over lies.
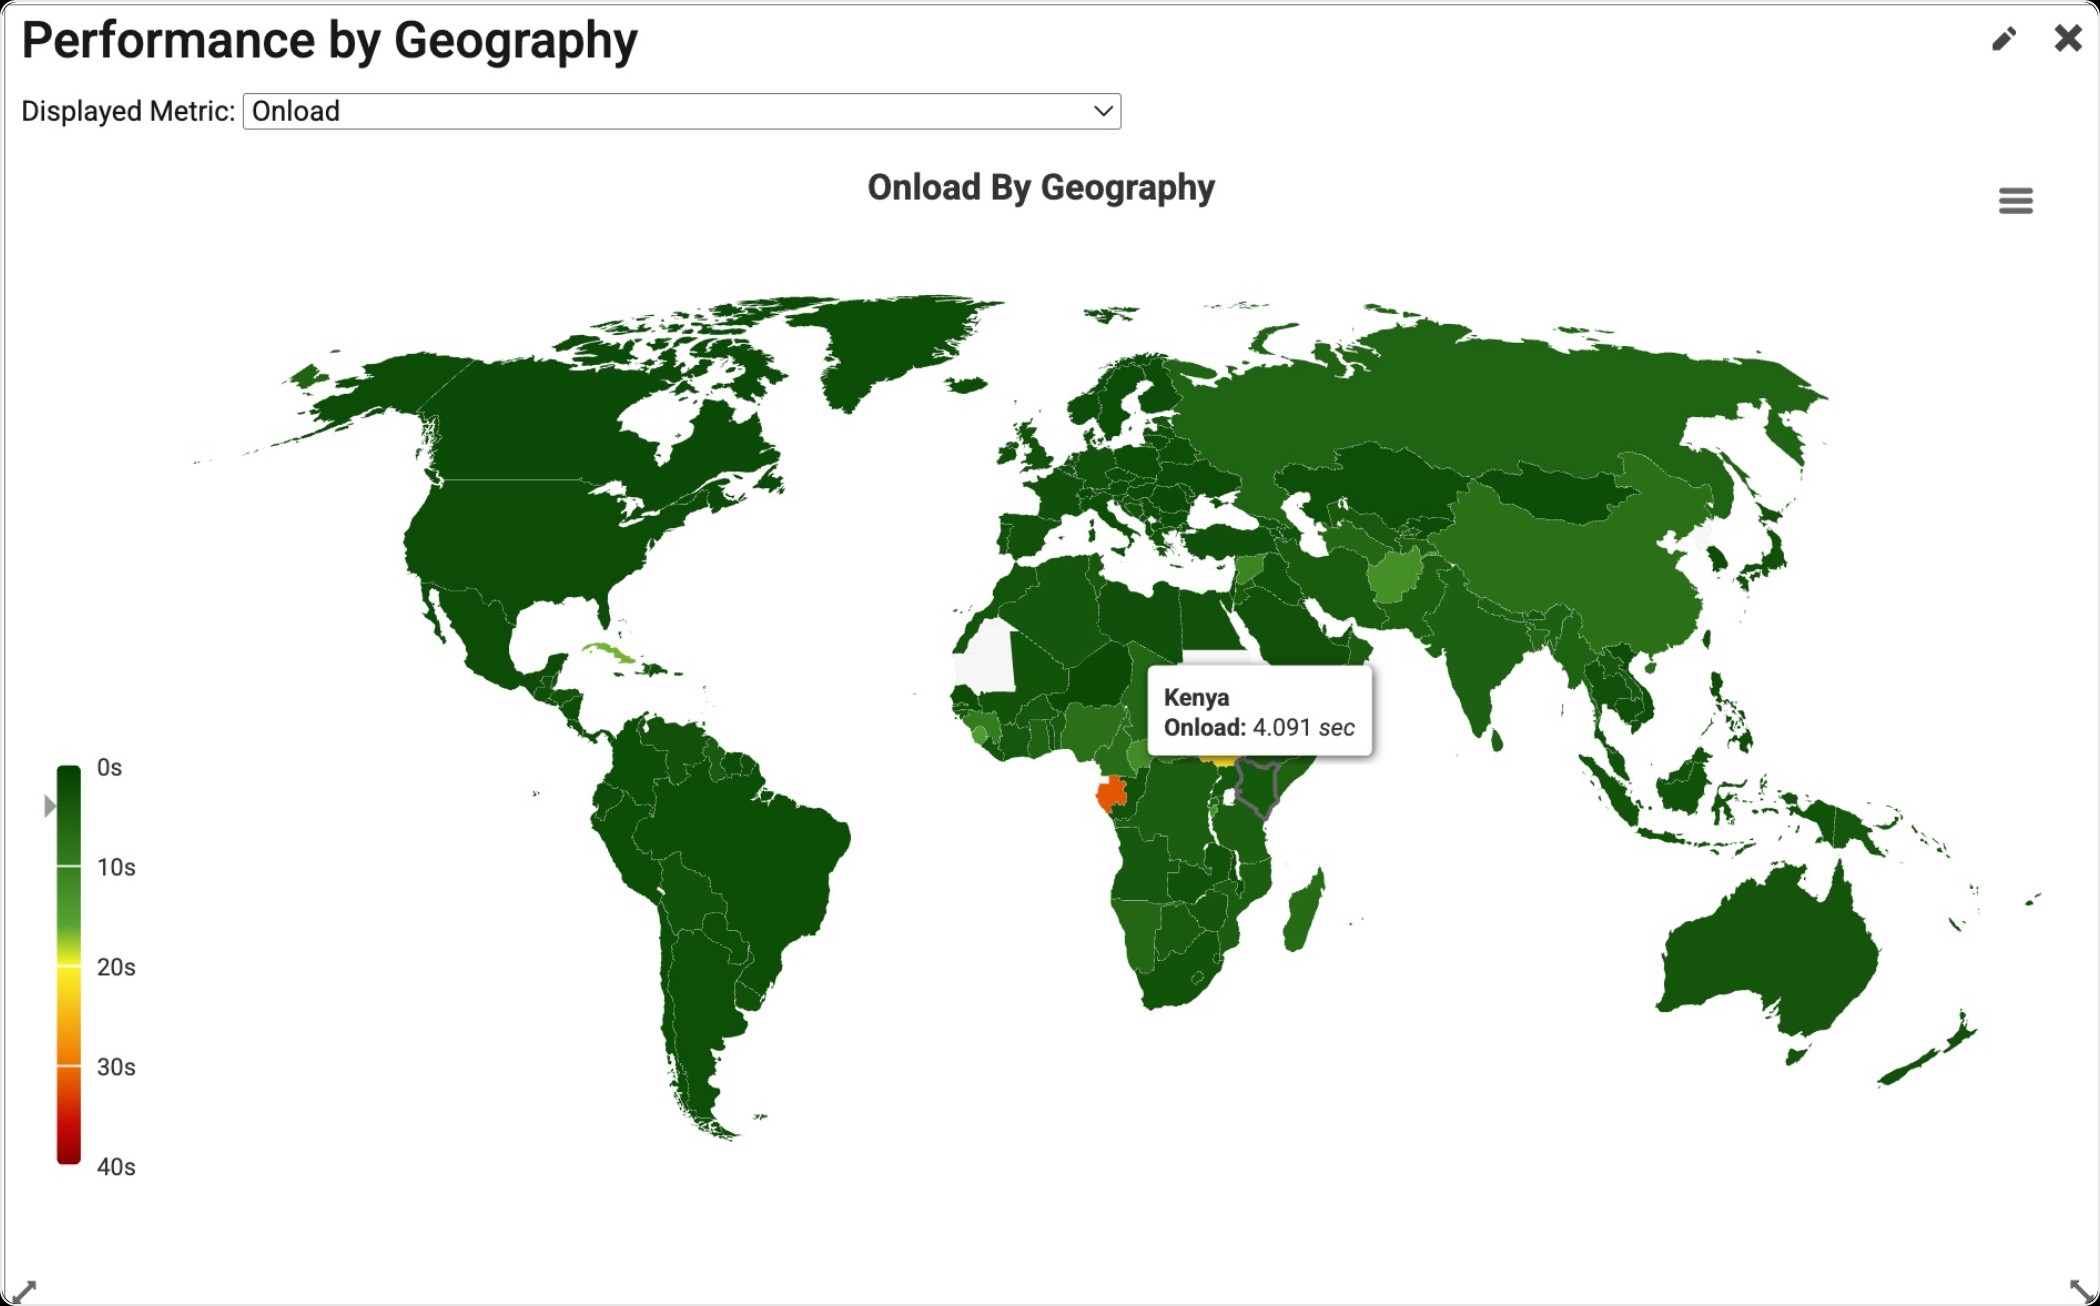
Note you can click on a country to drill into the sub-regions or states. A button will appear in the top right to go back to the default world view. Not all countries will have sub-regions, in which case the graph will zoom into the area or continent surrounding the selected country.