Overview
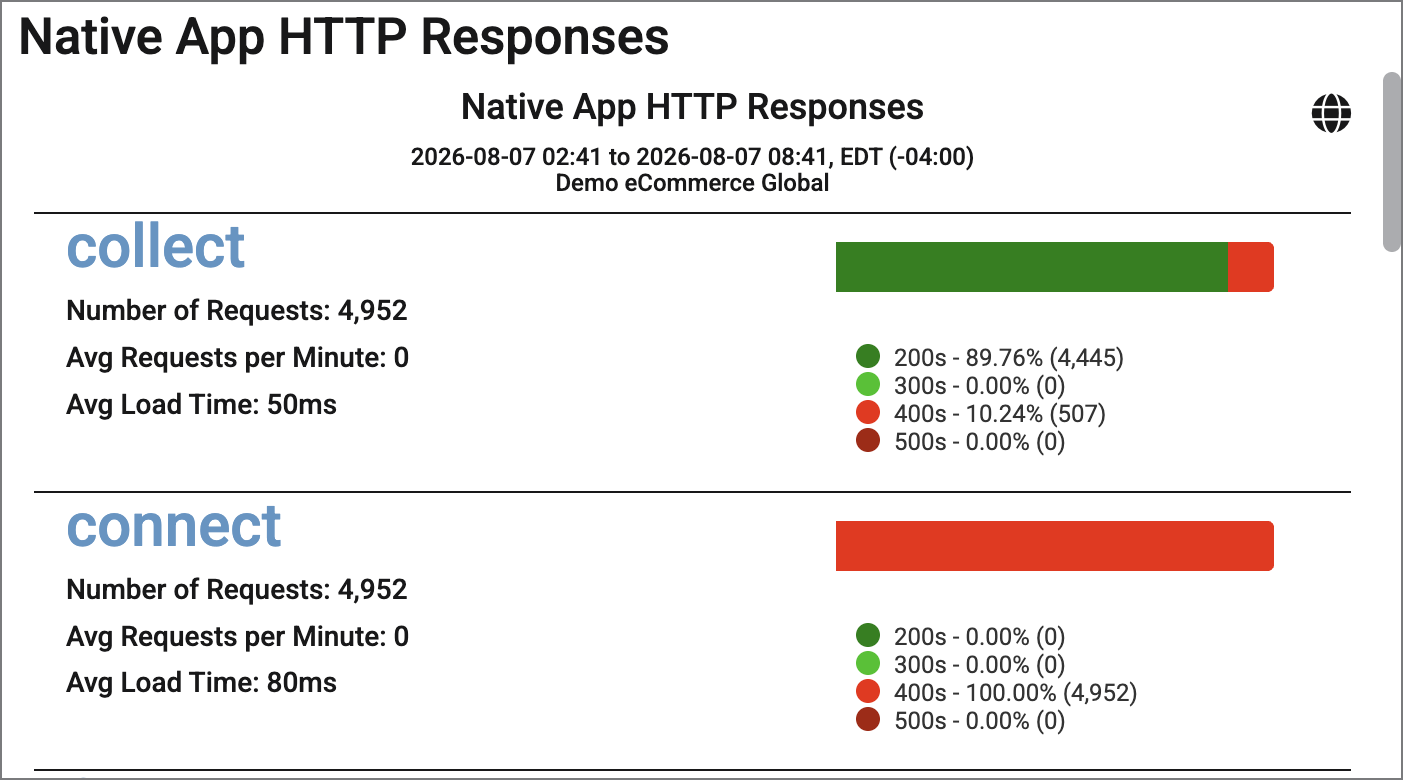
The Native App HTTP Responses widget helps users visualize the Native App HTTP Failures experienced over a specified period of time by displaying the top 10 Network Requests by error count. Navigation from this widget will take the user to the Native App Aggregate Waterfall page.
|
This widget is available to be added to custom dashboards. For more information on custom dashboards, please visit How to Create Custom Dashboards, andCustom Dashboard Widgets. |
For each Network request, the following data is provided:
|
Number of Requests |
Average Requests Per Minute |
Average Load Time |
|
Percentage and Count of HTTP 200's, 300's, 400's, and 500's. |
||
Find Widget
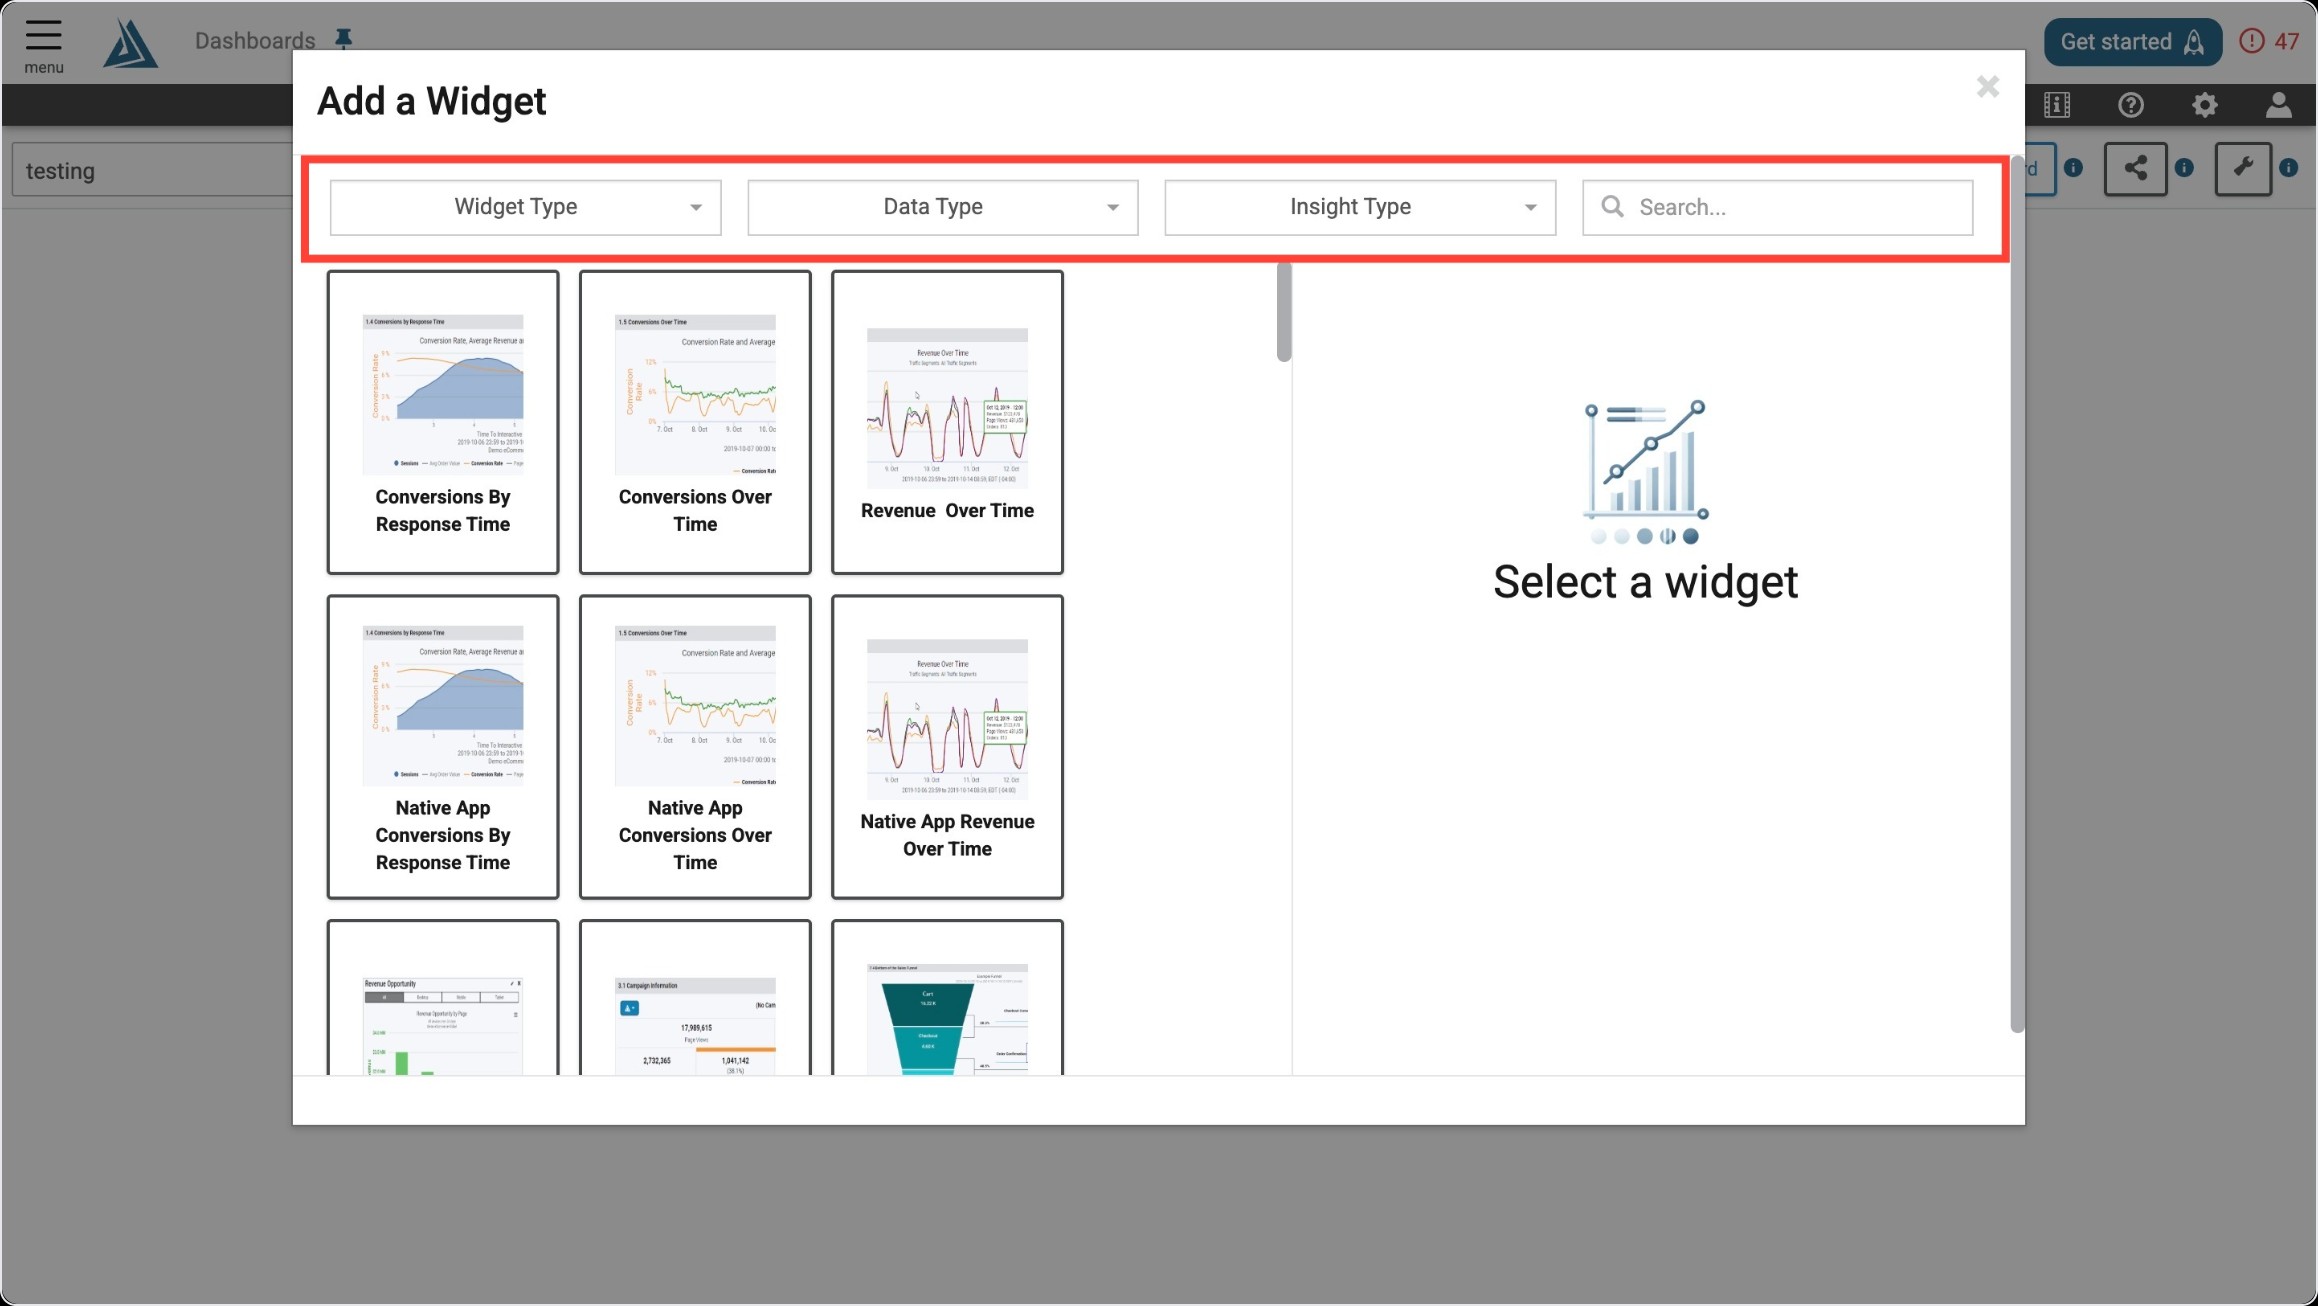
Once you enter the Add a Widget menu, you will see a variety of filter options on top. One way to find the Session Scatter Plot Analysis Widget is to use the filter options listed below.
|
Filter Title |
Filter Option |
|---|---|
|
Widget Type |
Summaries |
|
Data Type |
Real User |
|
Insight Type |
Performance |
Another way to find the Session Scatter Plot Analysis Widget is to use the search bar at the top right of the menu.
Widget Configuration
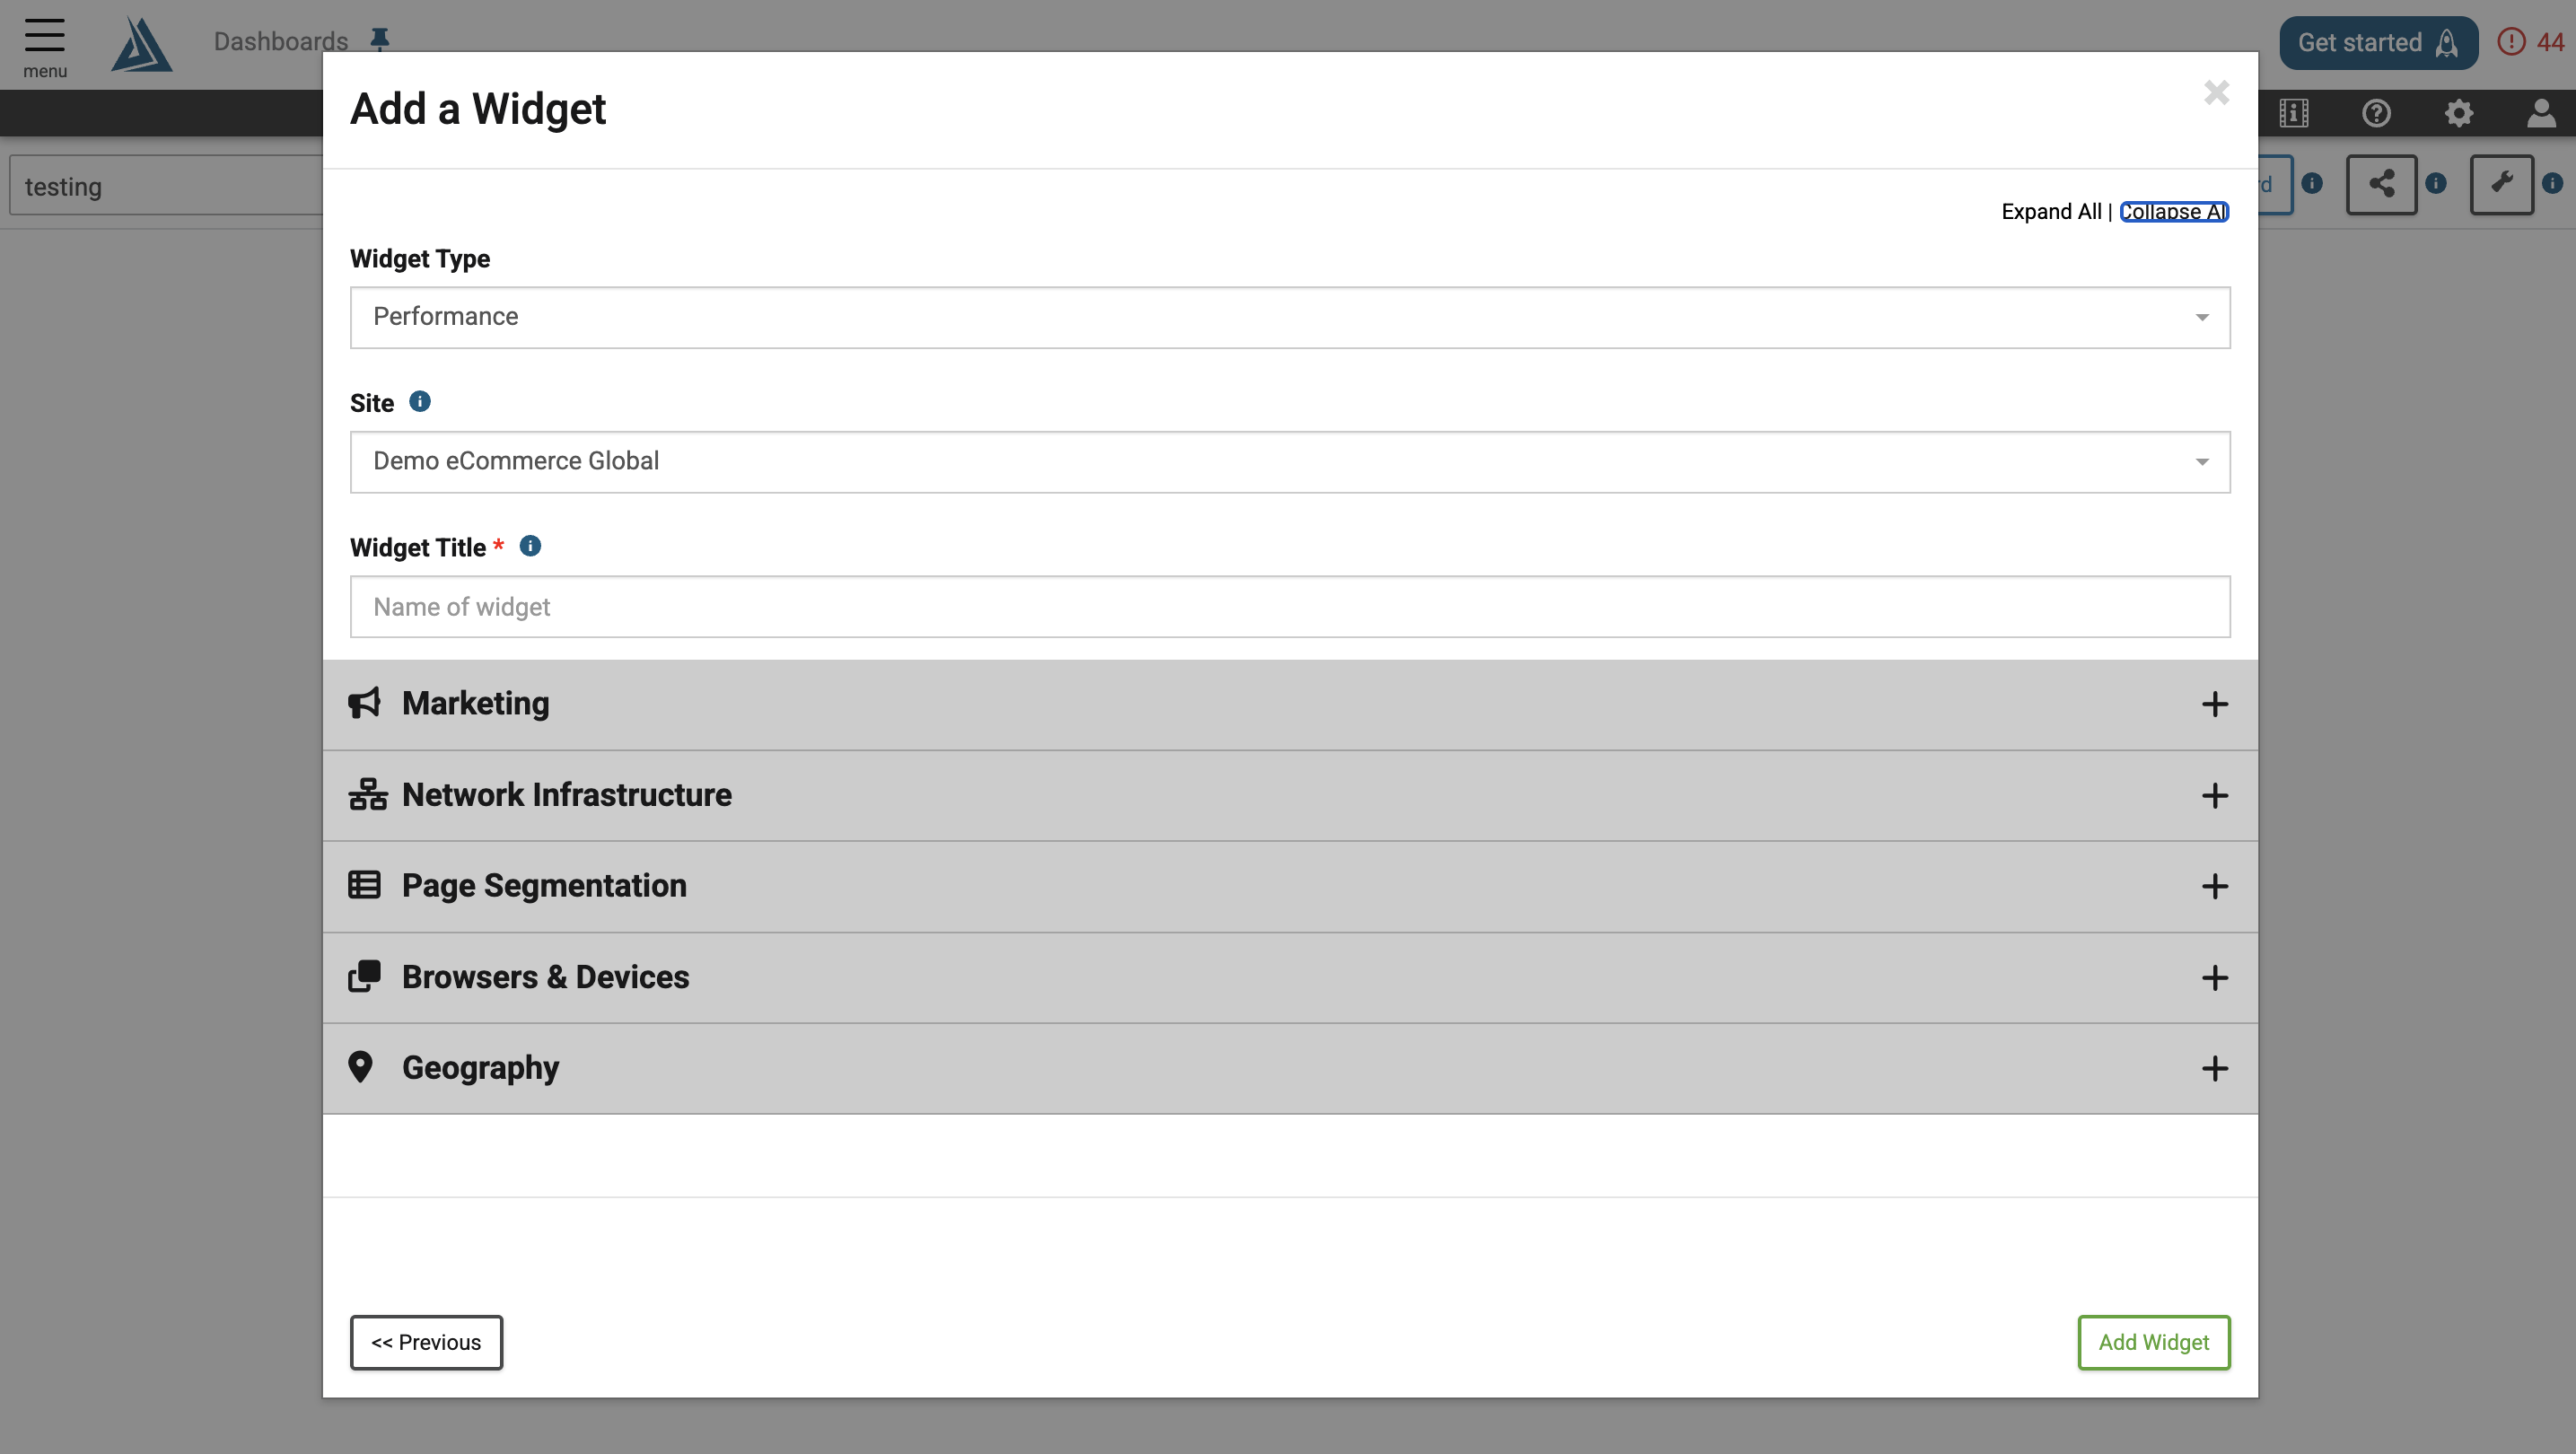
The only required configuration for this widget is a title. The general Marketing, Network Infrastructure, Page Segmentation, Browsers & Devices, and Geography filters are also available in the configuration window, but can be applied after the widget is created as well.