

Overview
Custom dashboards allow for a personalized and integrative monitoring experience in Blue Triangle.
The Real User, Native App, and Synthetic widgets fall into five categories:
-
Trends
-
Summaries
-
Comparisons
-
Data Science/Custom
-
Alerts/Notifications
Each widget also provides unique insight into four different areas: Performance, Business, Marketing, and Governance/Compliance.
Dashboards can be customized with any combination of widgets, no matter the data type, widget type, or insight type.
How to Customize a Dashboard
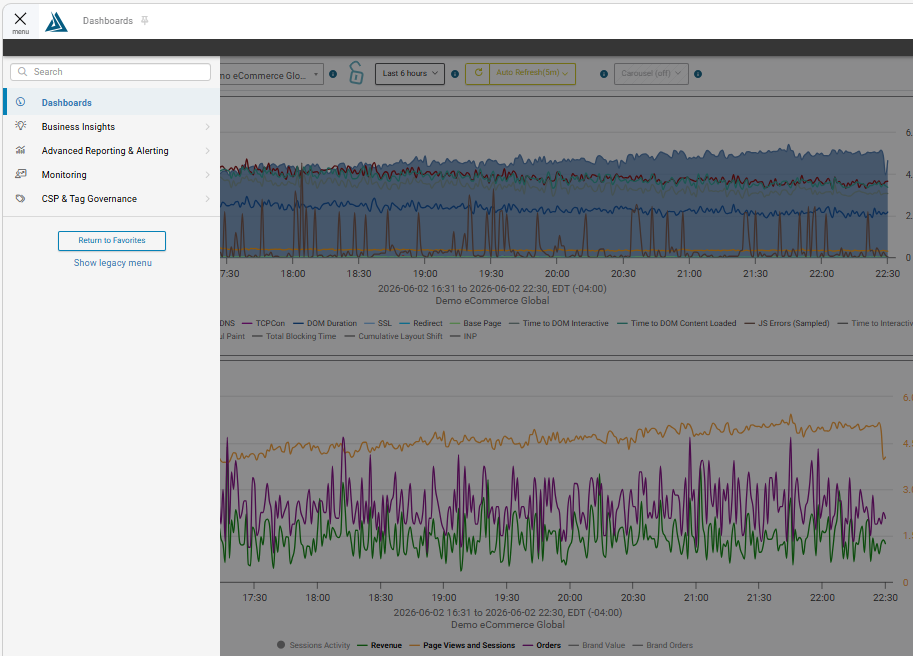
The first step to creating a Custom Dashboard is to select the Dashboards button found in the left hand toolbar in the Blue Triangle portal.
This leads to the main Dashboards page. To change the Dashboard currently in viewed or add a new Dashboard, select the +Dashboard button in the upper right hand corner on the toolbar.
From here, the Dashboard Manager window will open.
Once in the Dashboard, the user's view can be customized by adding widgets. This can be done by clicking either +Widget button.
Users will now begin to customize widgets for their dashboard. There are three filters that will aid in this process:
1. Widget Type
2. Data Type
3. Insight Type
There are 5 Widget Types: Trends, Summaries, Comparisons, Data Science/Custom, and Alerts/notifications.
There are 2 Data Types: Real User, and Synthetic
There are 4 Insight Types: Performance, Business, Marketing, & Governance/Compliance.
Once the desired widget, data, and insight types have been selected, the final level of specifications will be added in the "Add a Widget" pop up.
The new widget is ready to be added once a title has been designated and any further specs have been adjusted to meet user needs.
The new widget will then appear on the dashboard.

Once the selected widgets have been added to the dashboard, users may drag and drop widgets in order of visual priority.
Widgets may also be edited using the upper right hand tools in each widget's window.
The information each widget displays is also affected by the settings designated in the toolbar, located on top of the dashboard itself. For instance, the date range data analyzed by the widgets can be customized using the button to the right of the lock icon.
Next are the refresh and Auto Refresh options
Finally, users have the Carousel button, which allows users to view multiple dashboards on a round, is enabled through the Dashboard Manager tool on the right side of this toolbar.
Looking to the right side of this toolbar, more options are found next to the buttons that allow users to add a new widget or dashboard. These tools include the "Share with my company account" tool and the "Dashboard Manager". The button to the right of the +Dashboard button allows users to share or un-share the currently viewed dashboard with all other users of their shared company account.

The button with a wrench icon is the Dashboard Manager, which allows users to set a default dashboard, add dashboards to their carousel, and the ability to add, share, or create custom dashboards.
Selecting this button will open the Dashboard Manager Window, where the aforementioned Carousel option can be enabled.
Available Widgets
|
Widget |
Description |
Widget Type |
Insight Type |
Data Type |
|---|---|---|---|---|
Conversions by Response Time
|
The Conversions by Response Time widget shows you in real-time our favorite graph - the conversion rate curve. This graph shows conversion rate as it relates to traffic volume and page response time on your site. |
Trends |
Business |
RUM Browser Only |
Conversions Over Time
|
The Conversions Over Time Widget shows you the real time conversion rate, average order value and performance for any and all traffic segments visiting your site. This widget gives you insight into how average order value and conversion rate are affected due to performance. |
Trends |
Business |
RUM Browser Only |
Revenue Over Time
|
The Revenue Over Time Widget shows you the real time revenue, page views, orders and session activity for any and all traffic segments visiting your site. |
Trends |
Business |
RUM Browser Only |
Native App Conversions by Response Time
|
The Conversions by Response Time widget shows you in real-time our favorite graph - the conversion rate curve. This graph shows conversion rate as it relates to traffic volume and page response time on your site. |
Trends |
Business |
Native App |
Native App Conversions Over Time
|
The Conversions Over Time Widget shows you the real time conversion rate, average order value and performance for any and all traffic segments visiting your site. This widget gives you insight into how average order value and conversion rate are affected due to performance. |
Trends |
Business |
Native App |
Native App Revenue Over Time
|
The Revenue Over Time Widget shows you the real time revenue, page views, orders and session activity for any and all traffic segments visiting your site. |
Trends |
Business |
Native App |
Revenue Opportunity
|
The Revenue Opportunity Widget allows to to see your latest Revenue Opportunity Report as a bar graph in a dashboard. |
Summaries |
Business |
RUM Browser Only |
Campaign Information
|
The Campaign Information widget shows you a high-level glance at how the selected campaign is performing over the Dashboard Time Period. |
Summaries |
Marketing |
RUM Browser Only |
Bottom of the Sales Funnel
|
The Bottom of the Sales Funnel Widget allows you to see step-by-step "conversion" rate as your customers proceed through the checkout process. This is the same graph you'll see on the Bottom of the Sales Funnel Analysis page. |
Summaries |
Marketing |
RUM Browser Only |
Performance
|
The Performance Widget is the main graph displayed on the Real User Performance Detail page. This widget is a line graph with various performance metrics displayed over the selected time period. |
Trends |
Performance |
RUM Browser Only |
Native App Performance
|
The Performance Widget is the main graph displayed on Native App Performance Detail page. This widget is a line graph with various performance metrics displayed over the selected time period. |
Trends |
Performance |
Native App |
Bounce Rate
|
The Bounce Rate widget gives you real-time insight into the relationship between user behavior (bounce rate, page views/session) and performance on your site. The x-axis is page load time and the y-axis is bounce rate. |
Trends |
Performance |
RUM Browser Only |
Synthetic Performance
|
The Performance Widget is the main graph displayed on the Synthetic Real Browser Performance Detail page. This widget is a line graph with various performance metrics displayed over the selected time period. |
Trends |
Performance |
Synthetic |
API Checks Performance
|
The API Check Performance Widget is the main graph displayed on both the Synthetic API Check Performance Detail pages. This widget is a line graph with various performance metrics displayed over the selected time period. |
Trends |
Performance |
Synthetic |
Network Health Checks Performance
|
The Network Health Checks Performance Widget is the main graph displayed on the Synthetic Network Health Check Performance Detail page. This widget is a line graph with various performance metrics displayed over the selected time period. |
Trends |
Performance |
Synthetic |
Site Availability
|
The Site Availability Widget shows you a trend of errors and percent availability. This is the same widget/graph you'll see on the Synthetic Performance Detail page and the Synthetic Site Health dashboard. |
Trends |
Performance |
Synthetic |
Performance Summary
|
The Performance Summary widget gives you a high-level summary of the performance and content metrics for your site. This widget contains the same information as the cards on the Real User Performance Detail page. |
Summaries |
Performance |
RUM Browser Only/Synthetic |
Real User Performance by Geography
|
This widget is a global performance heat map. |
Summaries |
Performance |
RUM Browser Only |
Synthetic Performance by Geography
|
This widget is a global performance heat map. |
Summaries |
Performance |
Synthetic |
Performance by Browser
|
The Performance by Browser Widget allows you to see in real-time the top 50 browser/browser version/OS combinations hitting your site and how they are performing. |
Summaries |
Performance |
RUM Browser Only |
Performance by Country
|
The Performance by Country Widget allows you to see in real-time the top 50 countries visitors are hitting your site from, and how the site is performing by country. |
Summaries |
Performance |
RUM Browser Only |
Performance by Region
|
The Performance by Region Widget allows you to see in real-time the top 50 regions across the world visitors are hitting your site from, and how the site is performing by region. |
Summaries |
Performance |
RUM Browser Only |
Performance Path
|
The Performance Path widget gives you a great view of how your critical purchase path or customer journey is performing for real users, compared to a baseline. |
Summaries |
Performance |
RUM Browser Only |
Device Metrics
|
The Device Metrics widget allows you to see your site performance at a high-level glance broken out by device. |
Summaries |
Performance |
RUM Browser Only |
Traffic Information
|
The Traffic Information Widget is a great widget to augment your dashboard if you just want to see some basic information about the traffic hitting your site. |
Summaries |
Performance |
RUM Browser Only |
Timing Information
|
The Timing Information Widget shows you 3 basic metrics: Network Time: SSL + DNS + TCP, Back-End Time: redirect + firstByte + basepage, Front-End Time: onload - basepage. |
Summaries |
Performance |
RUM Browser Only |
Performance Summary
|
The Performance Summary widget gives you a high-level summary of the performance and content metrics for your site. This widget contains the same information as the cards on the Synthetic Performance Detail page. |
Summaries |
Performance |
Synthetic |
Session Scatter Plot Analysis
|
This widget gives you a live scatter plot of your synthetic measurements with the ability to click points and drill into more detail. |
Summaries |
Performance |
Synthetic |
Error Tracking and Performance
|
The Error Tracking and Performance Widget lists all of your active monitors along with a performance and availability status bar. |
Summaries |
Performance |
Synthetic |
API Checks Error Tracking and Performance
|
The API Check Error Tracking and Performance Widget lists all of your active monitors along with a performance and availability status bar. |
Summaries |
Performance |
Synthetic |
Network Health Checks Error Tracking and Performance
|
The Network Health Check Error Tracking and Performance Widget is a line graph with various network related performance metrics (such as latency, jitter, traceroutes) displayed over the selected time period. |
Summaries |
Performance |
Synthetic |
Synthetic Performance Comparison
|
The Performance Comparison widget is the same graph used on the Synthetic Page Performance Comparison page. The widget is a line graph over time, with each line representing a page for performance comparison. |
Comparisons |
Performance |
Synthetic |
Performance Comparison
|
The Performance Comparison widget is the same graph used on the RUM Synthetic Page Performance Comparison page. The widget is a line graph over time, with each line representing a page for performance comparison |
Comparisons |
Performance |
RUM Browser Only |
KPI Date Comparison
|
The KPI Date Comparison widget allows you to get a real time comparison of your key performance indicators from a baseline in the past. It's one our most functional dashboard widgets and allows you to customize the exact date or time period for the comparison you want. |
Comparisons |
Performance |
RUM Browser Only |
Year by Year Comparison
|
The Year by Year Comparison Widget shows you daily revenue in a line graph for each selected year for comparison. Each year is a separate line in the graph. |
Comparisons |
Performance |
RUM Browser Only |
Environment
|
The Environment widget gives you a holistic view of your Tag Governance data in real time. Each item in the widget shows a spark line graph with the starting number to the left, and the delta and percent change to the right. The look-back period for the graphs is set according to the Dashboard Time Period. |
Trends |
Governance/Compliance |
RUM Browser Only/Synthetic |
SLA Violations
|
The SLA violations widget lists all detected SLA violations over the Dashboard Time Period. |
Summaries |
Governance/Compliance |
RUM Browser Only |
1st vs 3rd Party Composition - RUM
|
The 1st and 3rd Party Composition widget gives you a breakdown of the performance, size and amount of the content on your site. |
Comparisons |
Governance/Compliance |
RUM Browser Only |
1st vs 3rd Party Activity- RUM
|
The 1st and 3rd Party Activity widget allows you to see the amount of time each Service, Domain and File spent loading on your site, and you can get this information broken out by 1st or 3rd Party content. |
Comparisons |
Governance/Compliance |
RUM Browser Only |
1st vs 3rd Party Composition - Synthetic
|
The 1st and 3rd Party Composition widget gives you a breakdown of the performance, size and amount of the content on your site. This widget is available for both Real User and Synthetic Data. |
Comparisons |
Governance/Compliance |
Synthetic |
1st vs 3rd Party Activity - Synthetic
|
The 1st and 3rd Party Activity widget allows you to see the amount of time each Service, Domain and File spent loading on your site, and you can get this information broken out by 1st or 3rd Party content. |
Comparisons |
Governance/Compliance |
Synthetic |
1st vs 3rd Party Function Timing
|
The 1st and 3rd Party Function Timing widget allows you to see the amount of time each function spent running on your site, and you can get this information broken out by 1st or 3rd Party content. |
Comparisons |
Governance/Compliance |
Synthetic |
Active Alerts
|
This dashboard widget shows the alerts that are currently in Warning or Critical state. As soon as your alerts move from Warning or Critical to the Clear state, they will disappear from this widget. |
Alerts/Notifications |
All Insight Types |
RUM Browser Only/Synthetic |
Blue Triangle Announcements
|
This dashboard widget shows the Announcements that Blue Triangle has published. |
Alerts/Notifications |
All Insight Types |
RUM Browser Only/Synthetic |
DEO Anomalies & Site Opportunities
|
The DEO Anomalies and Site Opportunity Widget is the the widget that is viewable on the DEO homepage. Also known as our anomaly detection, this widget is made up of machine learning that is constantly monitoring your site for issues. When it detects an issue, it will automatically move that issue to the top of the widget and prioritize it by Severity: Critical, Significant, Normal, or Minor. |
Alerts/Notifications |
All Insight Types |
RUM Browser Only/Synthetic |
Custom Widget
|
Load a saved Data Science graph as a widget and adjust the filters as needed. |
Data Science/Custom |
All Insight Types |
RUM/Synthetic |
Native App Network Request Failures Over Time
|
The Native App Network Request Failures Over Time Widget will give you a count of HTTP 400s and 500s over a give period of time. |
Trends |
Performance |
Native App |
Native App 1st vs 3rd Party Activity
|
The 1st vs 3rd Party Activity - Native App widget allows you to see the amount of time each Domain and Network Request spent loading on your app, and you can get this information broken out by 1st or 3rd Party content. |
Comparisons |
Governance/Compliance |
Native App |
Native App Crash Summary
|
The Native App Crash Summary widget will give you a summary of crashes per page/screen name. This will be based on the 5 pages/screens that you select. If no pages/screens are specified, the top 5 pages (by number of crashes) will display. |
Summaries |
Performance |
Native App |
Native App ANR & Out of Memory Warnings
|
The Native App ANR & Out of Memory Warnings widget gives you a count of the number of each type of warning received by network requests that your app makes. |
Summaries |
Performance |
Native App |
Android App Friction Map
|
The Native Android App Friction Map widget will give you a summary of Crashes, Errors, & Warnings for Android devices. This data is based on the Android version & the App Version and will provide the count of Crashes, Errors, & Warnings during the specified time period. |
Summaries |
Performance |
Native App |
iOS App Friction Map
|
The Native iOS App Friction Map widget will give you a summary of Crashes, Errors, & Warnings for iOS devices. This data is based on the iOS version & the App Version and will provide the count of Crashes, Errors, & Warnings during the specified time period. |
Summaries |
Performance |
Native App |
Native App HTTP Responses
|
The Native App HTTP Response Codes widget gives you a summary of the responses, traffic, and availability of the top Network Requests by number of requests. |
Summaries |
Performance |
Native App |
Average CPU & Memory Usage
|
The Native App Average CPU & Memory Usage widget will show CPU & Memory Usage as a percentage. Note that if the user’s device is a multi core processor, this will be factored into the CPU average. |
Summaries |
Performance |
Native App |
Native App HTTP Failures
|
The Native App HTTP Failures widget helps user visualize the Native App HTTP failures that have been experienced over a specified period of time. |
Summaries |
Performance |
Native App |