Overview
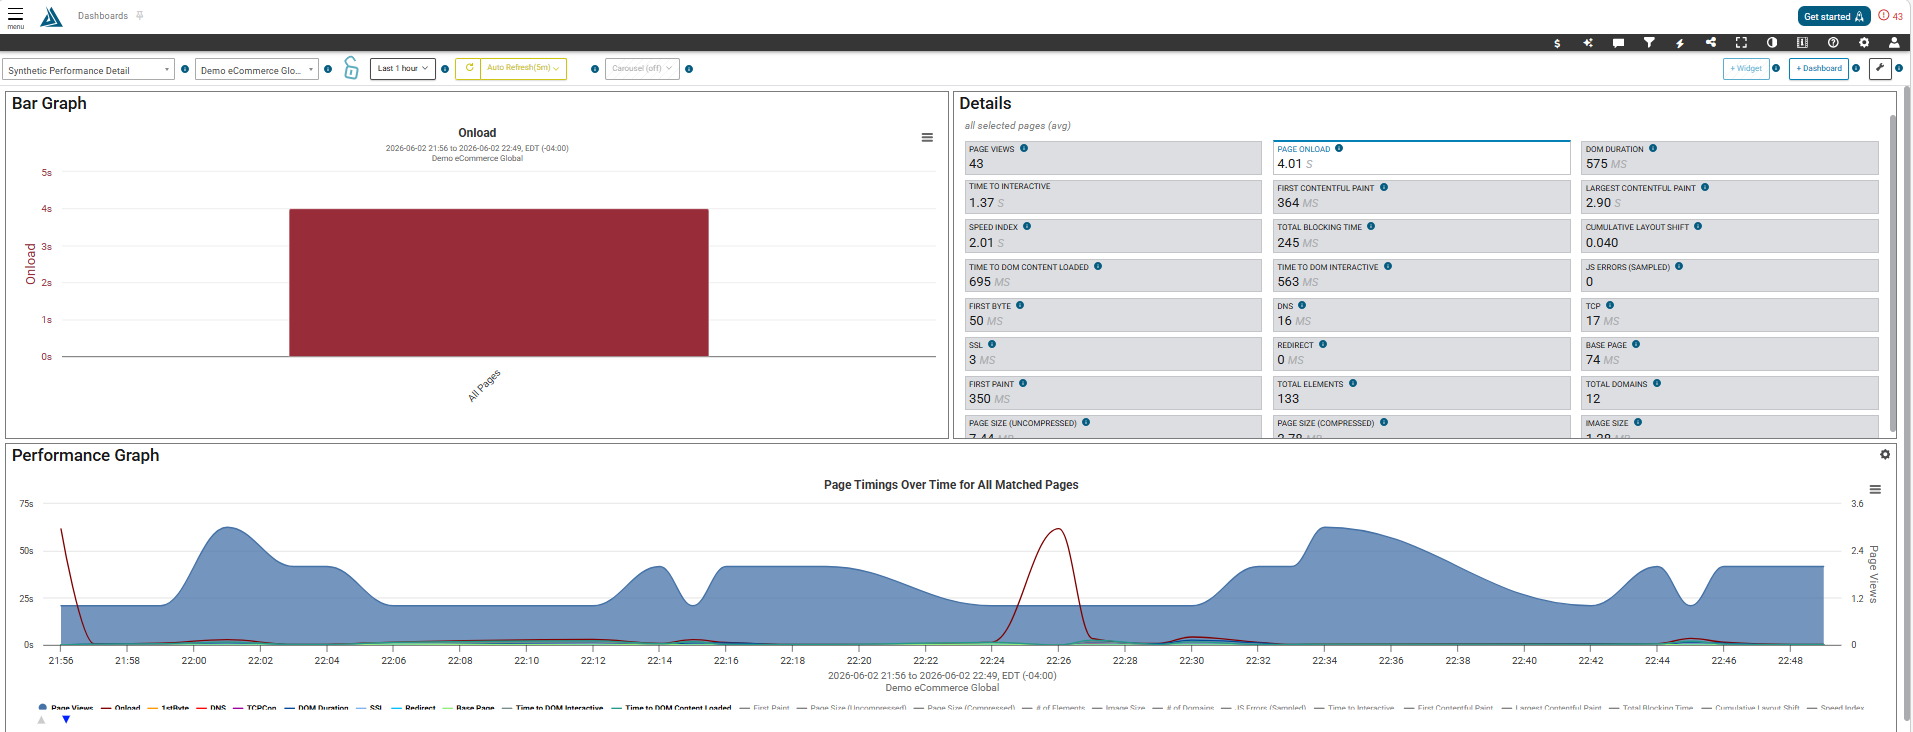
The Synthetic Performance Detail page enables you to analyze your synthetic data both at a high-level glance and all the way down to individual page measurements. At the top of the page you are able to customize the time period you would like to analyze.
How to Find the Synthetic Performance Detail Dashboard
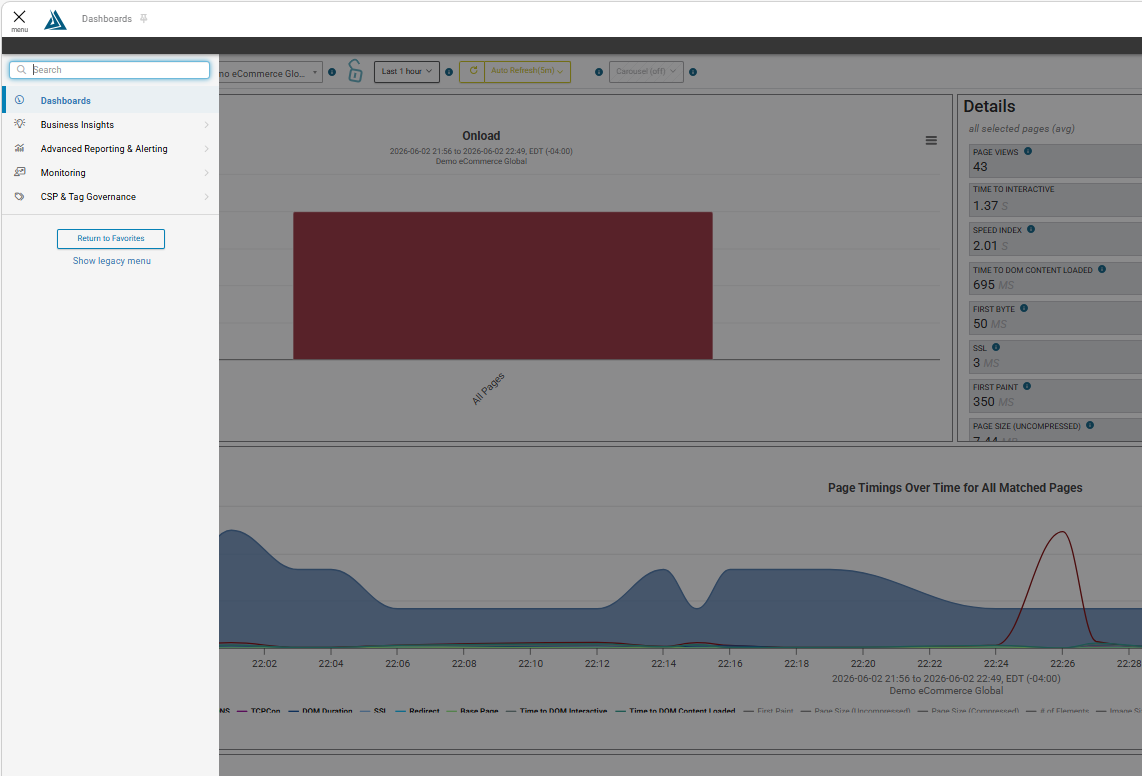
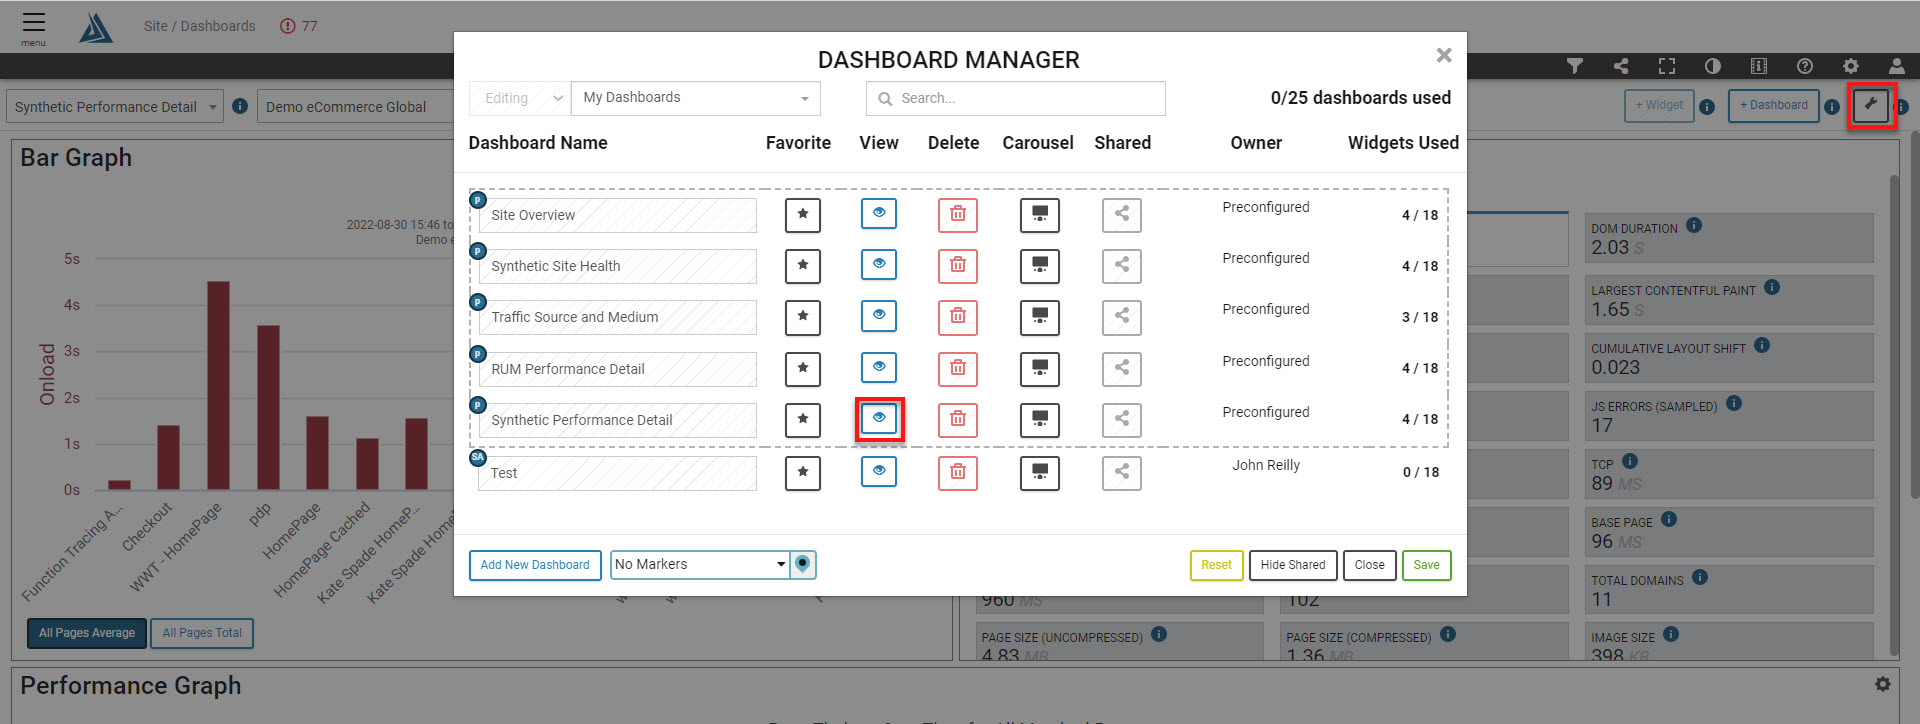
To access this dashboard first go to the menu in the top left of the BT Portal and select 'Dashboards'.
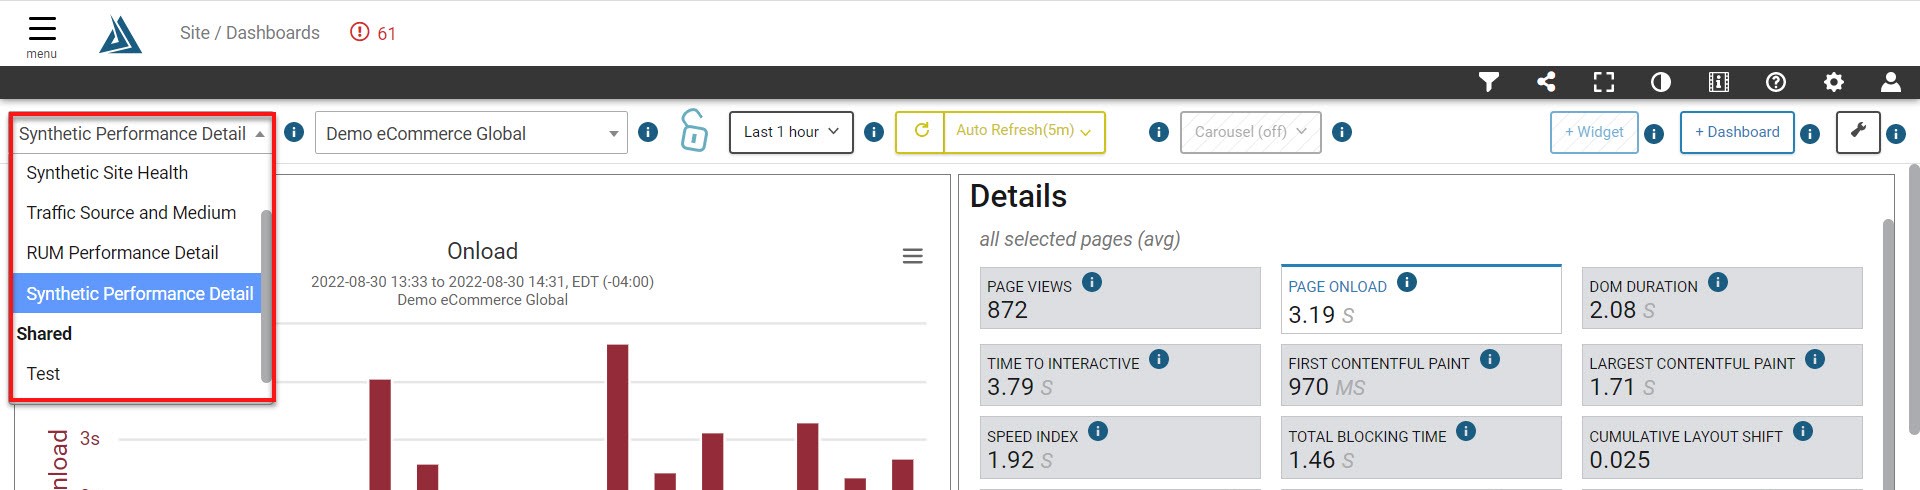
This view is available preconfigured through the drop-down menu on the left side of the page.
Alternatively, clicking on the gear icon at the top right side of the page will open the Dashboard Manager.
Widgets
You are able to set the frequency this dashboard will auto-refresh through the dropdown at the top of the page. It can be set it as low as every 2 minutes up to once every hour. 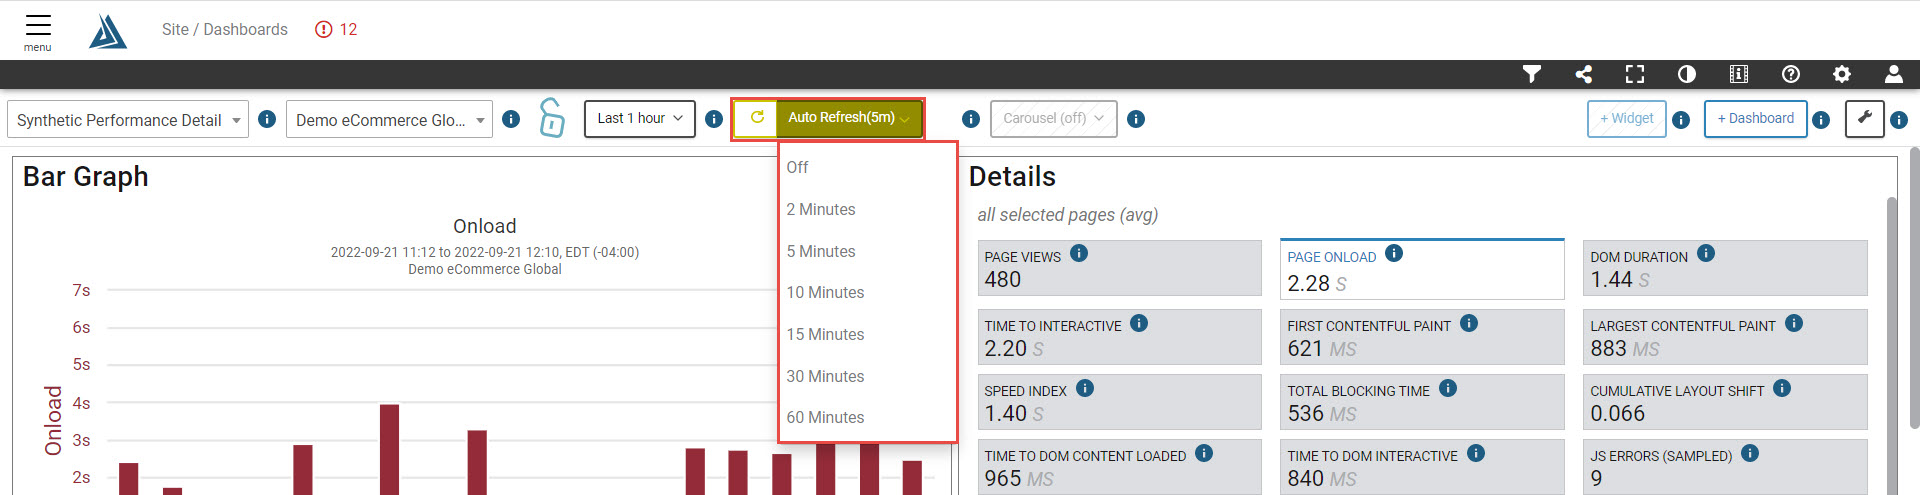
Bar Graph and Details
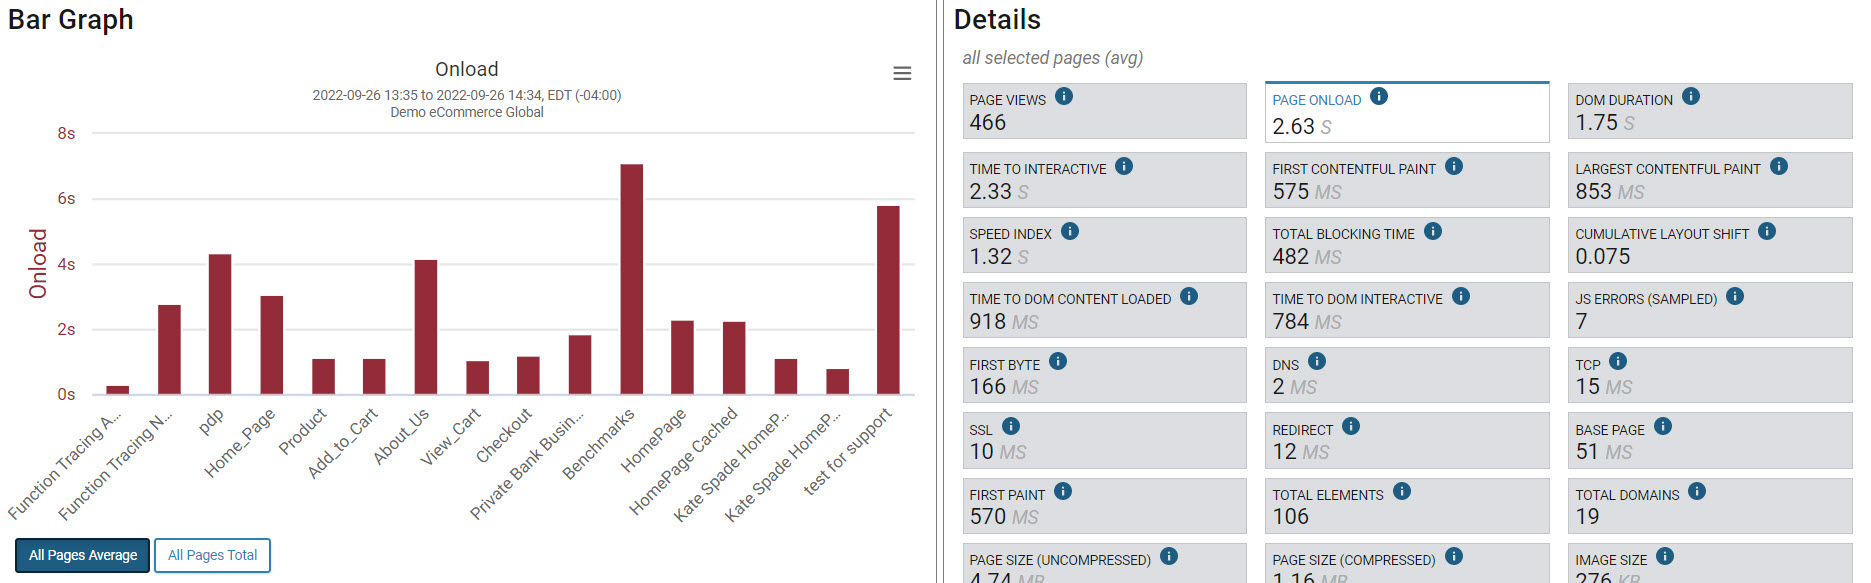
The bar graph and the clickable cards display the high-level overview of your site's performance metrics during the selected time period. By selecting a metric, the corresponding bar graph will display that data broken down by page. This will also update the Daily Averages widget at the bottom of the dashboard.
Performance Graph
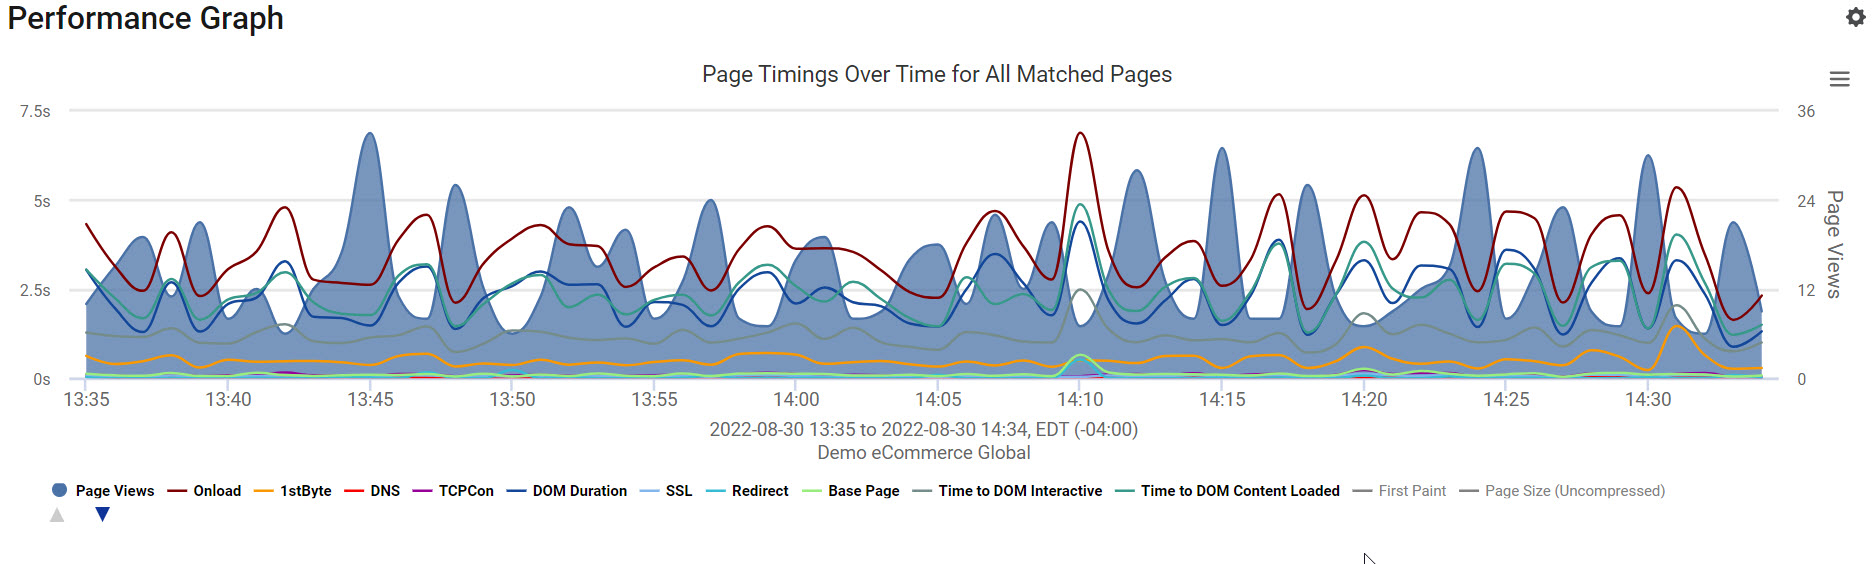
This graph displays Page Timings Over Time for All Matched Pages over the selected time period. The gear icon in the right corner of the widget controls which metrics are included in the graph. You can also toggle the viewable metrics by clicking the name in the legend.
Daily Averages
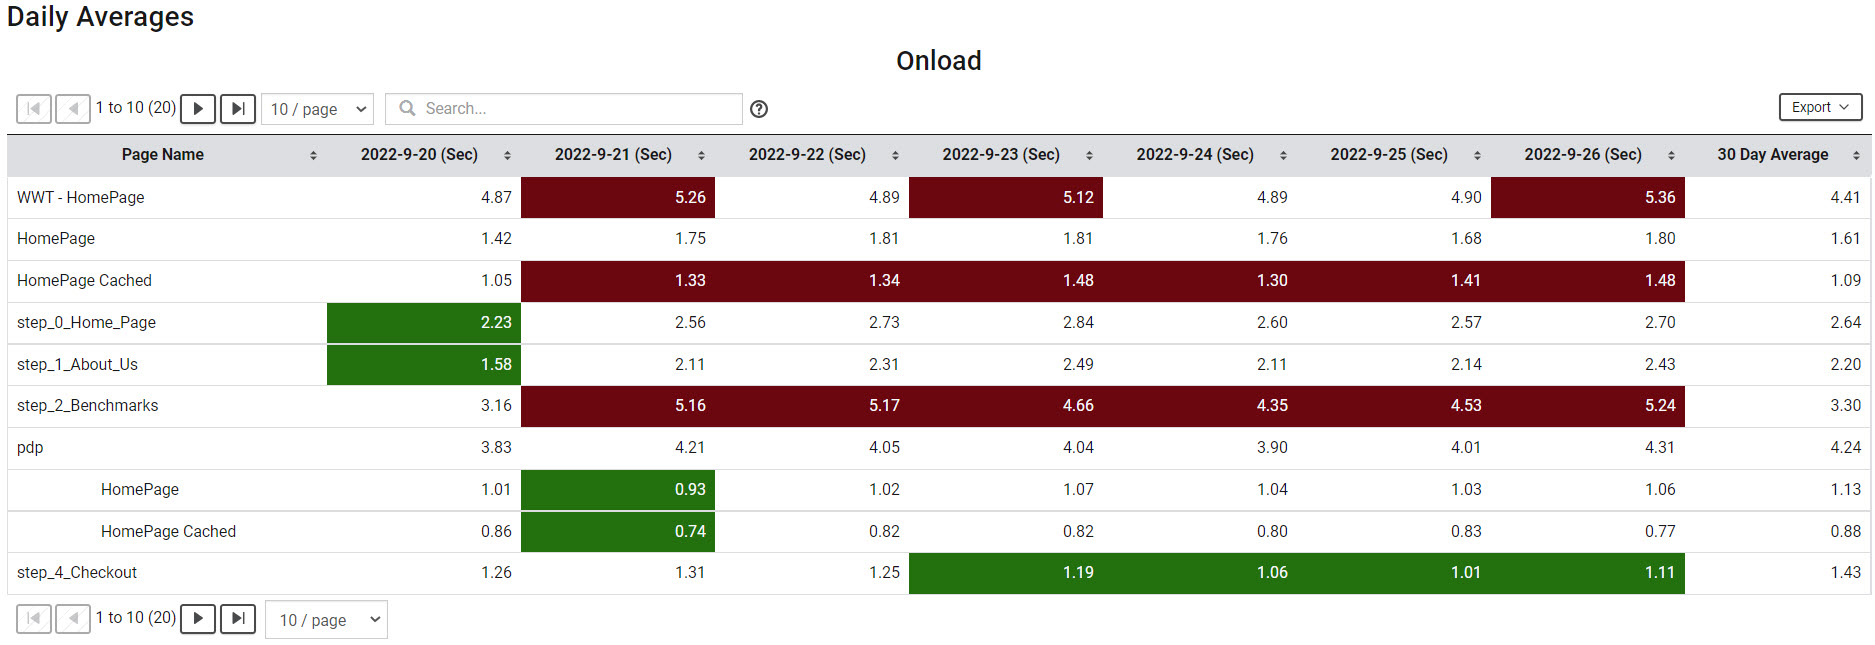
This is table of the daily averages for the metric selected in the Details widget broken down by page name and date.
How to Filter the Synthetic Performance Detail Dashboard
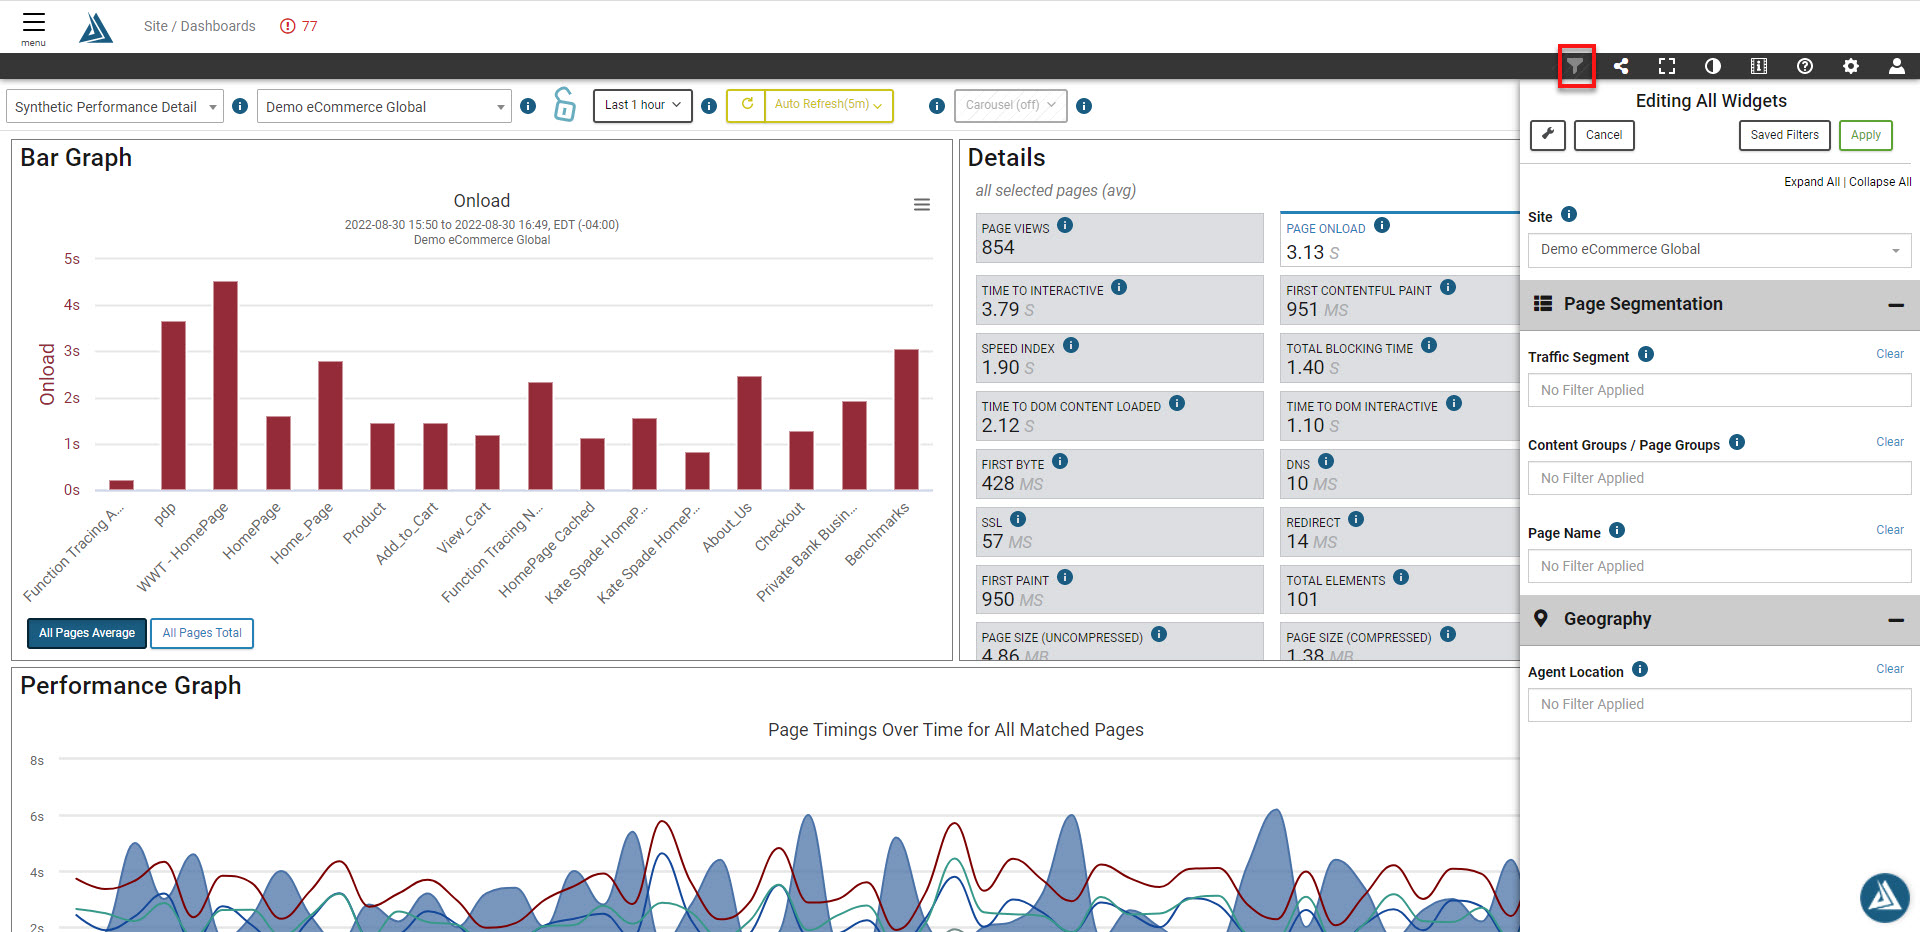
To filter the data, click the Filter icon on the top right of the screen. This will open a menu where you can apply any number of criteria to filter on. Click Apply to reload the dashboard with the new filters. You can select a time period through the selector button in the top left of the dashboard.