Overview
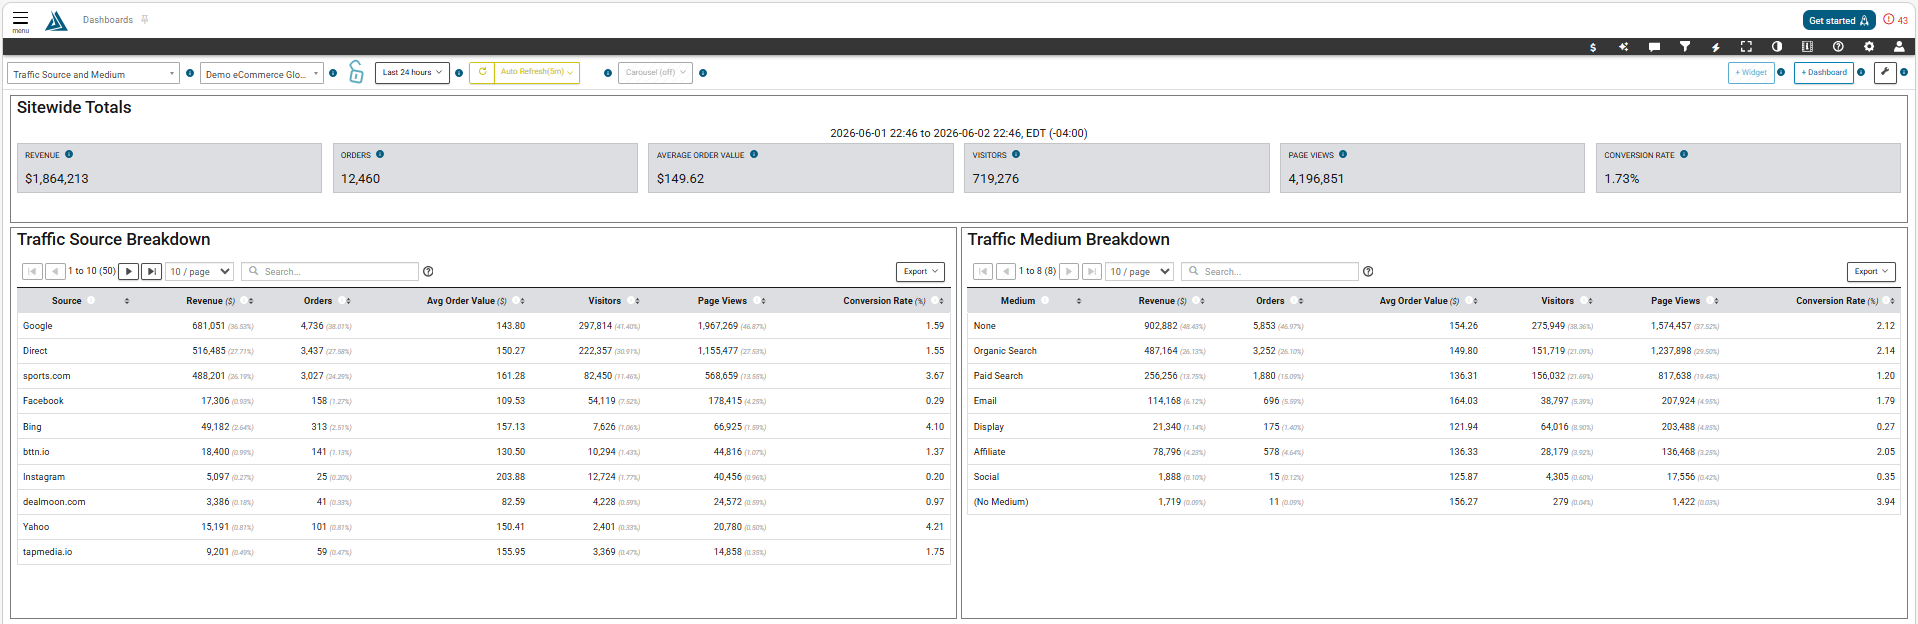
The "Traffic Source & Medium" preconfigured dashboard provides insight into the sales and performance of different traffic sources and mediums. At the top of the page you are able to customize the time period you would like to analyze.
How to Find the Traffic Source and Medium Dashboard
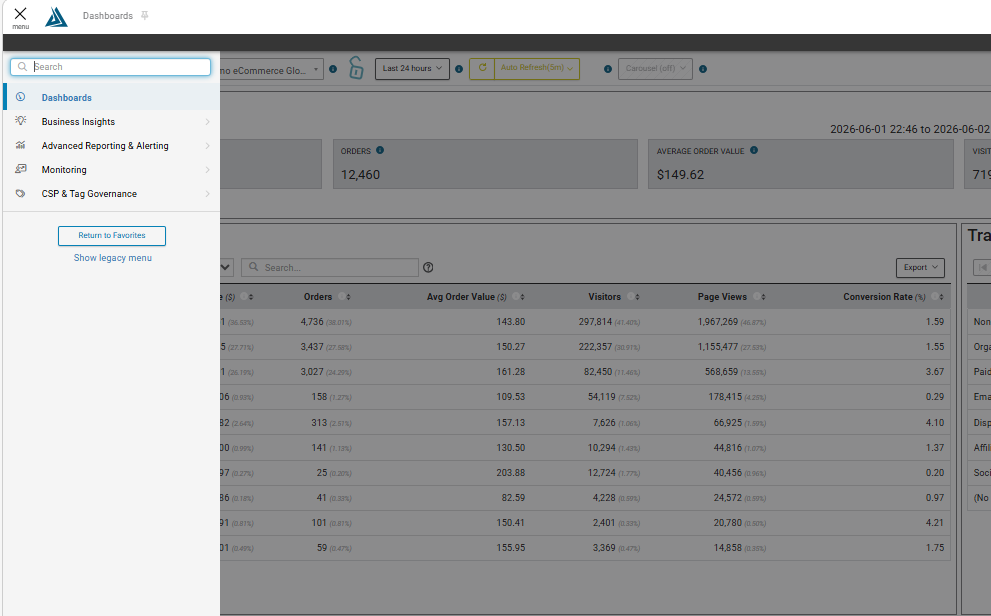
To find the Traffic Source and Medium Dashboard click on the menu at the top left of the BT Portal, and click Dashboards.
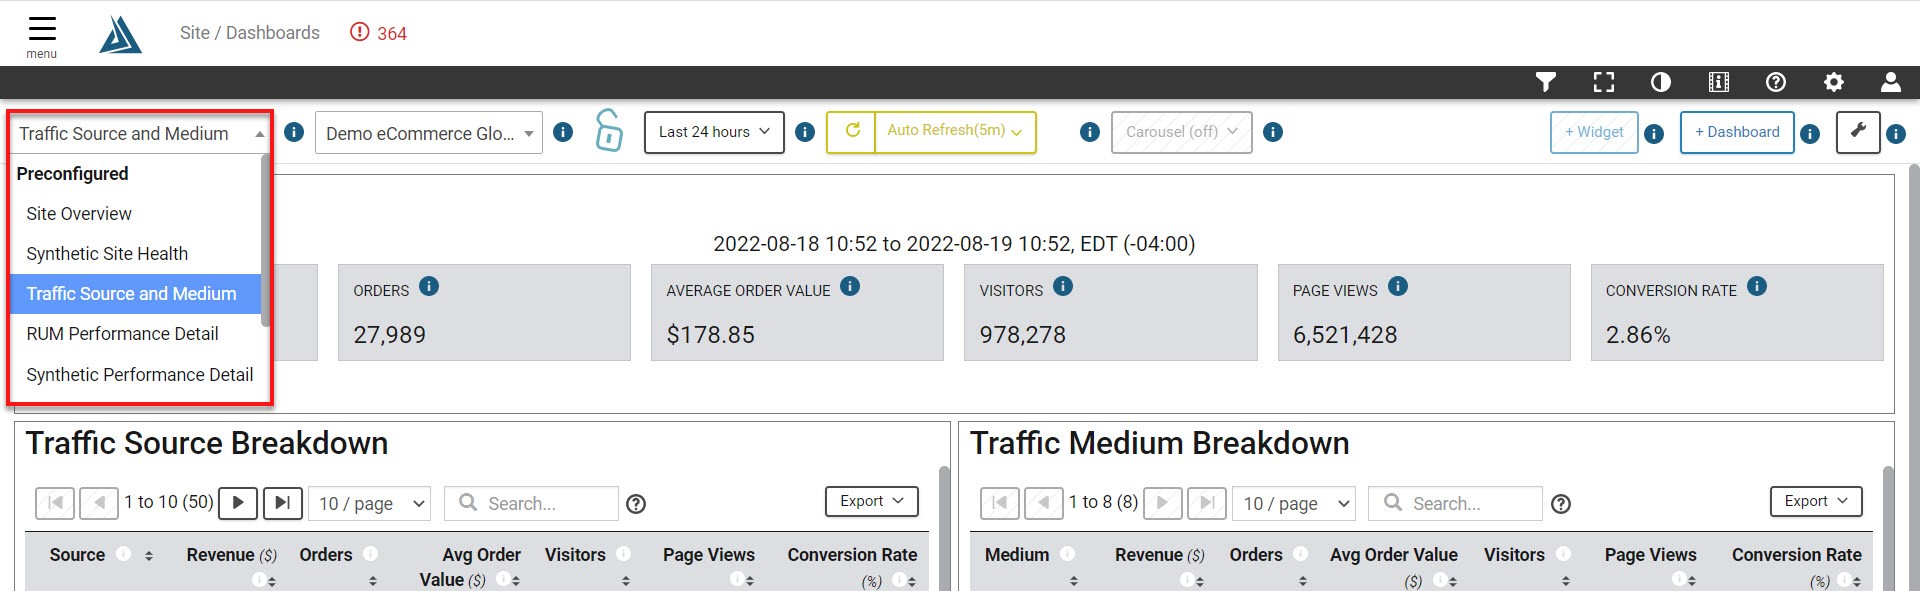
Then click on the drop down menu at the top left of the screen, and select Traffic Source and Medium.
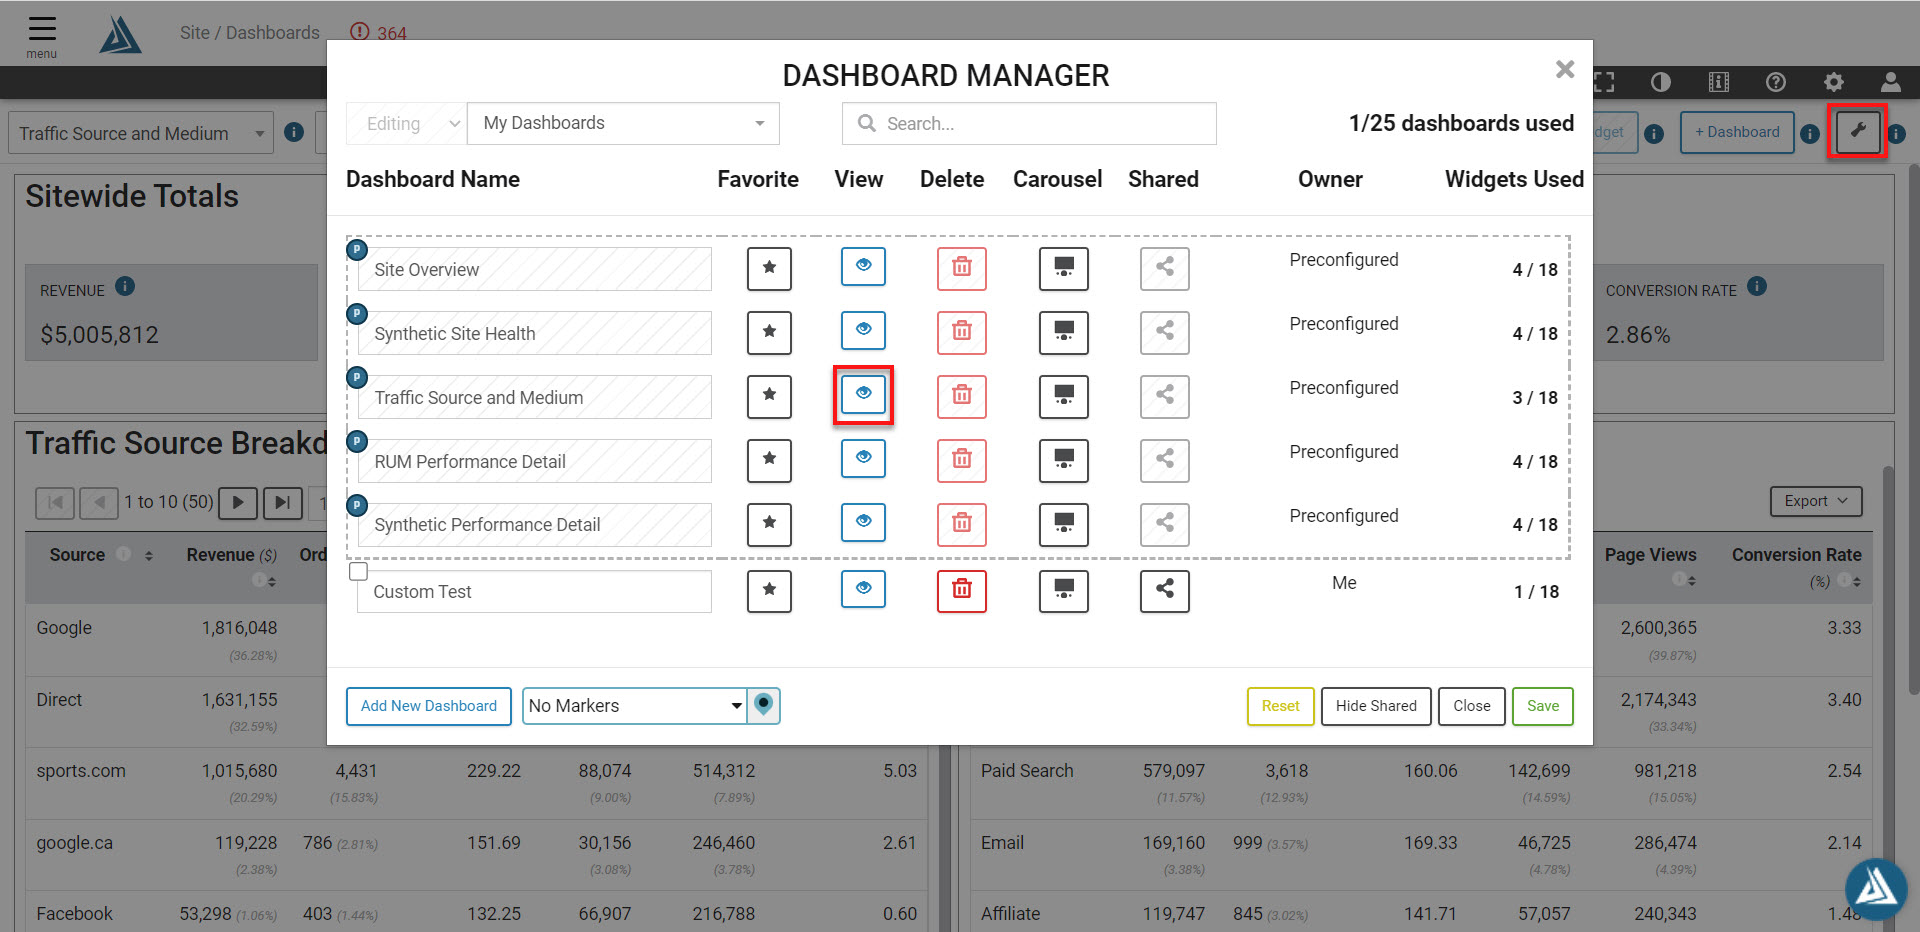
Alternatively, you can find the dashboard by clicking on the gear icon at the top right of the page, and clicking the view icon next to the dashboard that you would like to view.
Widgets
Sitewide Totals
The top widget shows high-level key metrics for your site / app.

Traffic Source Breakdown
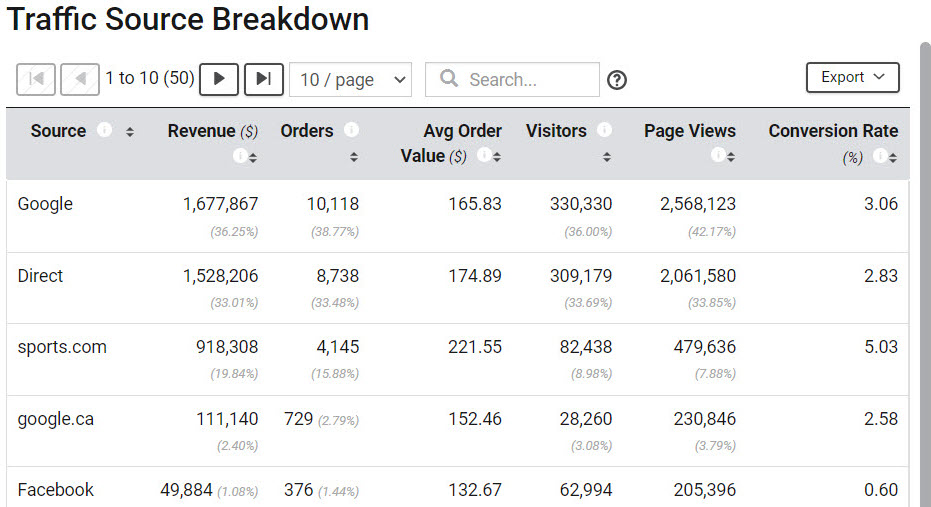
The bottom left widget shows a breakdown of your site / app performance and revenue by traffic source (Direct, google, yahoo, etc). Sorting and exporting capabilities are built into this table along with pagination.
Traffic Medium Breakdown
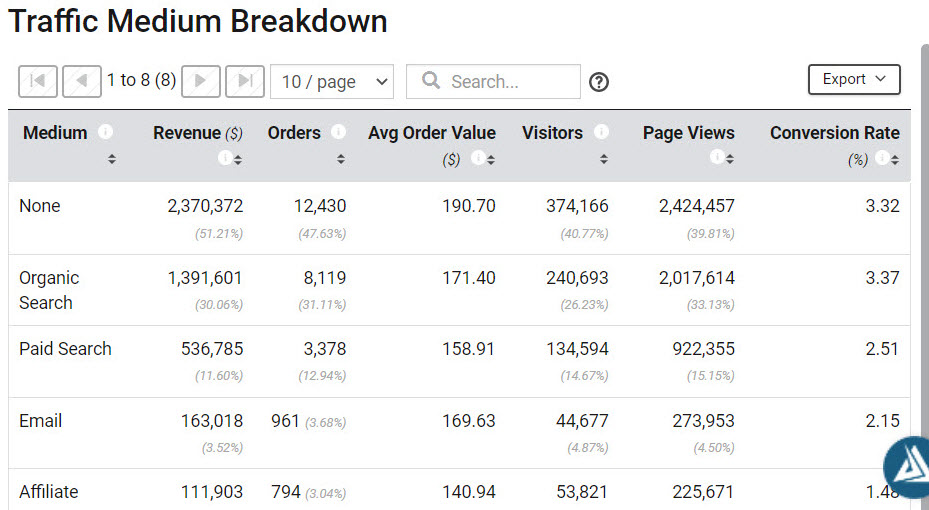
The bottom right widget shows a breakdown of your site / app performance and revenue by traffic medium (Paid, email, other, etc). Sorting and exporting capabilities are built into this table along with pagination.
How to Filter the Traffic Source and Medium Dashboard
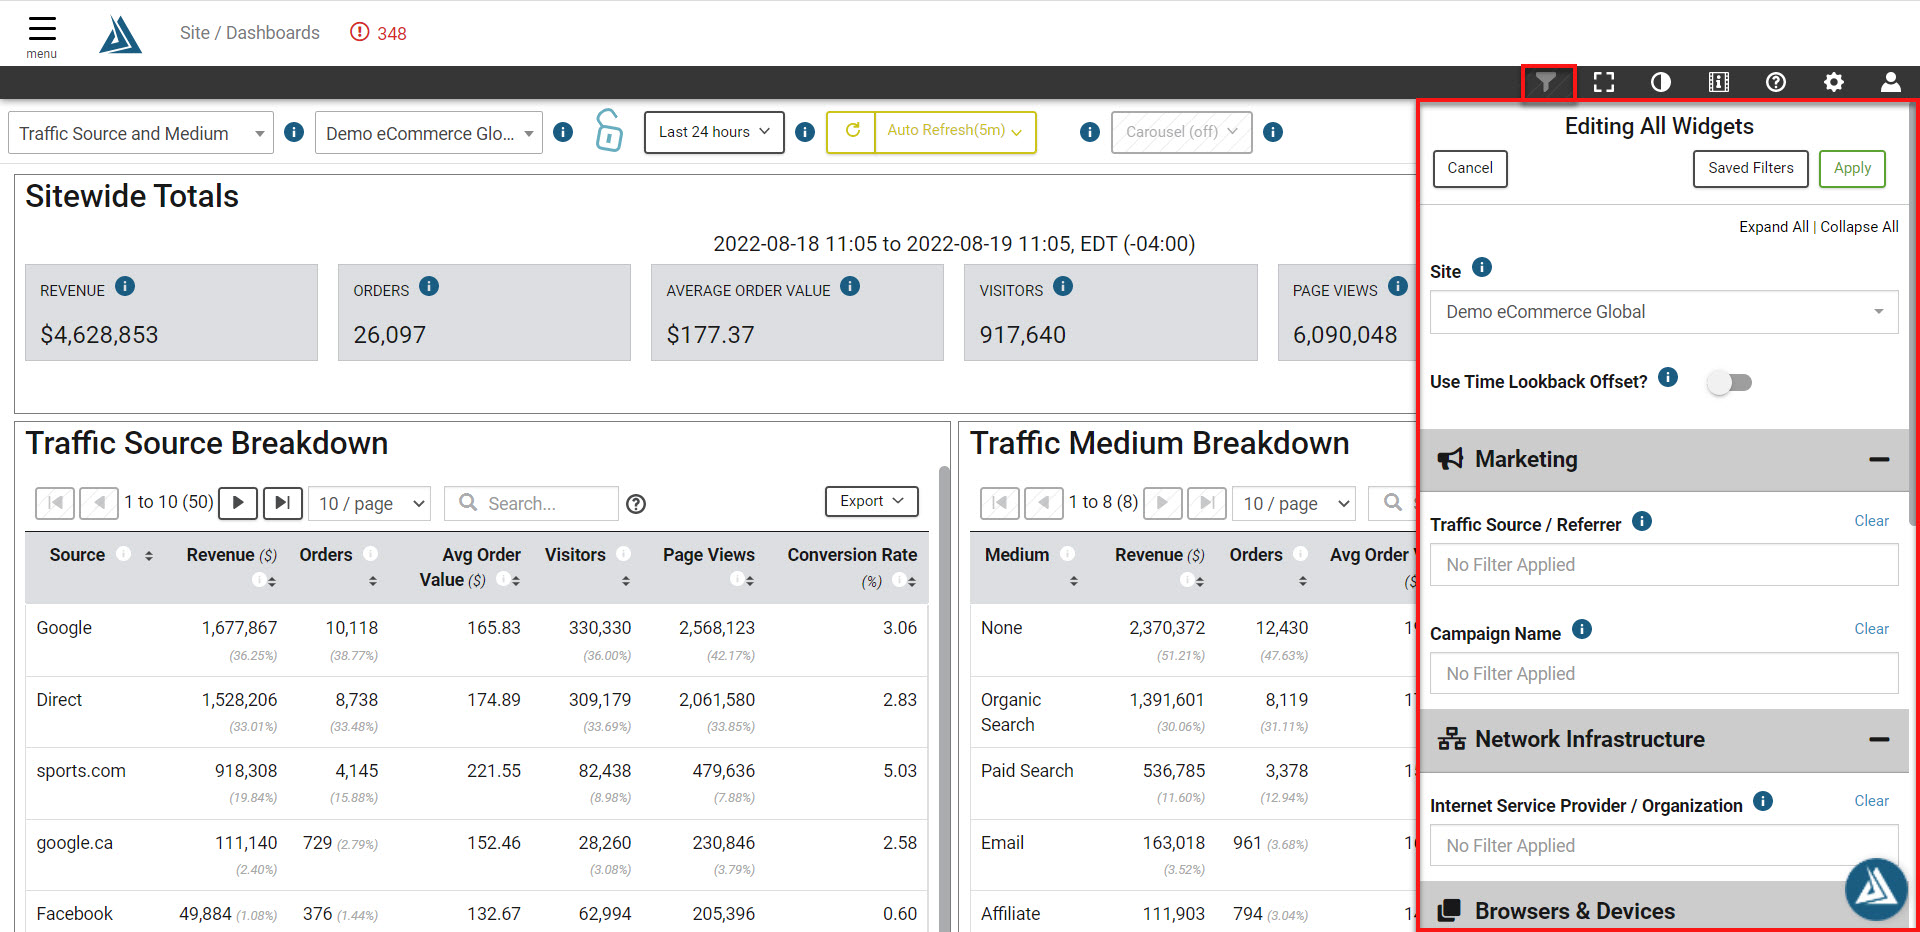
To filter the data, click the Filter icon on the top right of the screen. This will open a menu where you can select and apply filter criteria to the dashboard. Click Apply to reload the dashboard with the new filters.