Overview
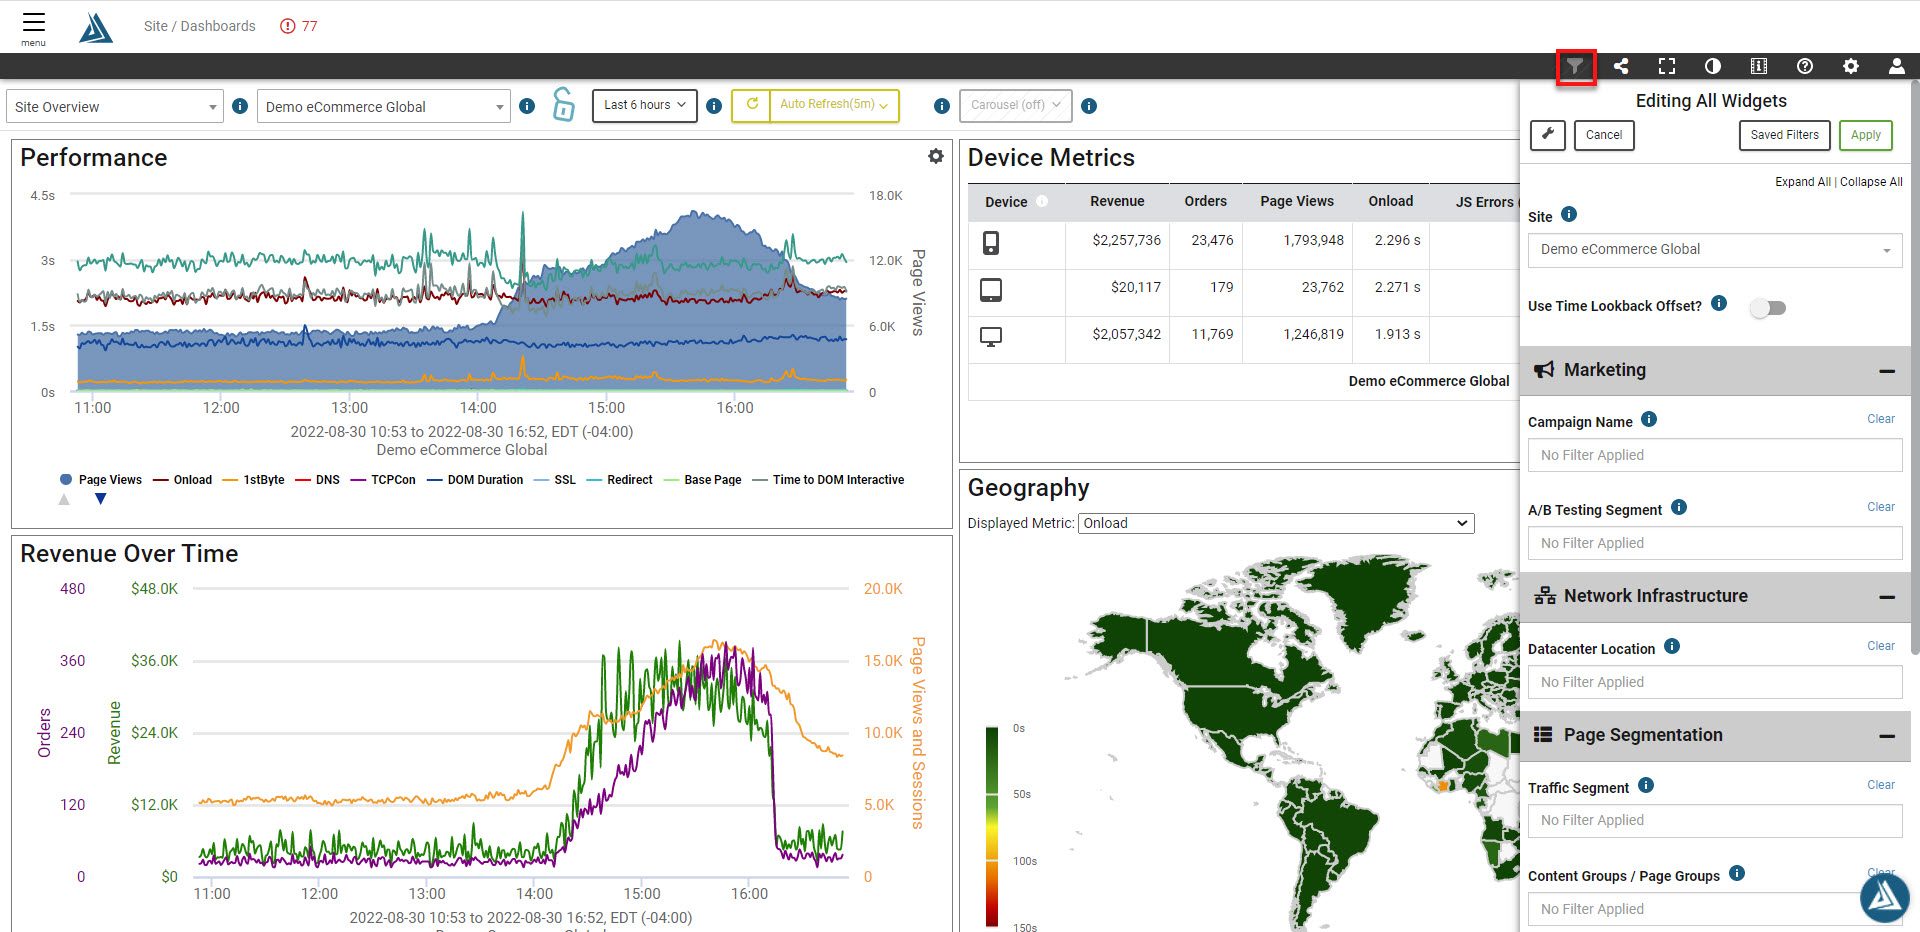
The pre-configured dashboard, “Site Overview”, provides you with a holistic view of how your site / app is performing. It breaks down the revenue and performance by geography and device type over time. At the top of the page you are able to customize the time period you would like to analyze.
How to Find the Site Overview Dashboard
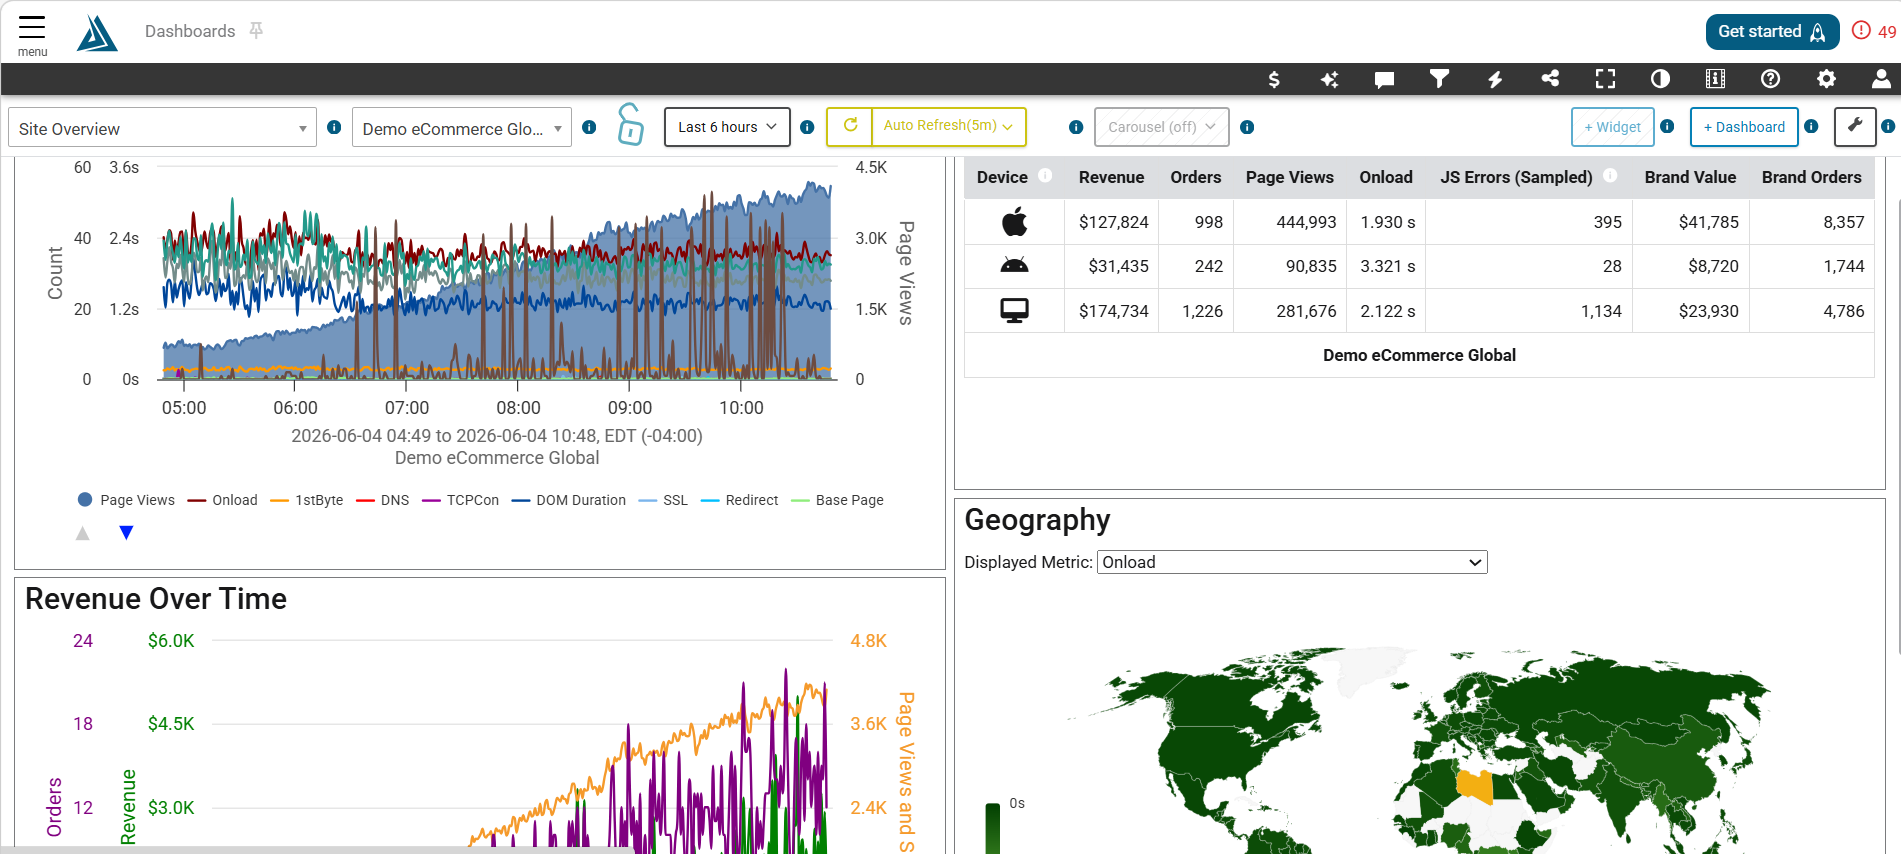
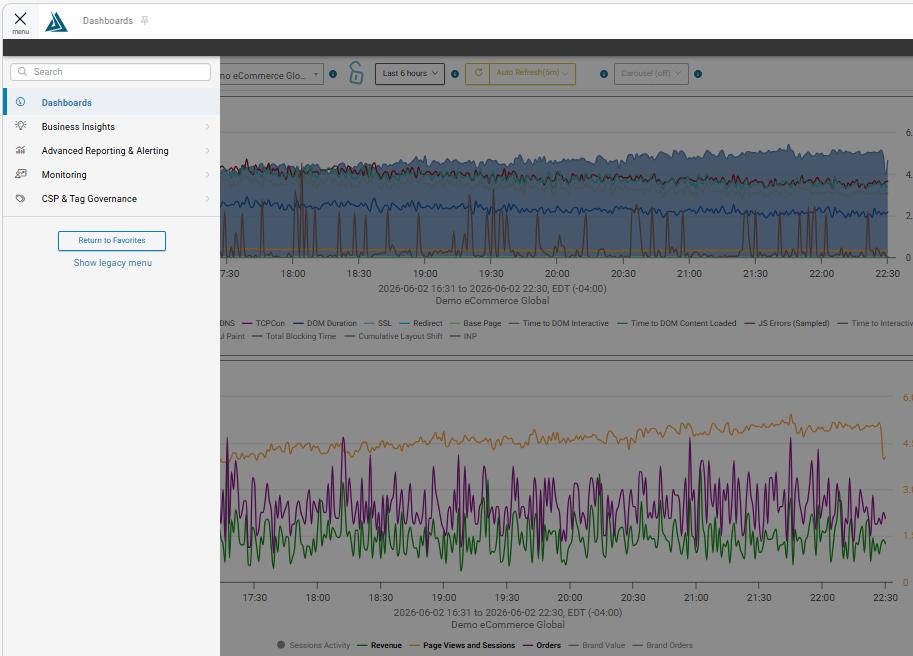
Click on the “Dashboard” link in the top of the main left-hand navigation menu.
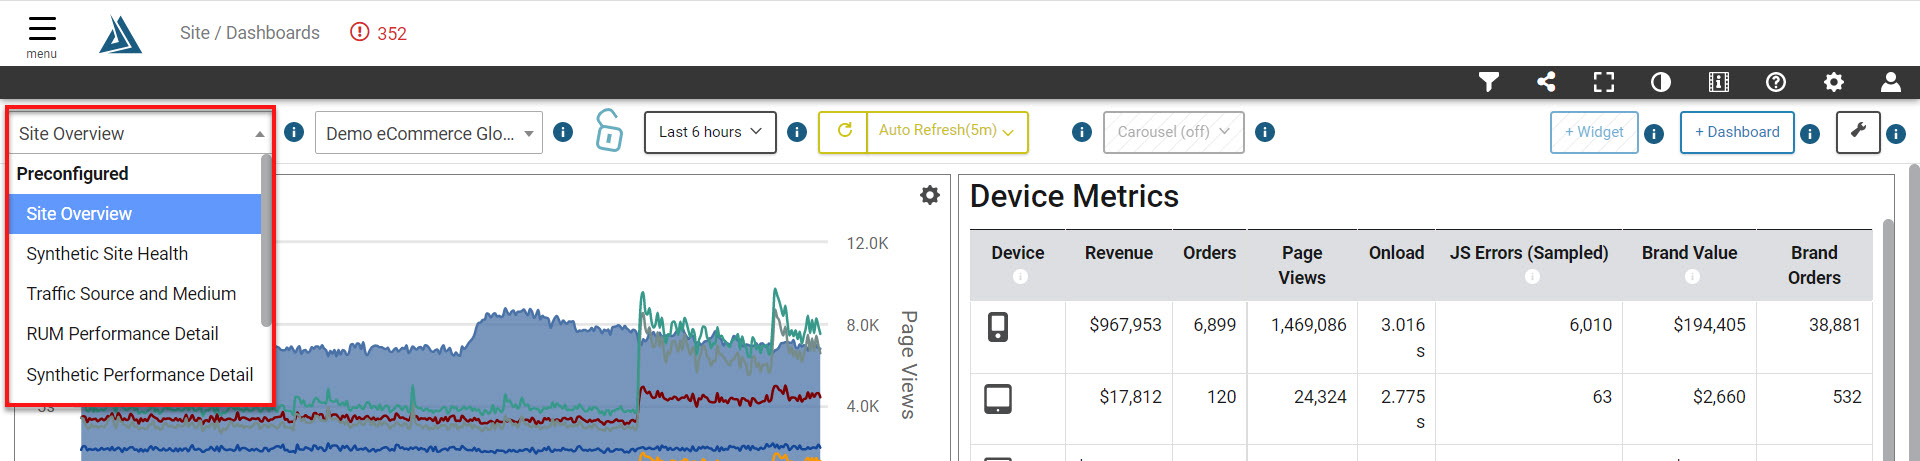
Click on the dashboard dropdown in the upper left of the dashboard page
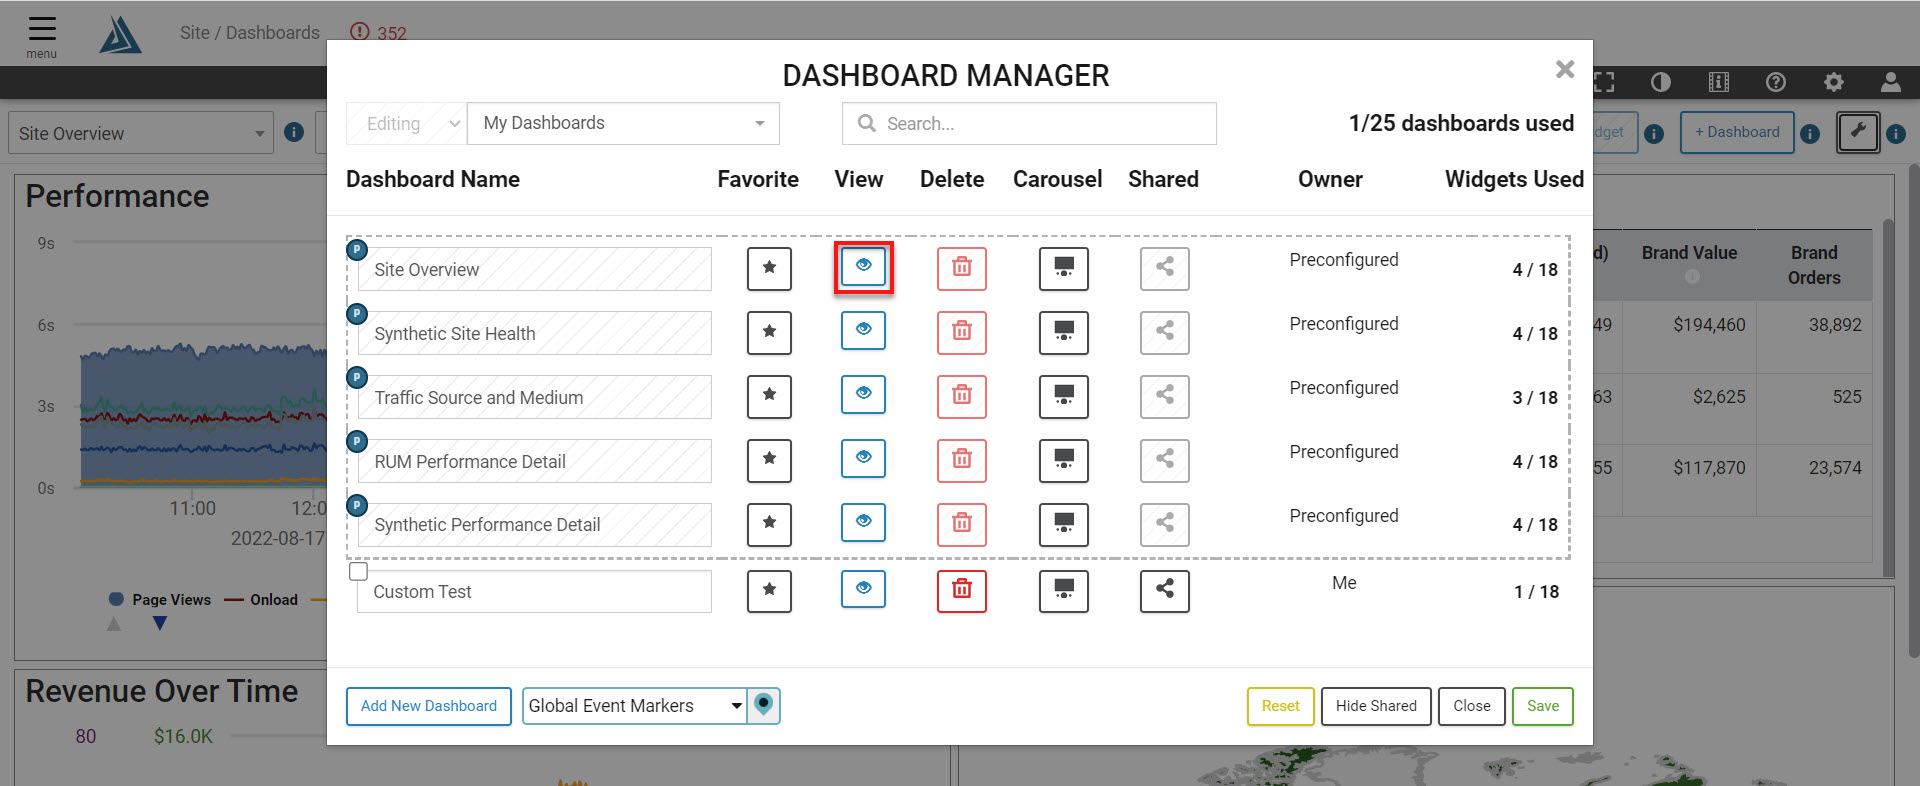
Or open the dashboard manager by clicking the Wrench icon in the top right of the page. This will open the Dashboard Manager which allows you to view or delete dashboards. By then selecting the Eye icon your chosen dashboard will open.
Widgets
Performance Widget
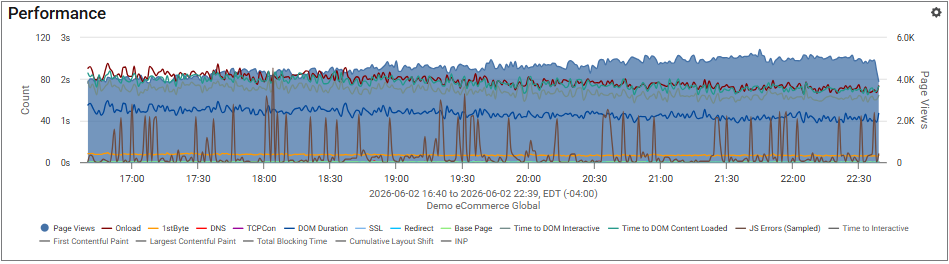
This widget, which by default is in the top left of this dashboard, provides an overview of performance metrics for your site for your preferred time period (time period can be selected in through the dropdown menu at the top of the dashboards page).
Device Metrics Widget
This widget, which by default is located in the top right of this dashboard, provides an overview of your site broken down by device type (IOS, Android, and Desktop).

Revenue Over Time Widget
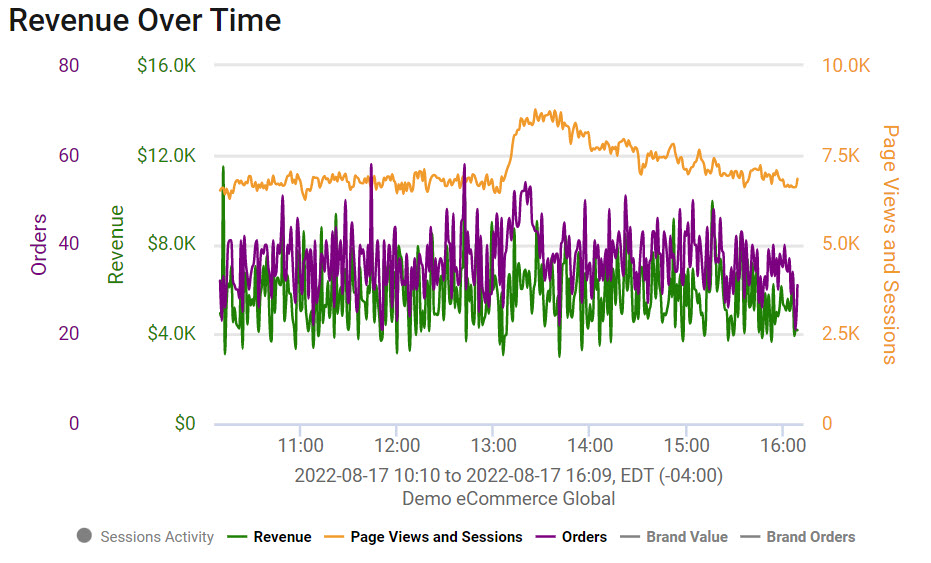
The bottom left widget lets you track the number of orders, revenue, page views, and sessions over time, allowing you to pinpoint the optimal times during the day for revenue. Use this information along with our Customer Journey Analysis to optimize when to run marketing campaigns for maximum return.
Geography Widget
The bottom right widget displays the performance of your site / app by geography. The colors indicate the quality of performance for that region, red being sub-par and green as acceptable performance. Click any region on the map to expand the view of that specific area.
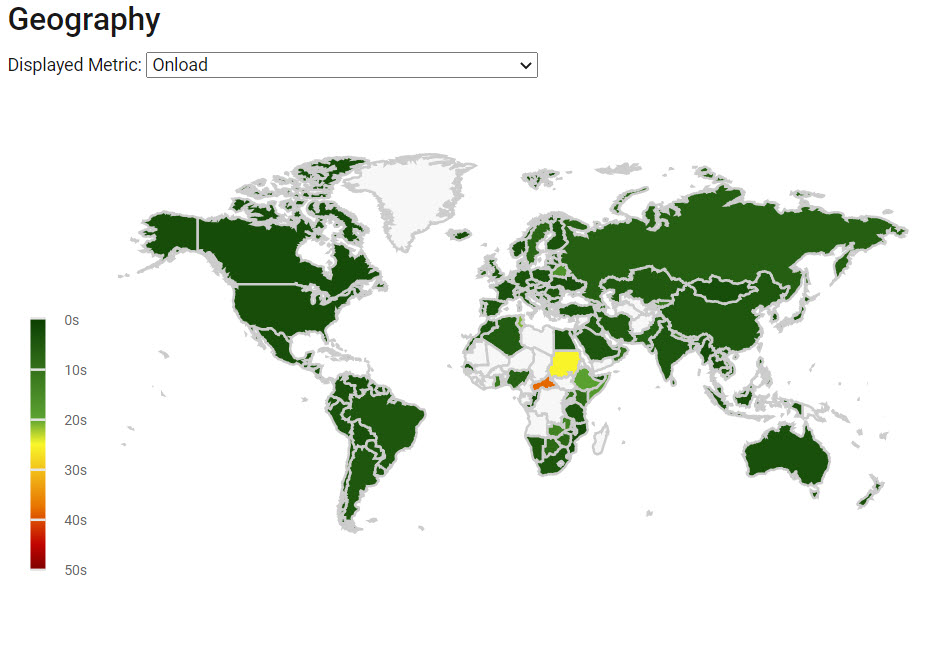
Note: Click a region to zoom into sub-regions.
How to Filter the Site Overview Dashboard
To filter the data, click the Filter icon on the top right of the screen. This will open a menu where you can apply any number of criteria to filter on. Click Apply to reload the dashboard with the new filters.