Overview
The API Check Error Tracking Widget gives you a summary of the health and performance of your API Check monitors by listing all of your active monitors along with a performance and availability status bar with a variety of customization and configuration options listed below.
Displayed Metric

The displayed Metric selector allows you to choose which metric is used for the performance line within the bar for each monitor.
This is also the metric used to show the average and last measured times to the right of each monitor status bar.
Monitors in Error State
The "Monitors in Error State" section lists the monitors that are currently in error state.

This dashboard uses the "Error Tracking" section in the configuration for each synthetic monitor to determine whether the monitor is in Error State.
|
Note: the monitors do not move from the list into the Monitors in Error State section - they are duplicated into the the section to preserve ordering and view. |
In-Widget Settings
If you click the gear icon in the top right of the widget, a few options appear.
|
Graph Height |
Height of each monitor status bar in pixels. |
|---|---|
|
Space Between Graphs |
Pixels between each graph. |
|
Prioritize Monitors in Error State |
Show/Hide the "Monitors in Error State" section. |
|
Show Metric Average |
Show/Hide the "Avg" column to the right of each monitor status bar. |
Monitor Name Link
Clicking the Monitor Name will open the Error State Tracking report in a new tab with that monitor selected.
Clicking the lightening bolt opens a menu to Run Instant Measurement.
Clicking the gear icon opens a new page with the monitor configuration in edit mode.
Clicking the graph icon opens a view in Performance Detail.
|
Note: To define the severity of the HTTP codes or custom synthetic error codes in Blue Triangle you can use the Synthetic Codes page. |
Find Widget
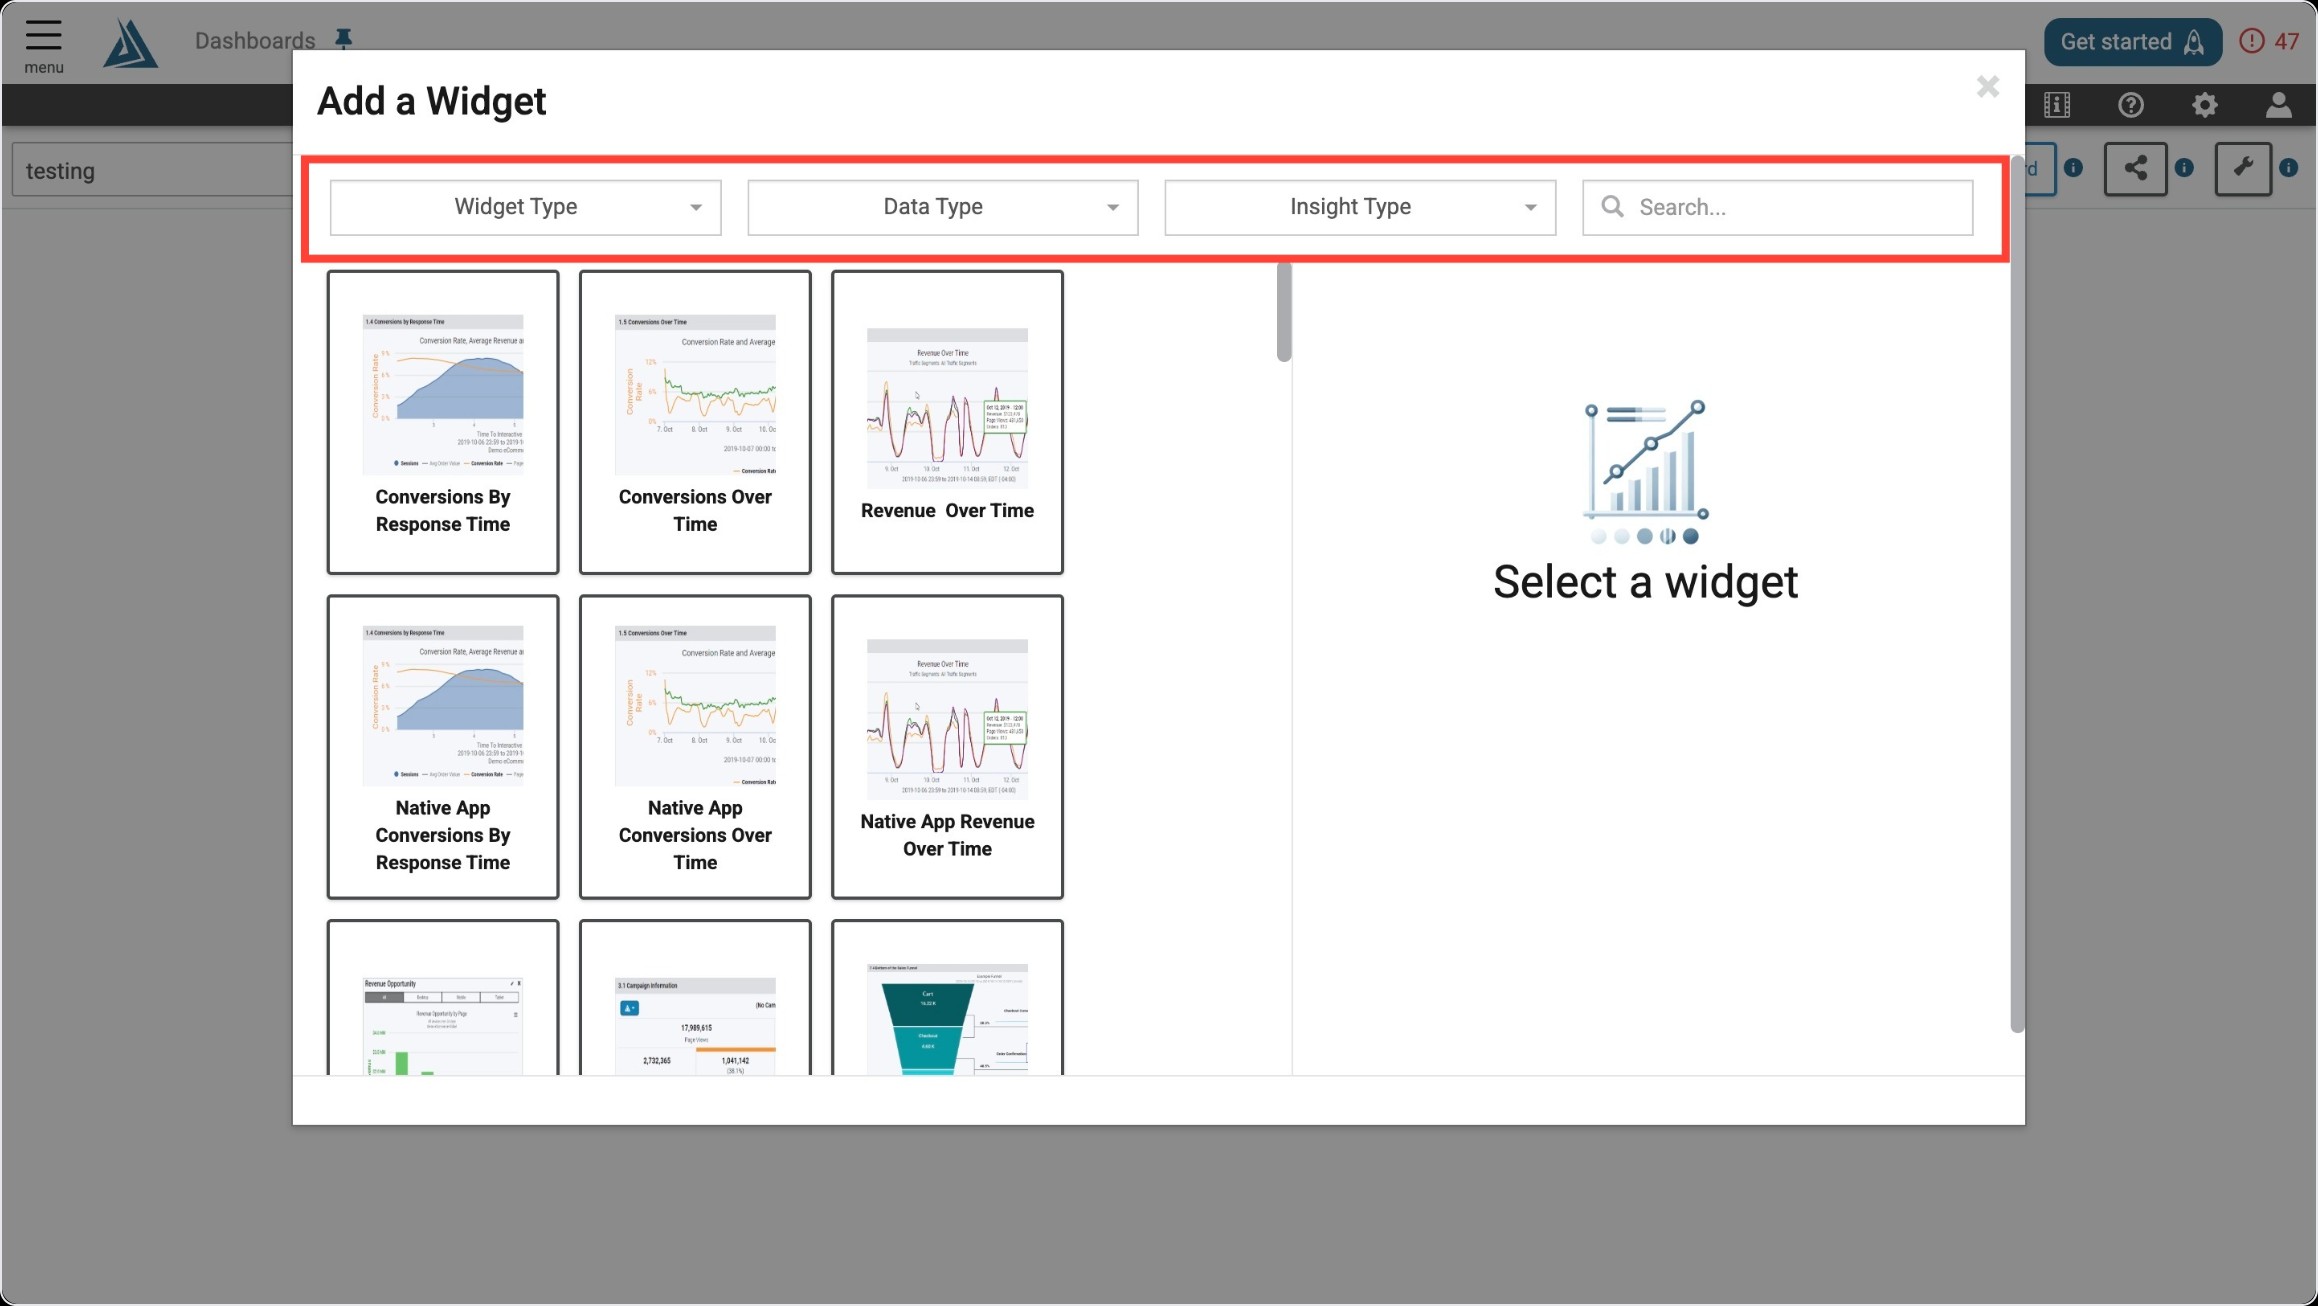
Once you enter the Add a Widget menu, you will see a variety of filter options on top. One way to find the API Check Error Tracking Widget is to use the filter options listed below.
|
Filter Title |
Filter Option |
|---|---|
|
Widget Type |
Trends |
|
Data Type |
Real User |
|
Insight Type |
Business |
Another way to find the API Check Error Tracking Widget is to use the search bar at the top right of the menu.
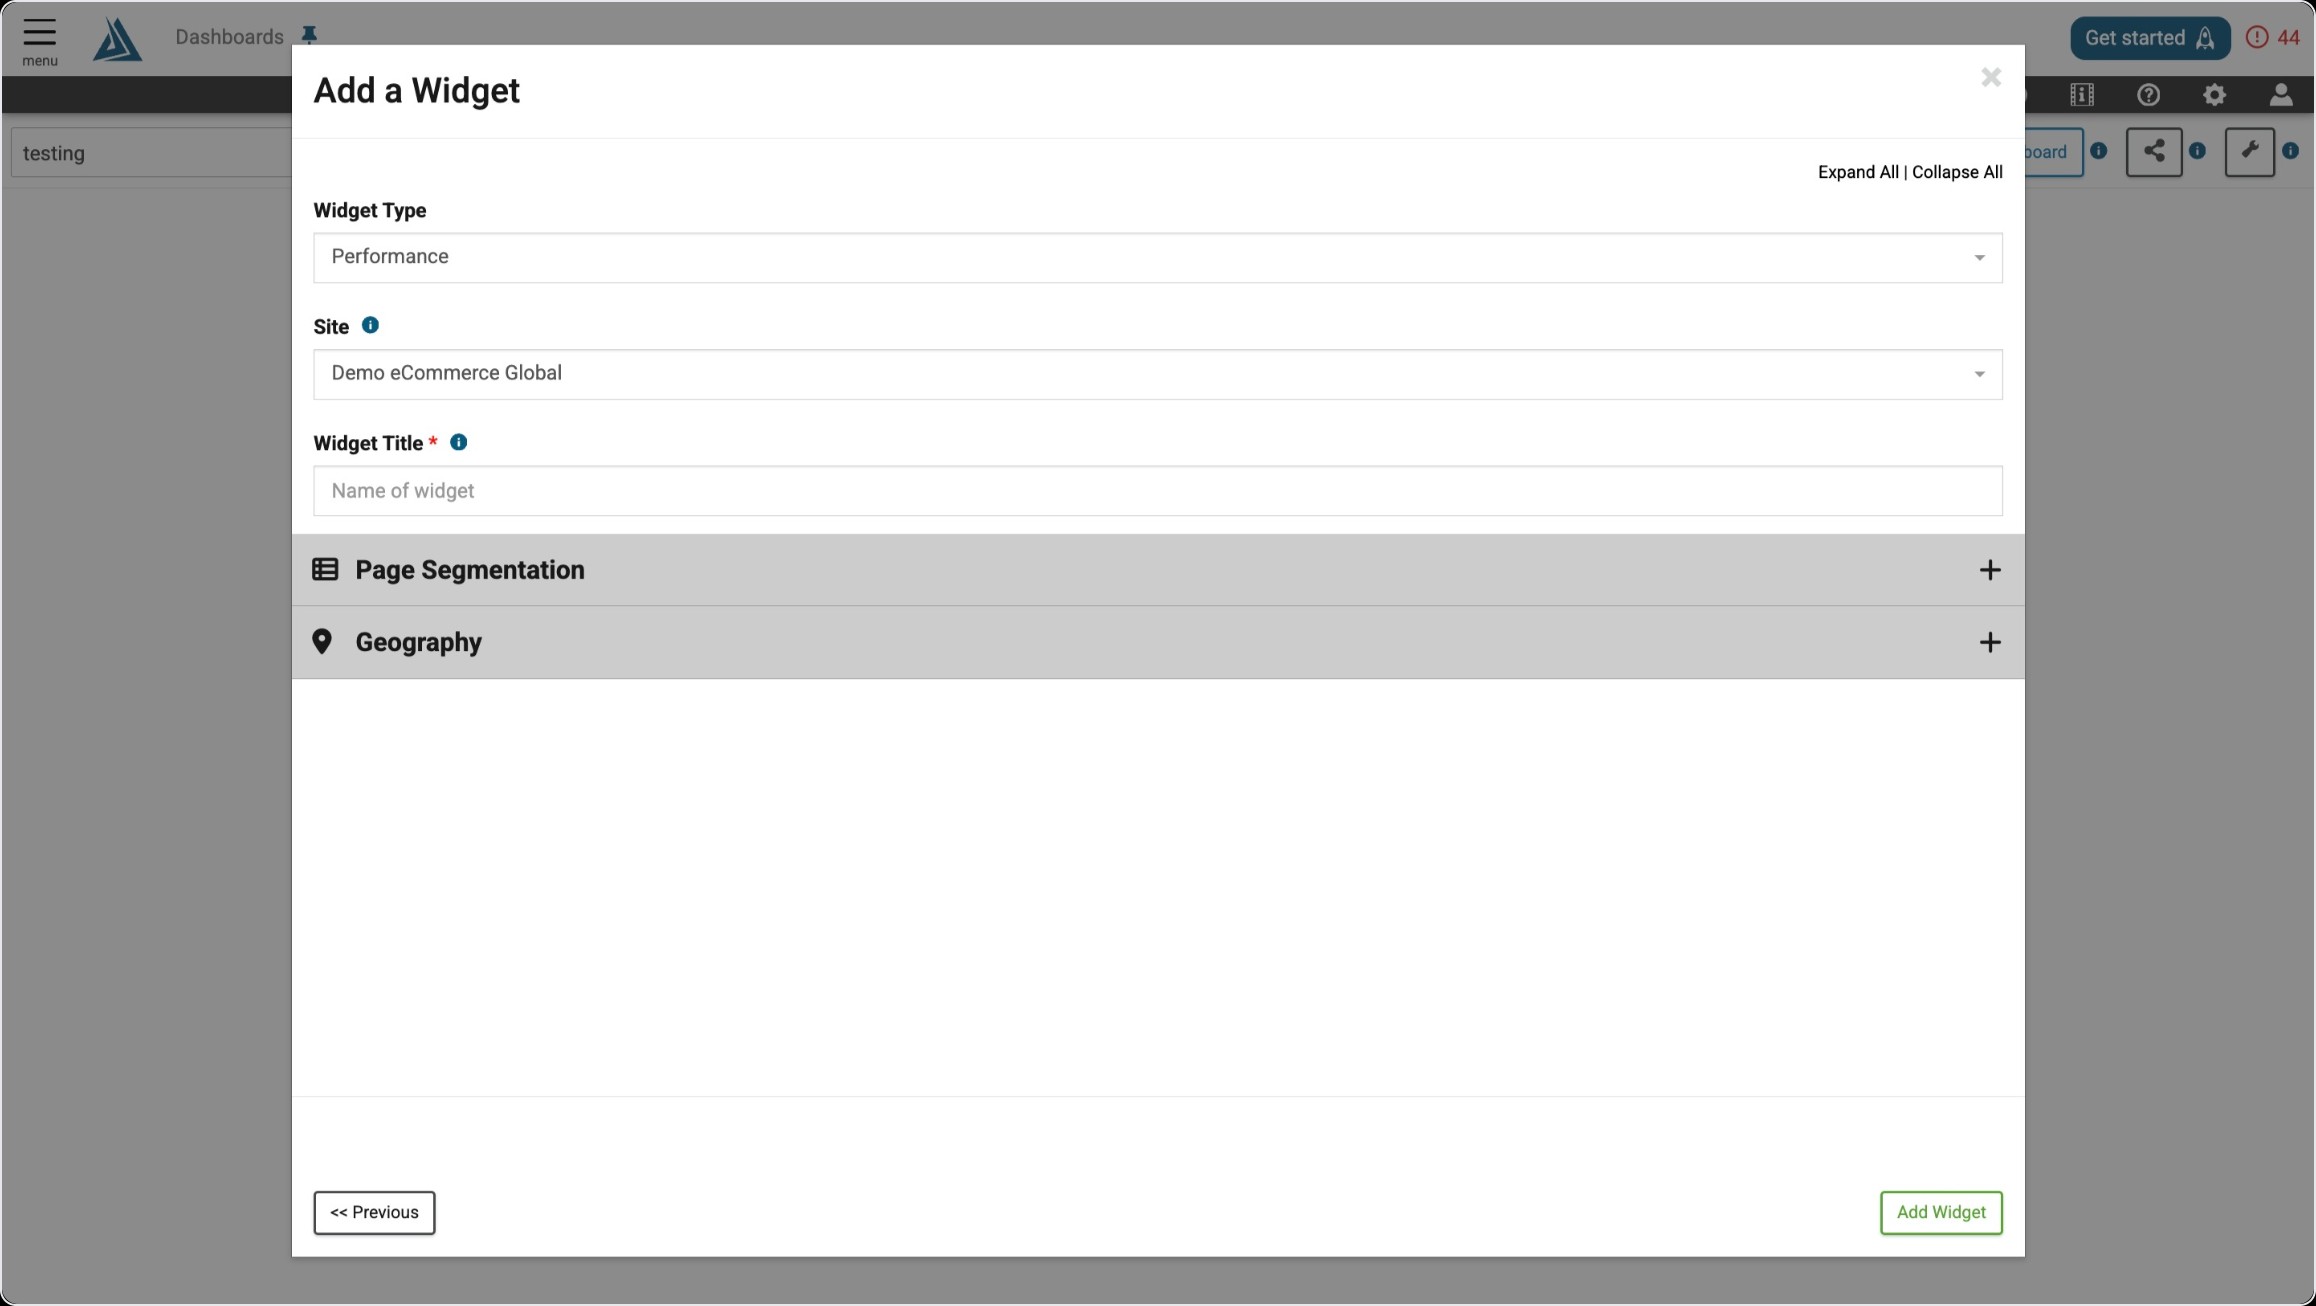
Widget Configuration
The only required configurations for this widget is a title. The Page Segmentation and Geography filters are also available in the configuration window, but can be applied after the widget is created as well.
Monitor Name configuration is available under the Page Segmentation filters. This allows you to filter down the list of monitors to appear in the widget.