Overview
This widget is available to be added to custom dashboards. For more information on custom dashboards, please visit How to Create Custom Dashboards, andCustom Dashboard Widgets.
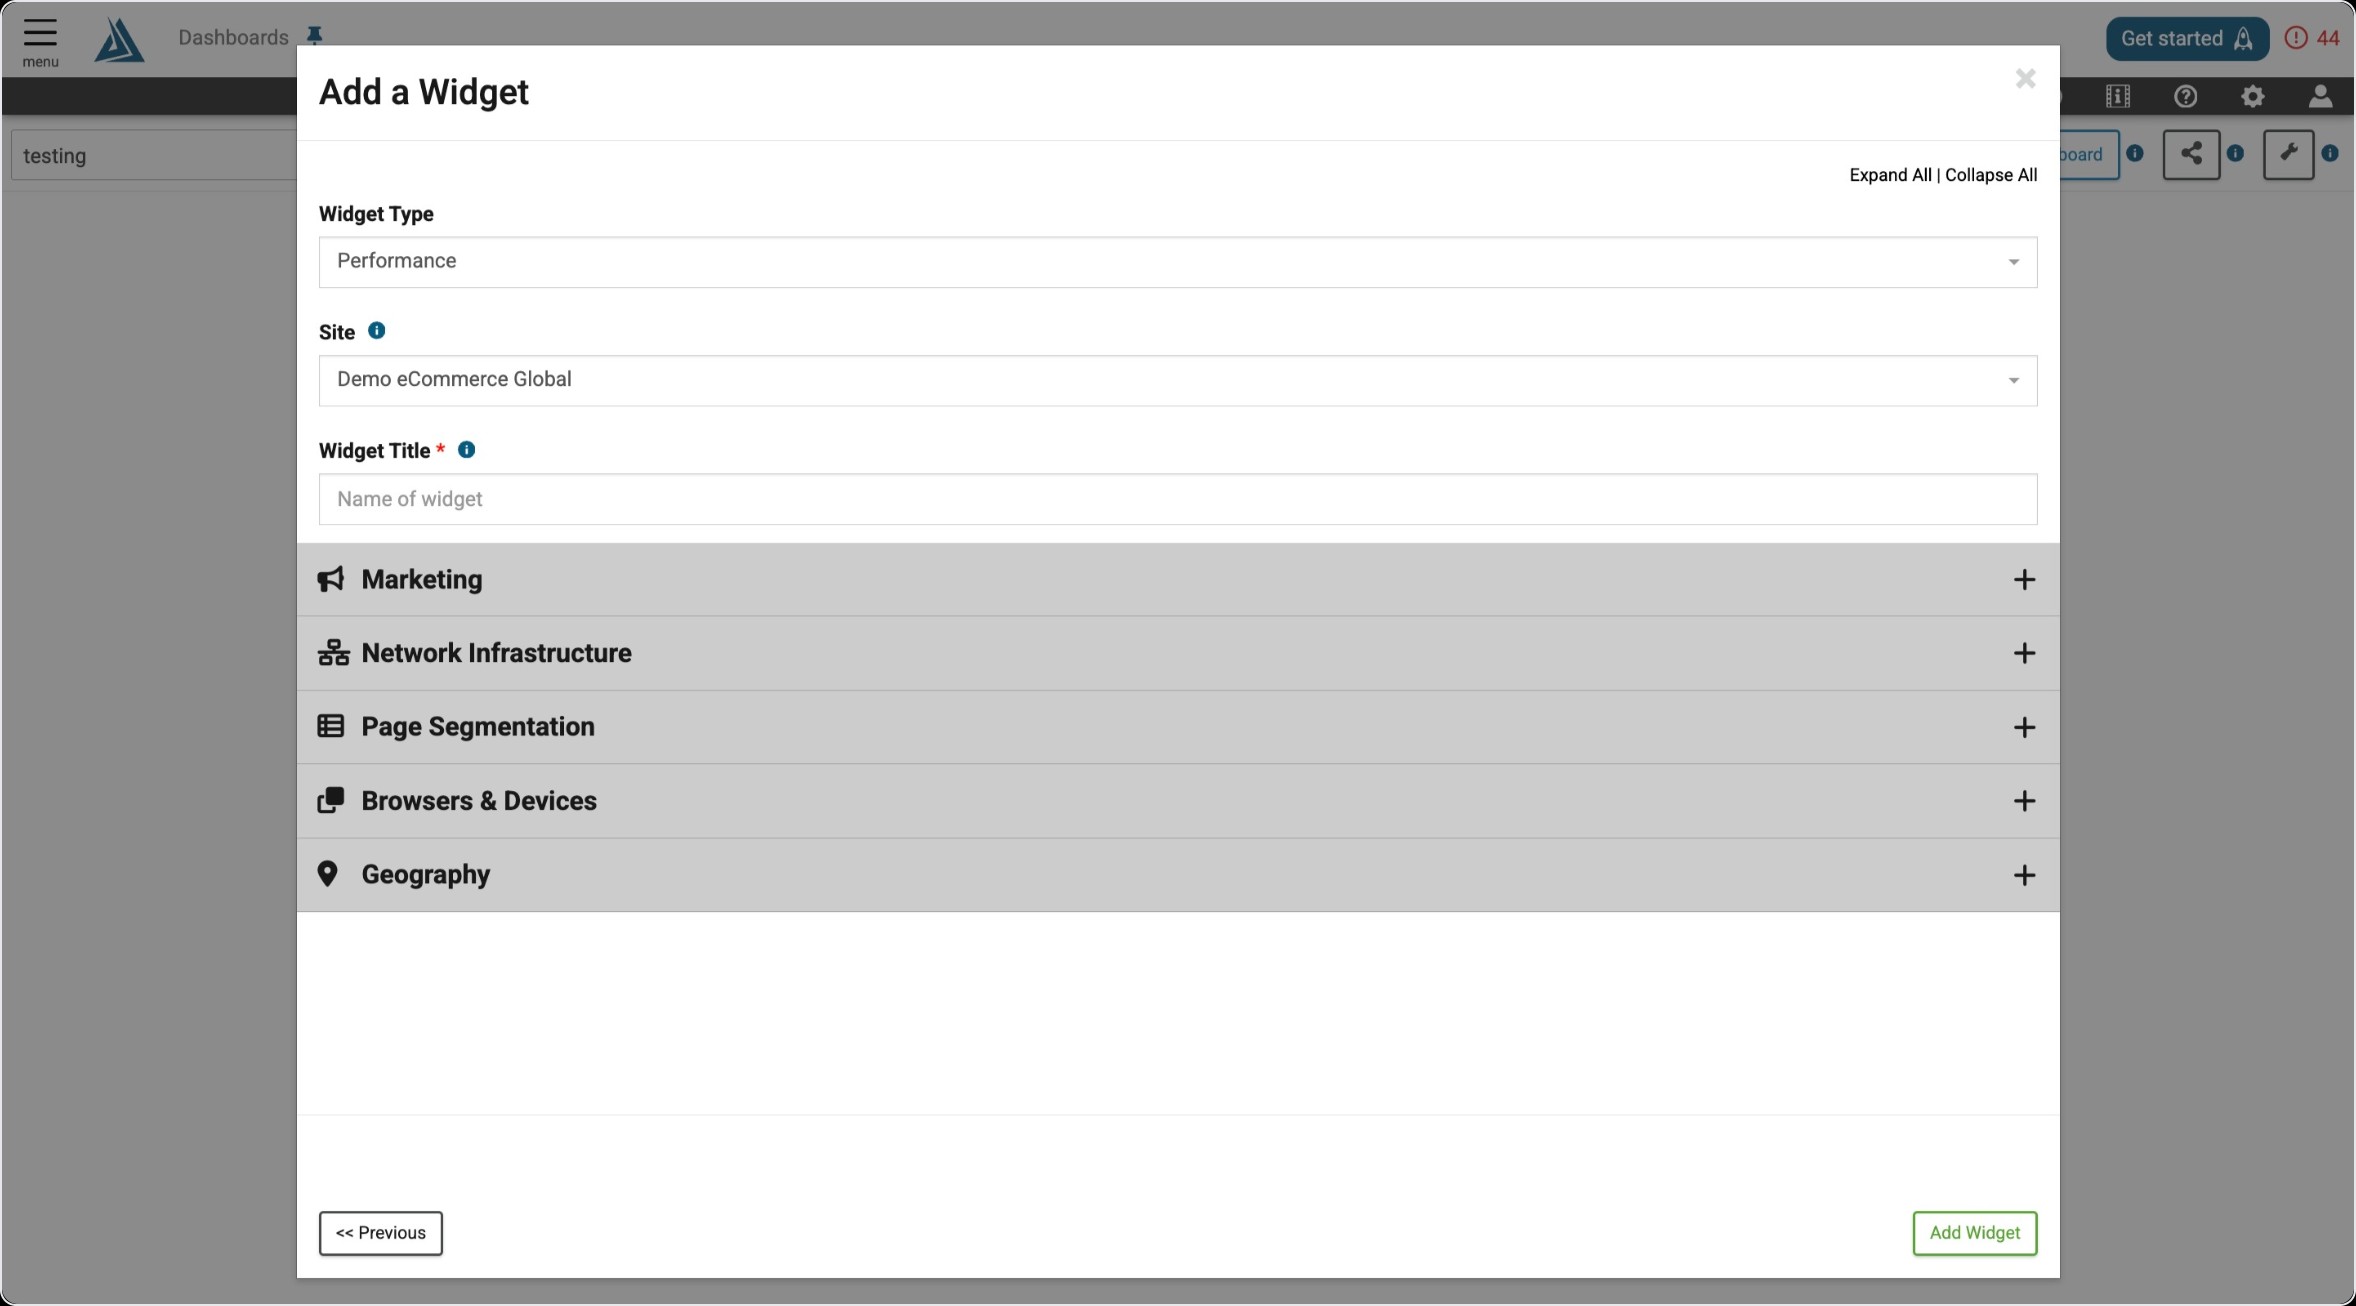
The Native App Crash Summary widget shows the number of Total Crashes, Unique Crashes and Sessions impacted over a specified time period.
Users can select up to five pages/app screens that they would like displayed in this widget. If no selection is made, the top five crashes based on hits will be displayed.
Navigation from this widget will take the user to the Native App Errors Explorer page.
Find Widget
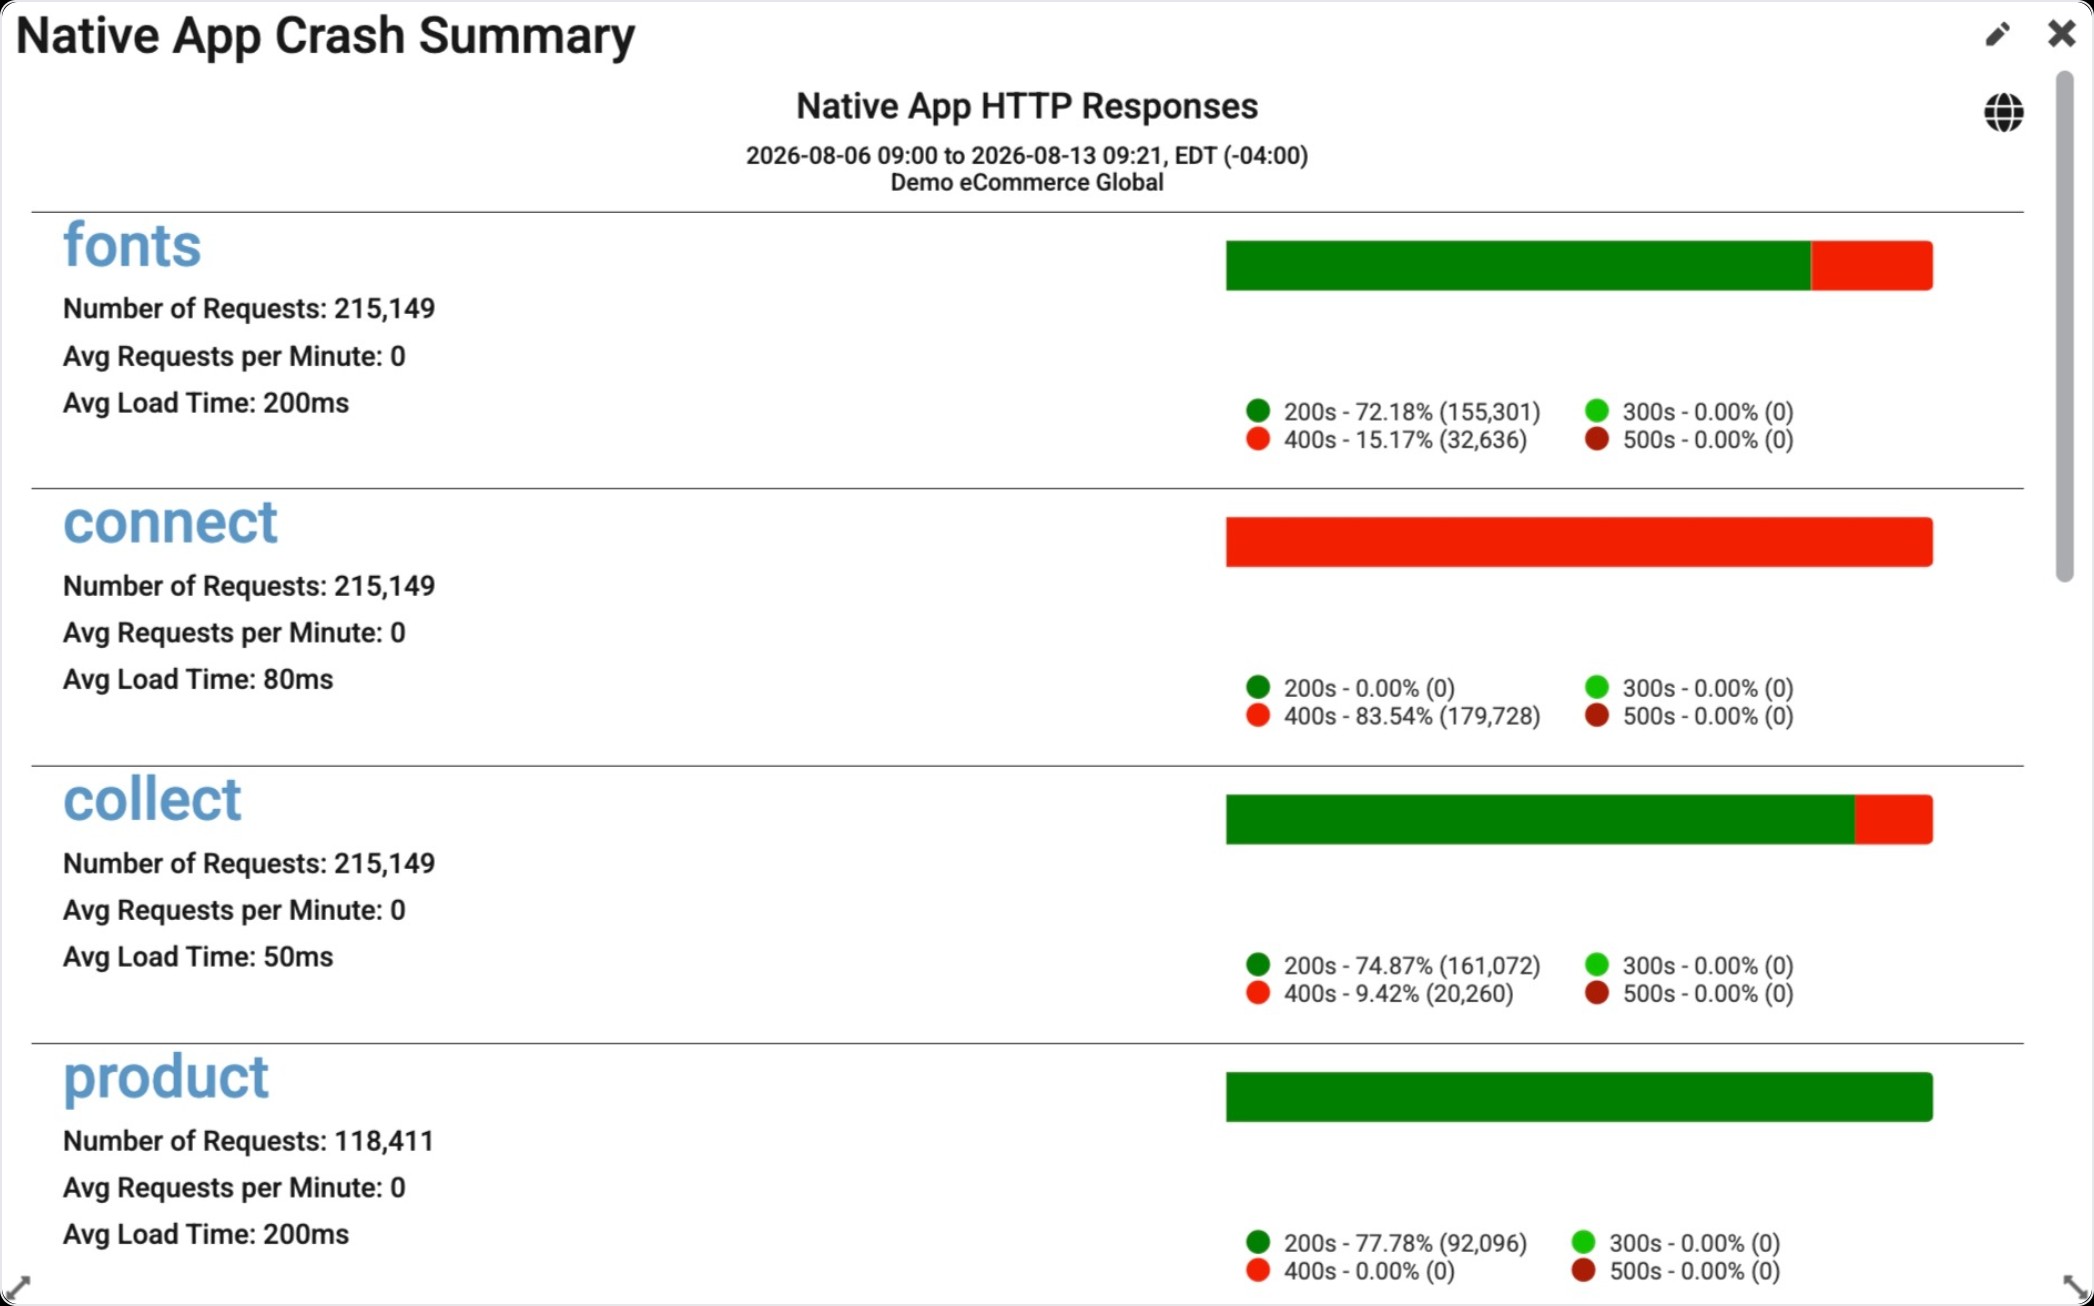
Once you enter the Add a Widget menu, you will see a variety of filter options on top. One way to find the Native App Crash Summary Widget is to use the filter options listed below.
|
Filter Title |
Filter Option |
|---|---|
|
Widget Type |
Summaries |
|
Data Type |
Real User |
|
Insight Type |
Performance |
Another way to find the Native App Crash Summary Widget is to use the search bar at the top right of the menu.
Widget Configuration
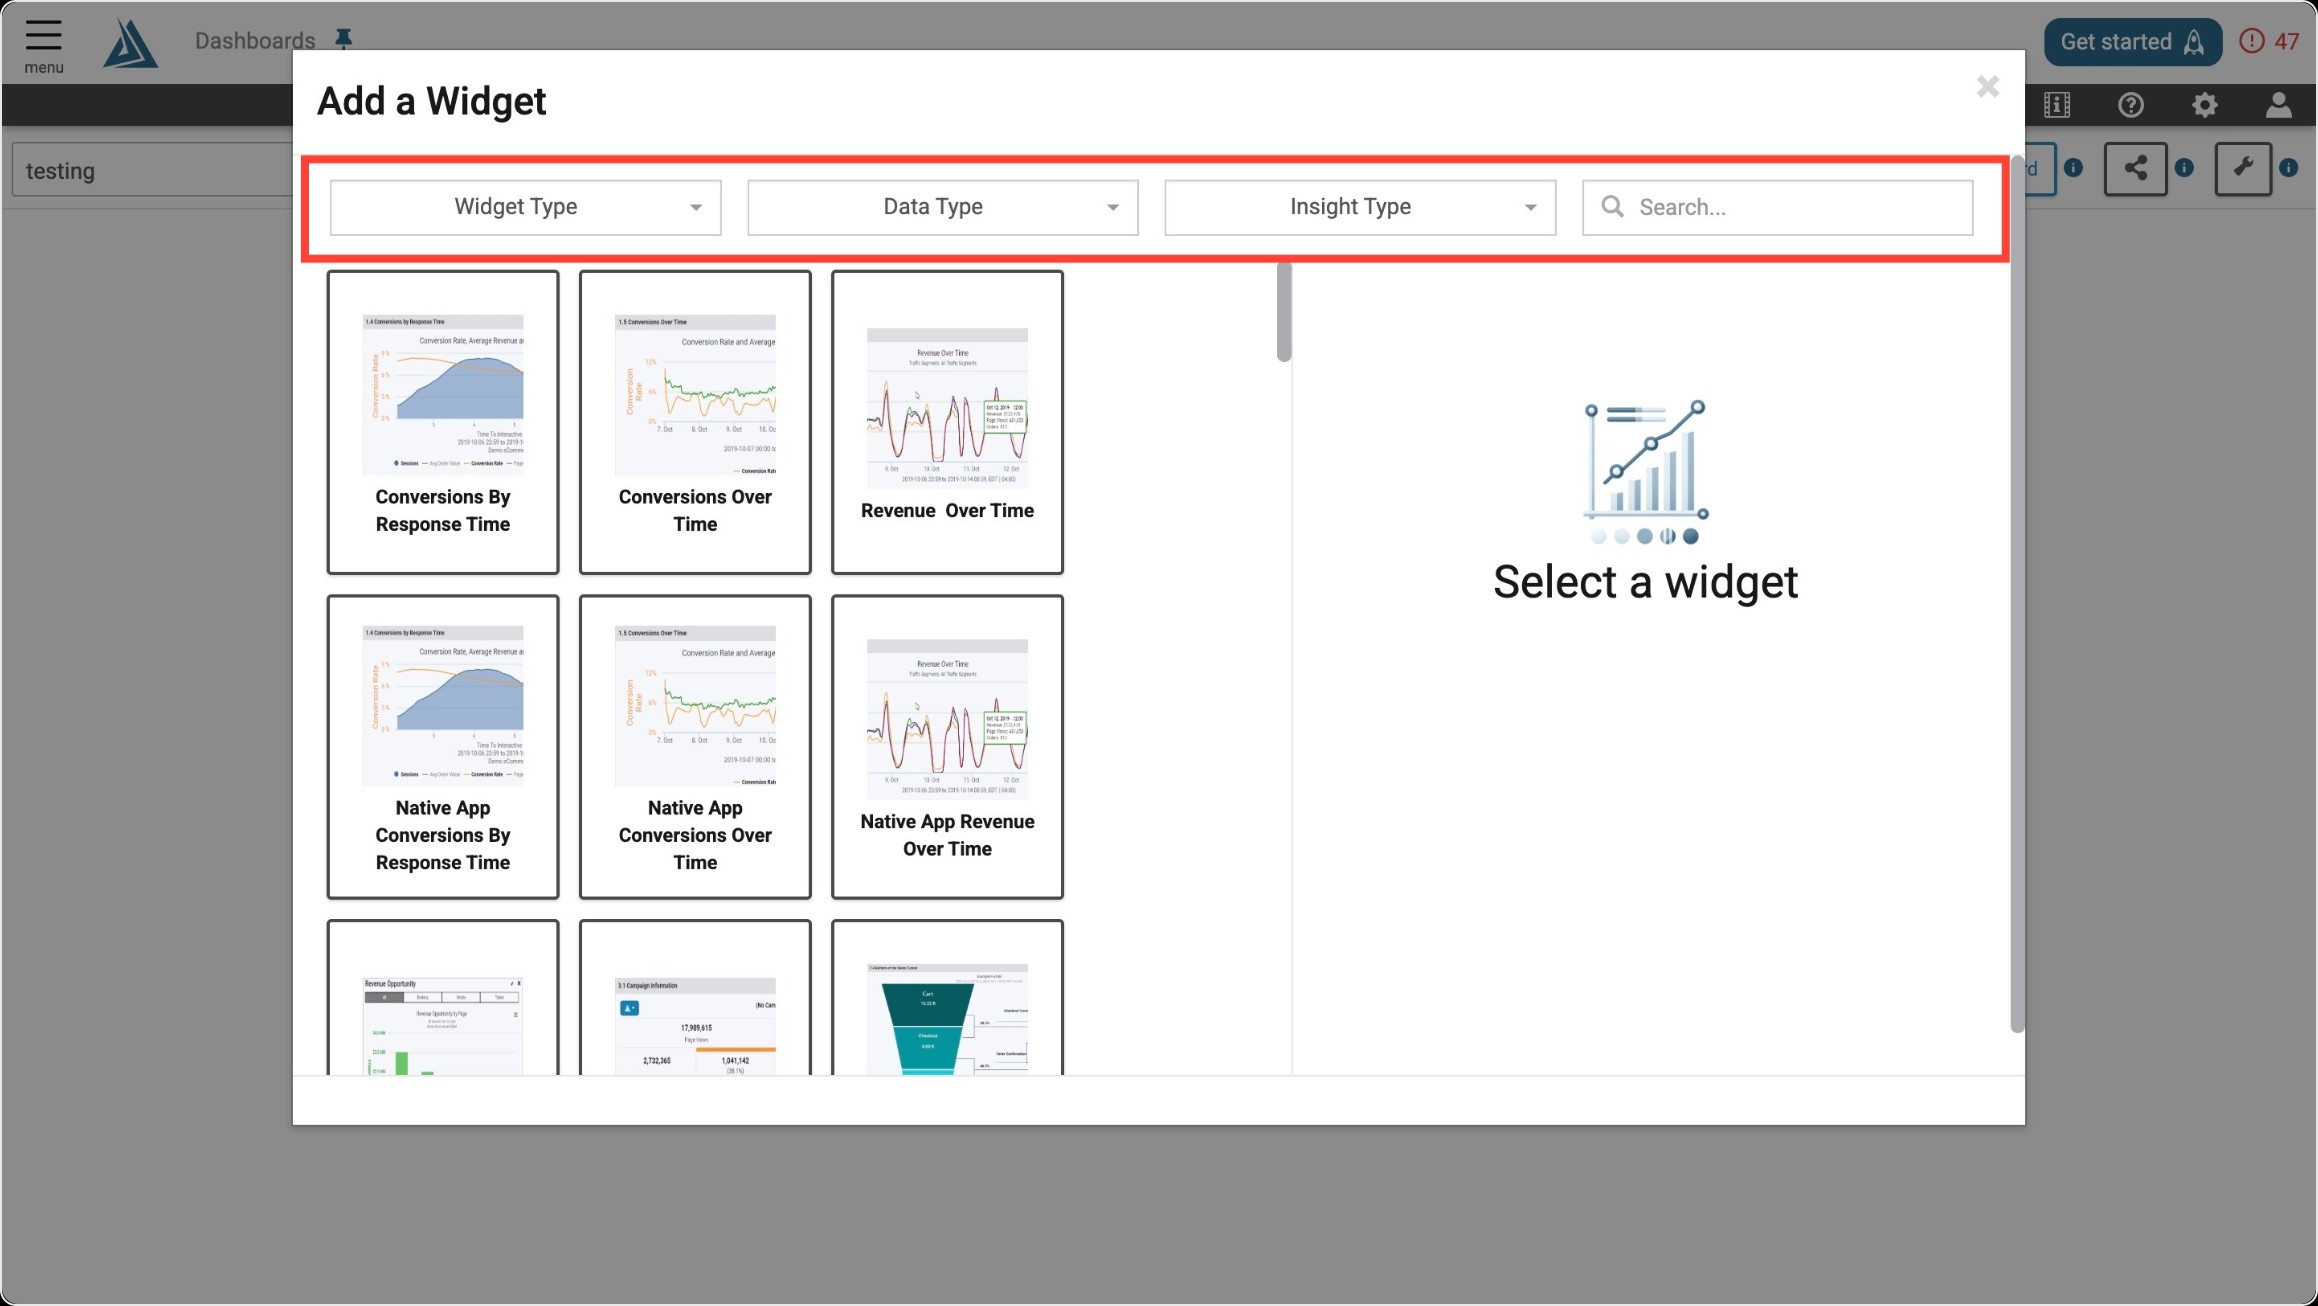
The only required configuration for this widget is a title. The General Marketing, Network Infrastructure, Page Segmentation, Browsers & Devices, and Geography filters are also available in the configuration window, but can be applied after the widget is created as well.