Summary
Network Health Checks perform ping and traceroute-style tests and allow you to monitor things like network latency, packet loss and jitter. You can set up alerts for these monitors within the monitor configuration. In this guide, you'll learn:
-
How to Configure a Network Health Check Monitor
How to Configure a Network Health Check Monitor
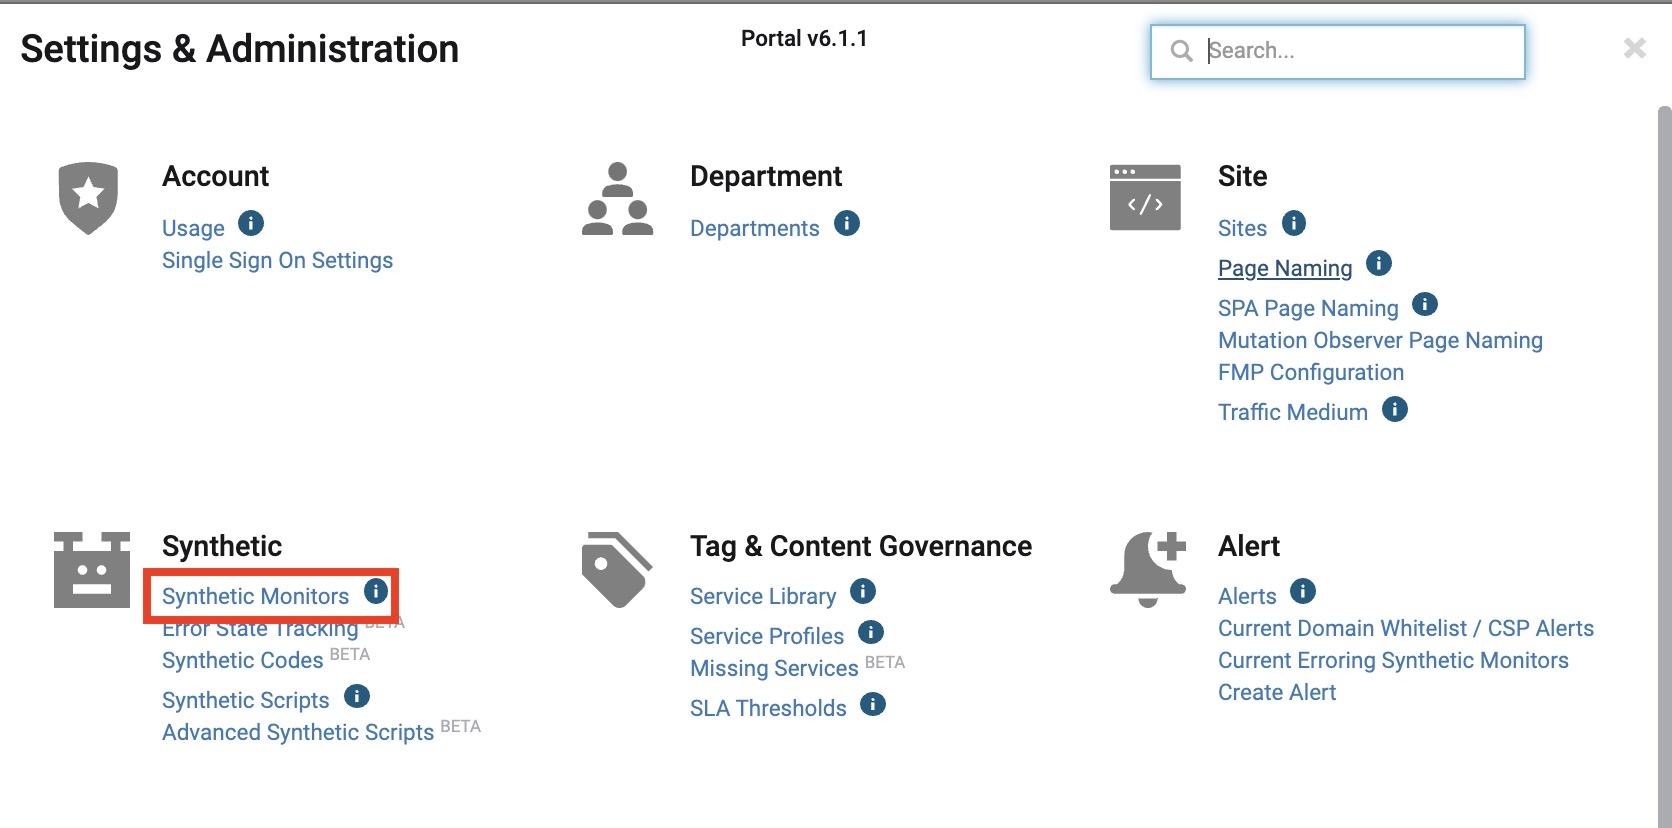
First things first, navigate to the Synthetic Monitors page - through the right-side Settings & Administration menu indicated by the gear icon. From here, select Synthetic Monitors.
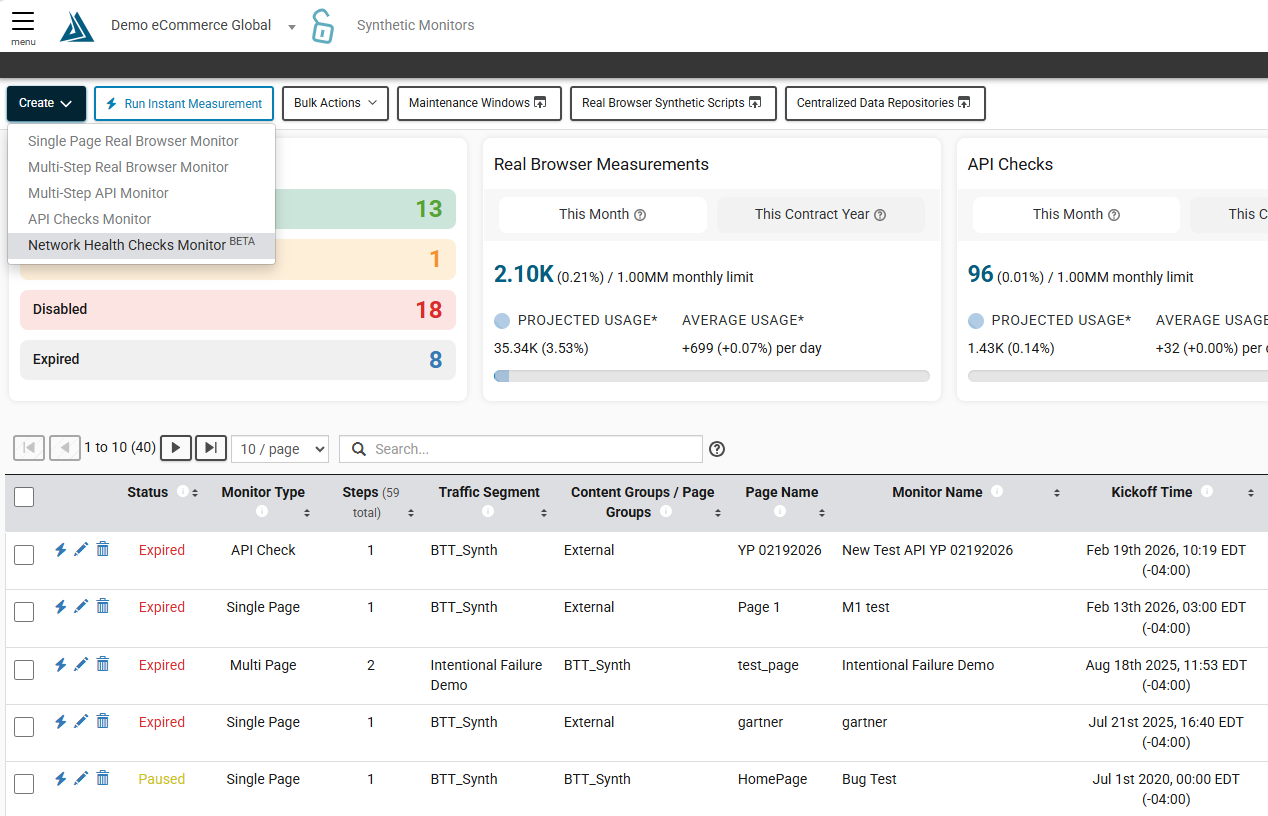
Now we're going to go ahead and create a new Network Health Checks monitor. So to get started, in the top left click Create > Network Health Checks monitor.
First, give the monitor a name and configure the Agent Schedule. You can run the monitor for a set start and end time or run it indefinitely. Also, set any maintenance windows you'd like to apply to this monitor.

We're going to create one of these for the Blue Triangle Help Center (help.bluetriangle.com). In the Agent Configuration section, choose the method and enter the Domain/Host. If you're using TCP, you'll also be able to specify a port number. For more information on the available methods, checkout our Network Health Checks Documentation.
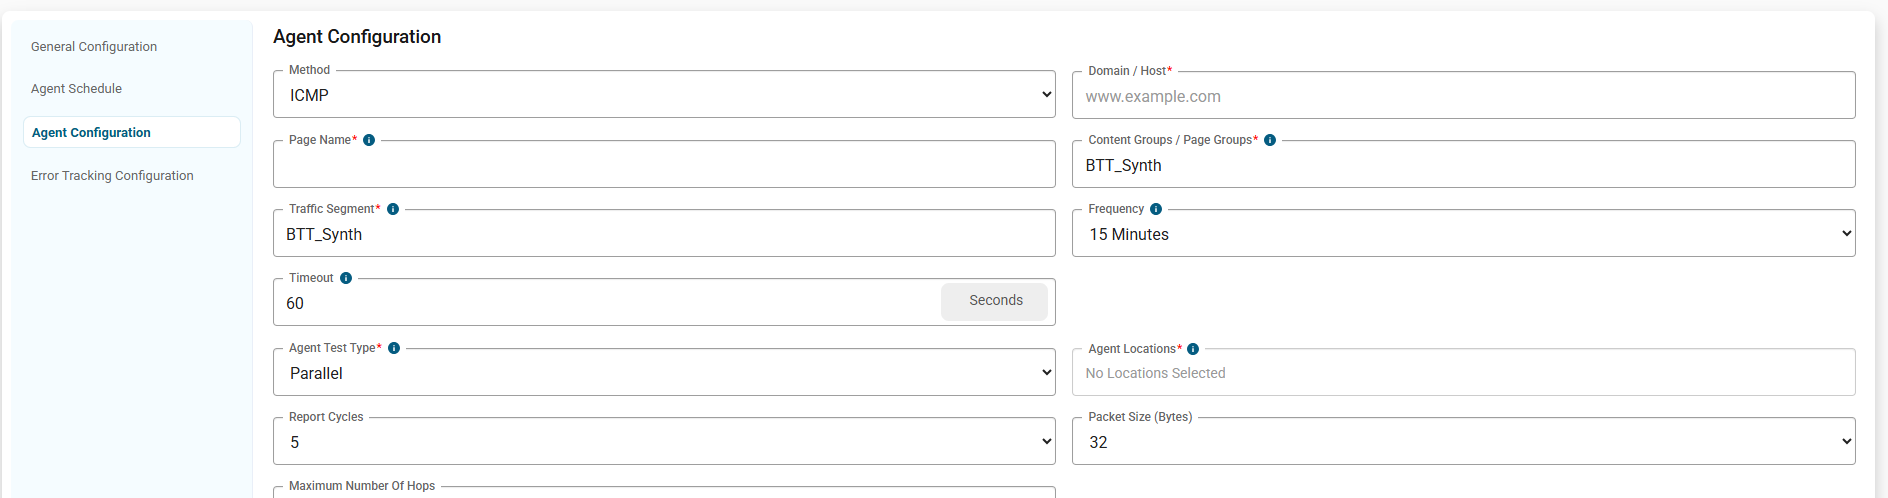
The Page Name, Page Group, and Traffic Segment - these are all ways to segment the data when you get to viewing it in the dashboards and reports. If you have a lot of these, you can group them together by using the same page group or traffic segment.
Next, choose the Frequency these measurements should run, whether they should run sequentially or in parallel, and choose the Agent Locations it should run from.
Report Cycles is the number of measurements or traceroutes used for the final MTR (My Traceroute) report data. If you don't know what to choose, we recommend setting it to 5. Additionally, you can configure the Packet Size and Max Number of Hops here.
The last section is the Error Tracking Configuration, which is where you can configure the conditions required to send an alert. The Timing Window Rolling is basically the evaluation window or the lookback period. You'll want to make sure there's going to be enough samples (measurements) within this time period, otherwise the alert will never trigger.
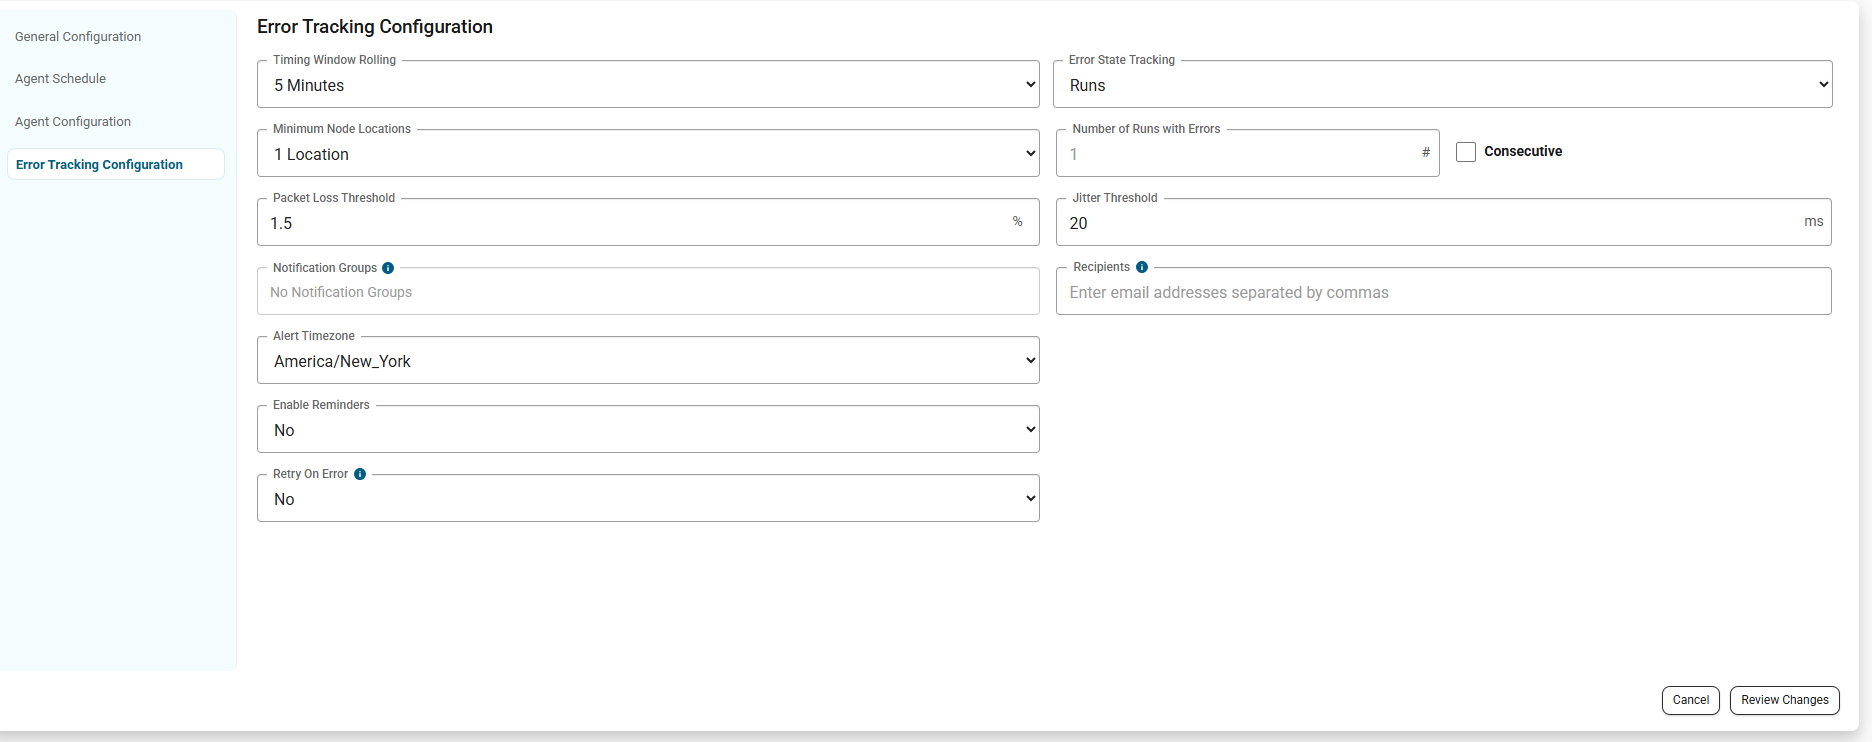
With the Error State Tracking option you can choose whether to monitor the # of runs with errors, or the percentage of runs with errors. You can configure the Minimum Node Locations, Number of Runs with Errors and whether those errors must be consecutive.
Next, configure the Packet Loss Threshold and the Jitter Threshold. These are the primary metrics you can alert on.
Lastly, remember to enter the Notification Group(s) and/or the Recipient email address(es) for the emails to be delivered.
Before you finish setting up the monitor, there are a couple more options you can configure - Reminders and Retry on Error.

You can choose yes then have the system remind you of open issues every day, three days, seven days, etc. And if a measurement fails, you're able to do a retry. This means the agent will immediately re-run the measurement and validate the failure.
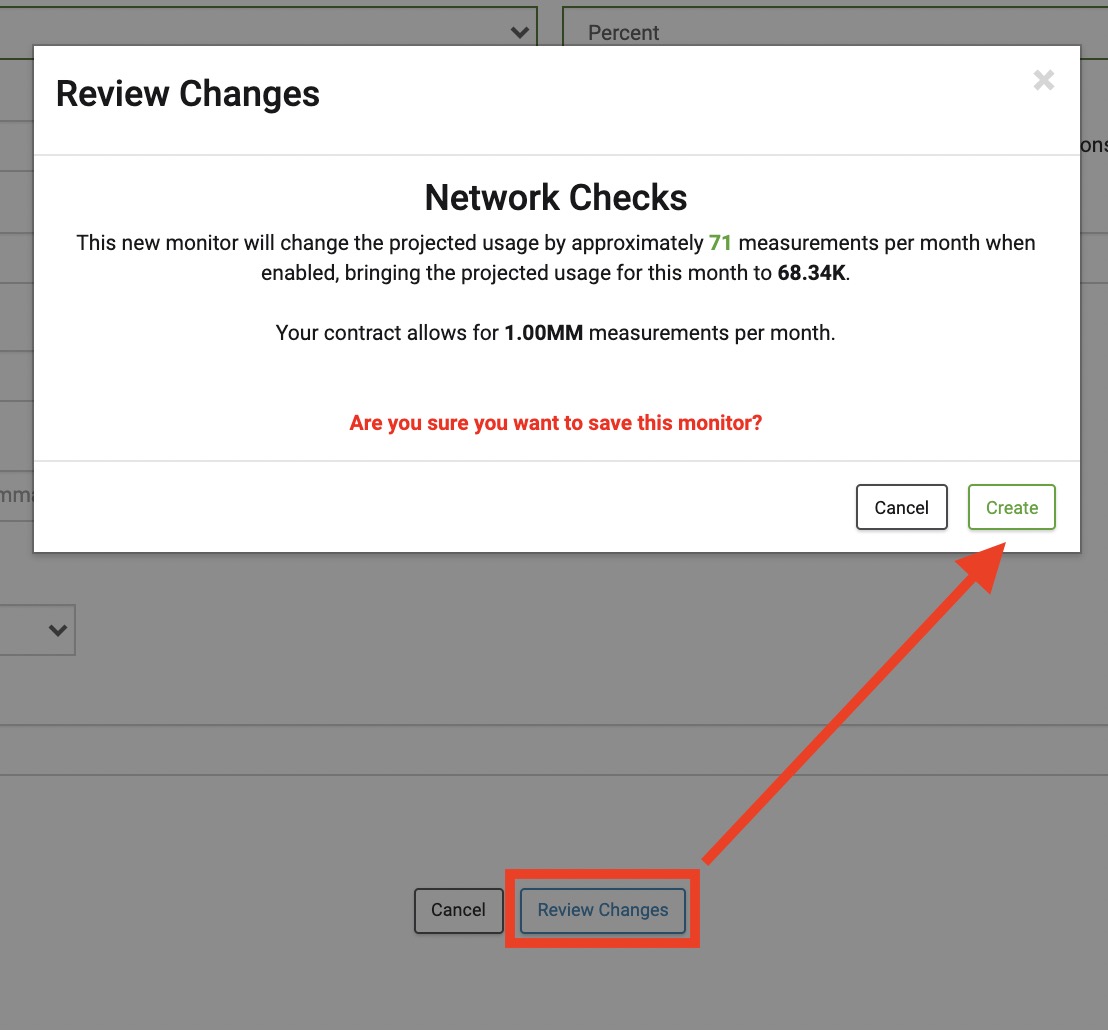
Now that we've filled everything out, go ahead and click Review Changes > Create and the new monitor will appear in the table.