Overview
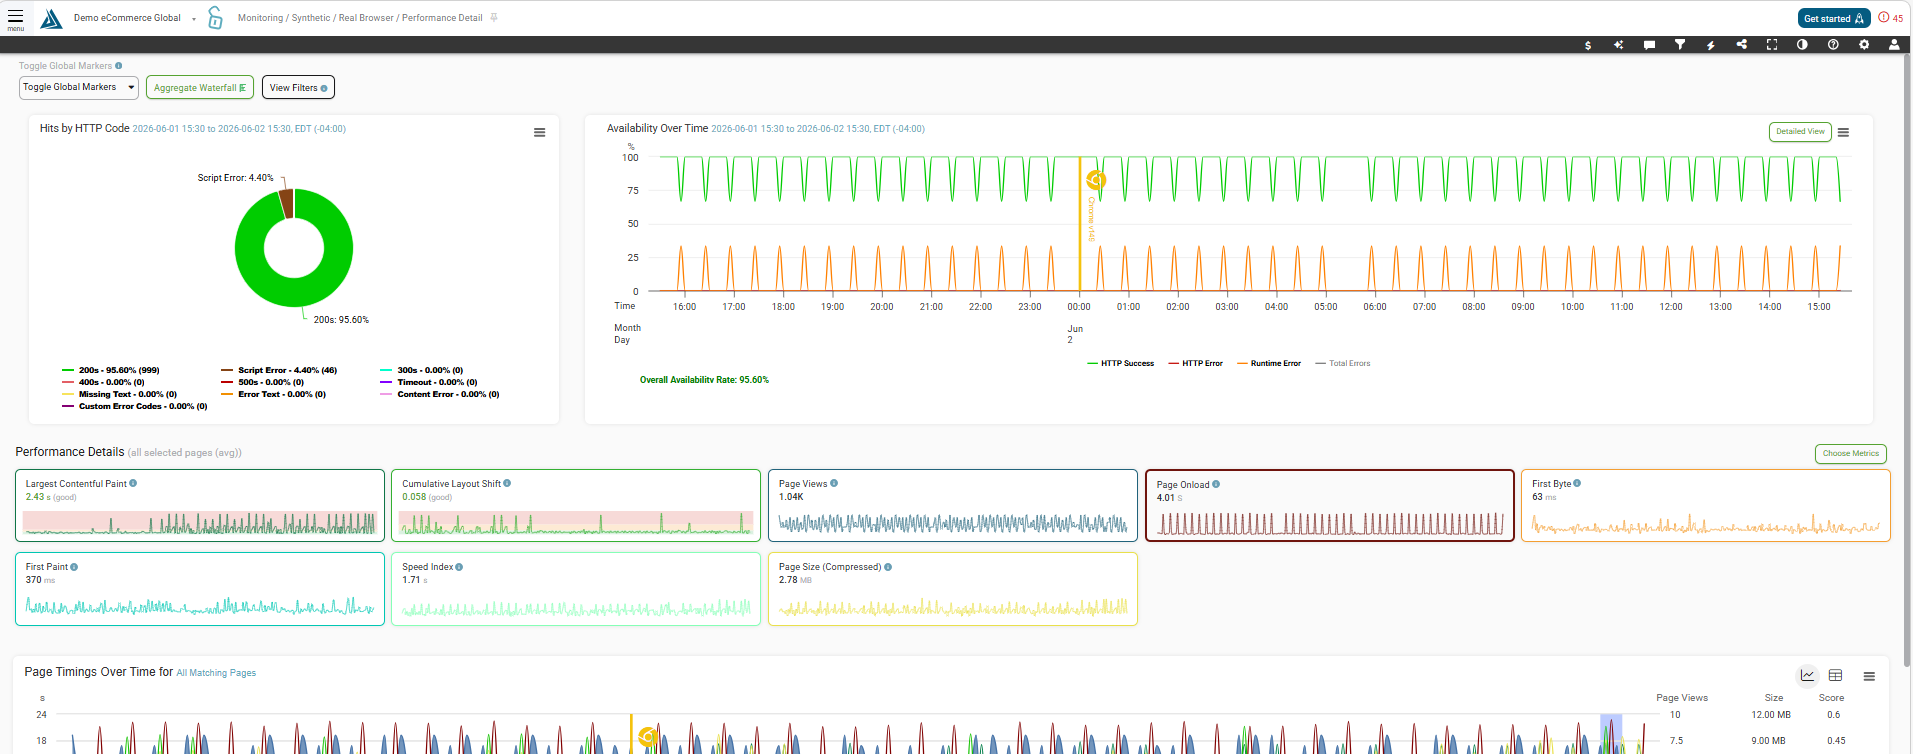
The Synthetic Performance Detail page enables you to analyze your synthetic data both at a high-level glance and all the way down to individual page measurements.
Where to Find the Synthetic Performance Detail Page
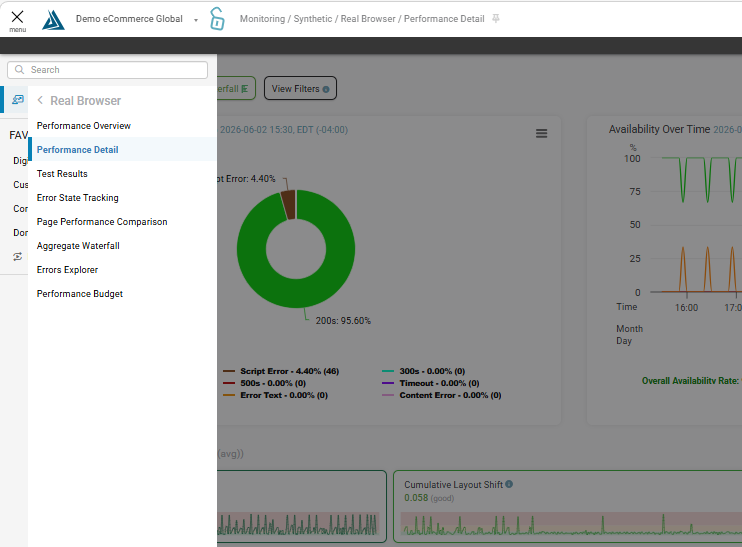
To find this page go to the main navigation on the left side of the portal, then Monitoring->Synthetic ->Real Browser → Performance Detail
Widgets
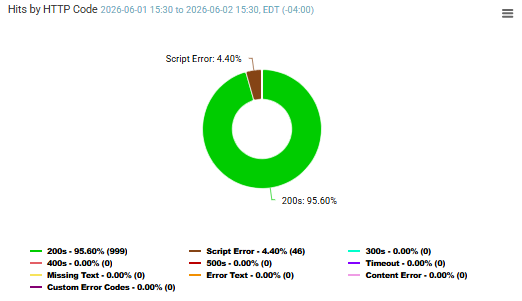
Page Hits by HTTP Code
This widget displays a pie chart of the types of HTTP code errors that a page is experiencing. Click on the different error legends to toggle them on and off the chart.
Site Availability Over Time
The graph at the top shows site availability trended over time for the given pages or synthetic scripts you have selected.
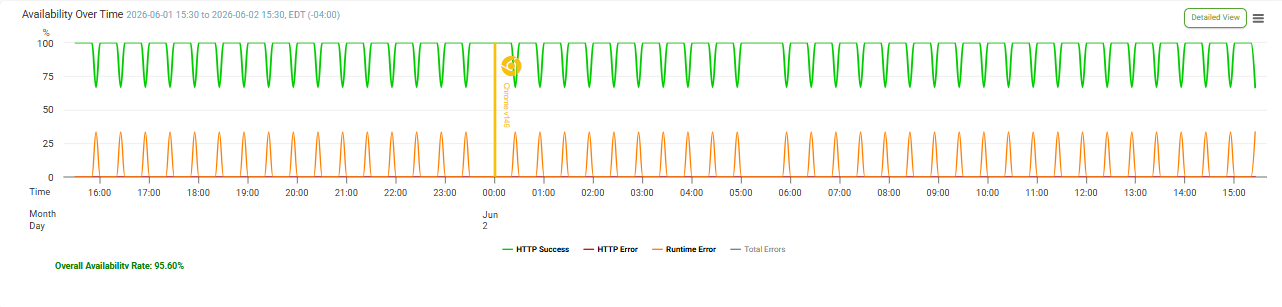
You’ll be able to tell what kind of errors are occurring given the lines for 400 and 500 series errors, timeouts, and others.
Performance Details
The cards here show you the high-level overview of metrics during the time period selected- in this case, the past 24 hours.

Performance Graph
Moving down the screen we see the Performance Graph. This shows all of your metrics trended across the time period.

You can click each metric in the legend to enable or disable the metrics in the graph. To see this data in a table click the button below to Toggle the Performance Table.
Scatter Plots
In the scatter plots, squares indicate a screenshot is available for that measurement, diamonds indicate that both a screenshot and filmstrip are available, and triangles indicate no screenshot or filmstrip was captured. Runs that retry on error are shown as gray scatter plot points.
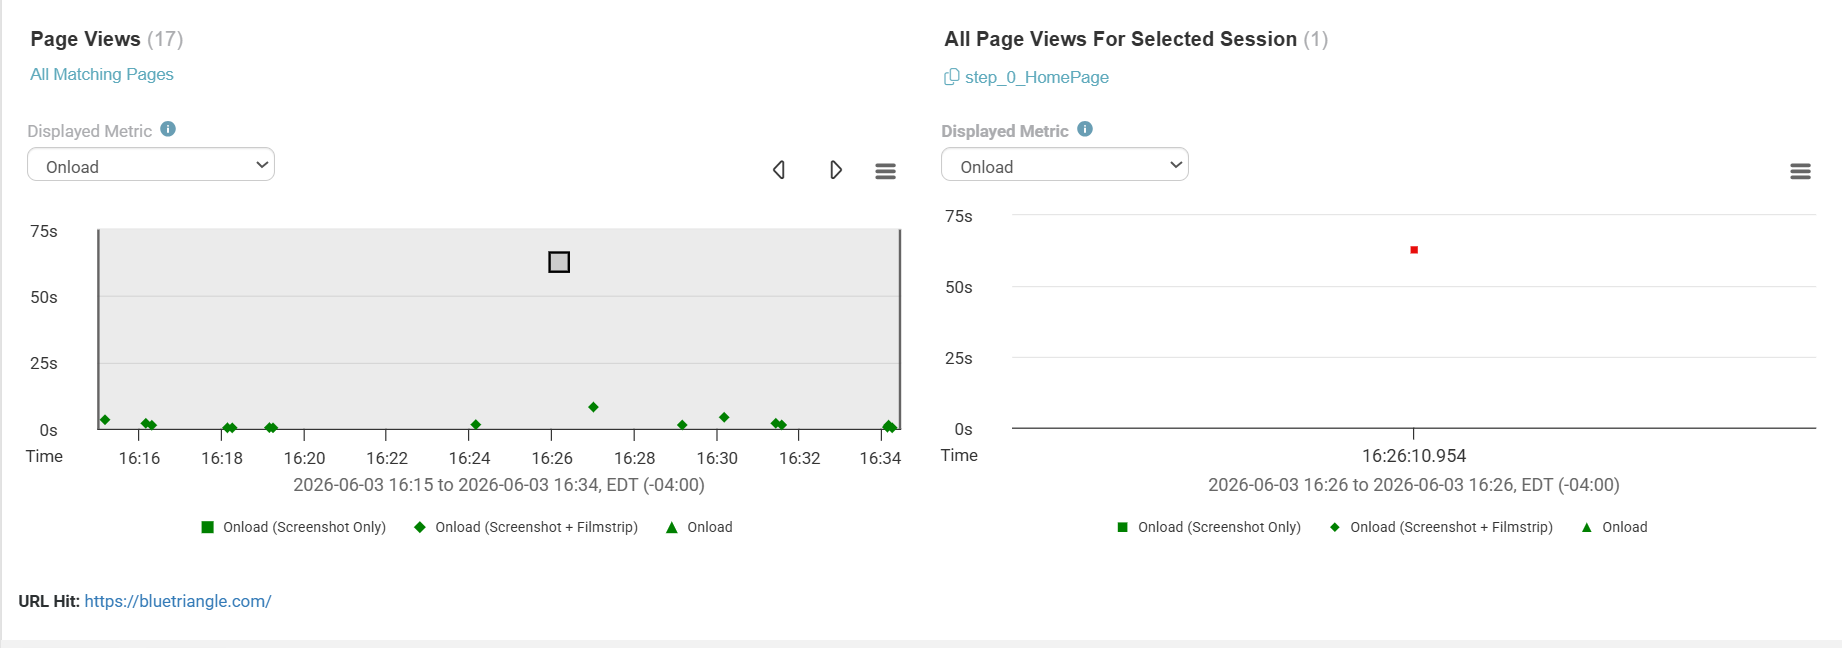
Notice the time-frame in the scatter plot corresponds to the shaded region in the performance graph above. Click a different section of the graph to see the measurements during that time frame below.
Clicking a point in the scatter plot to the left allows you to drill in to that measurement for more detail. Clicking the point in the right scatter plot opens more details as shown below.
Performance Breakdown and Screenshots
Below that we have more graphs and information for the measurement. By default you will see the object level detail waterfall. You can also view other related graphs by choosing between the options on the tabs above the graph. You will also be the screenshot and or filmstrip of the exact page view.
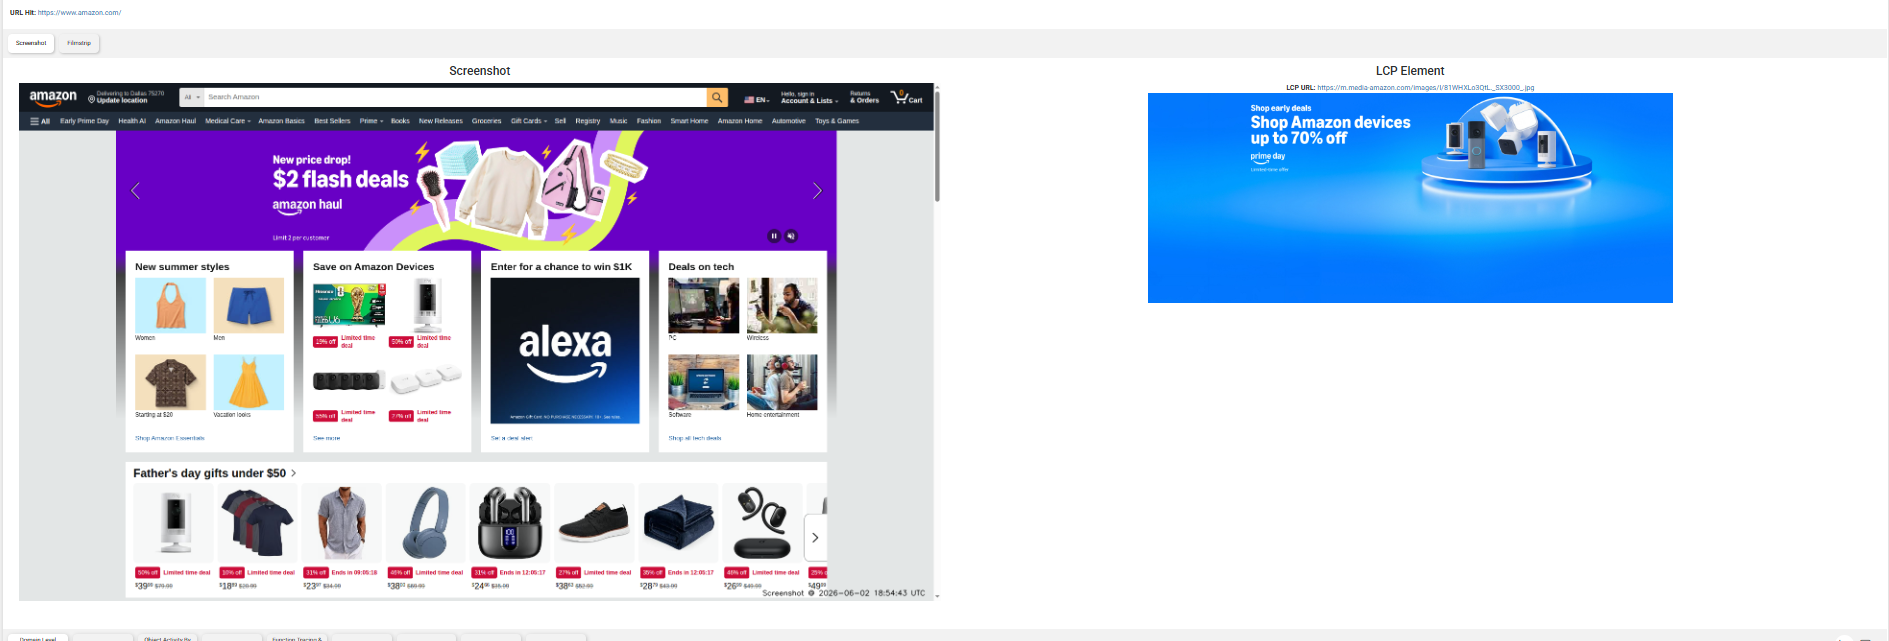
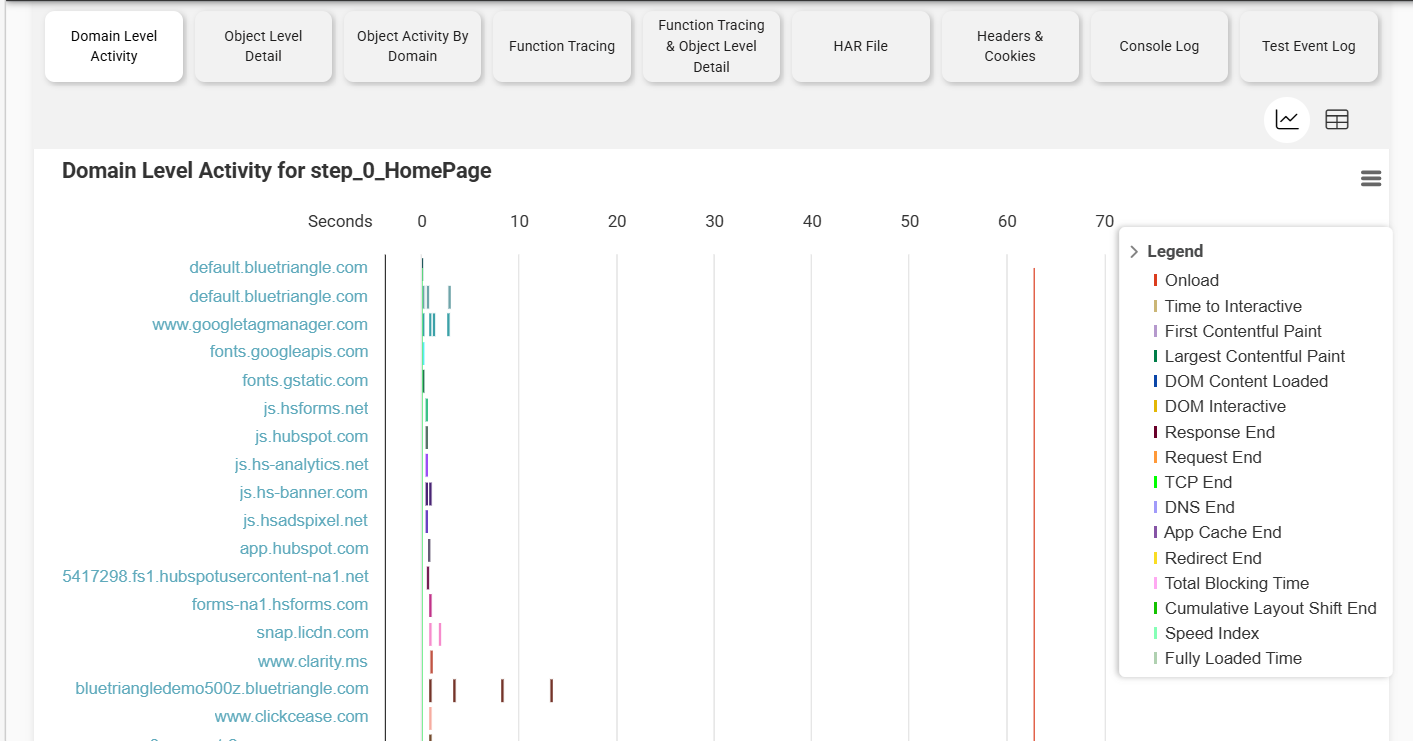
The Domain Level Activity tab shows a waterfall of the total time each domain was loading during the page view. Object Level Detail is the default view and shows the object-level waterfall for the page. Object Activity By Domain shows a bar chart of the total time each domain spent loading. Function Tracing traces function-level activity during the page load, and Function Tracing & Object Level Detail combines both of those views. The HAR File, Headers & Cookies, Console Log, and Test Event Log tabs provide additional detail for the measurement.
All views can be toggled between chart and table format and exported to CSV using the icons in the top right of the graph. Where available, you can also view the screenshot and/or filmstrip for the exact page view.
Filters
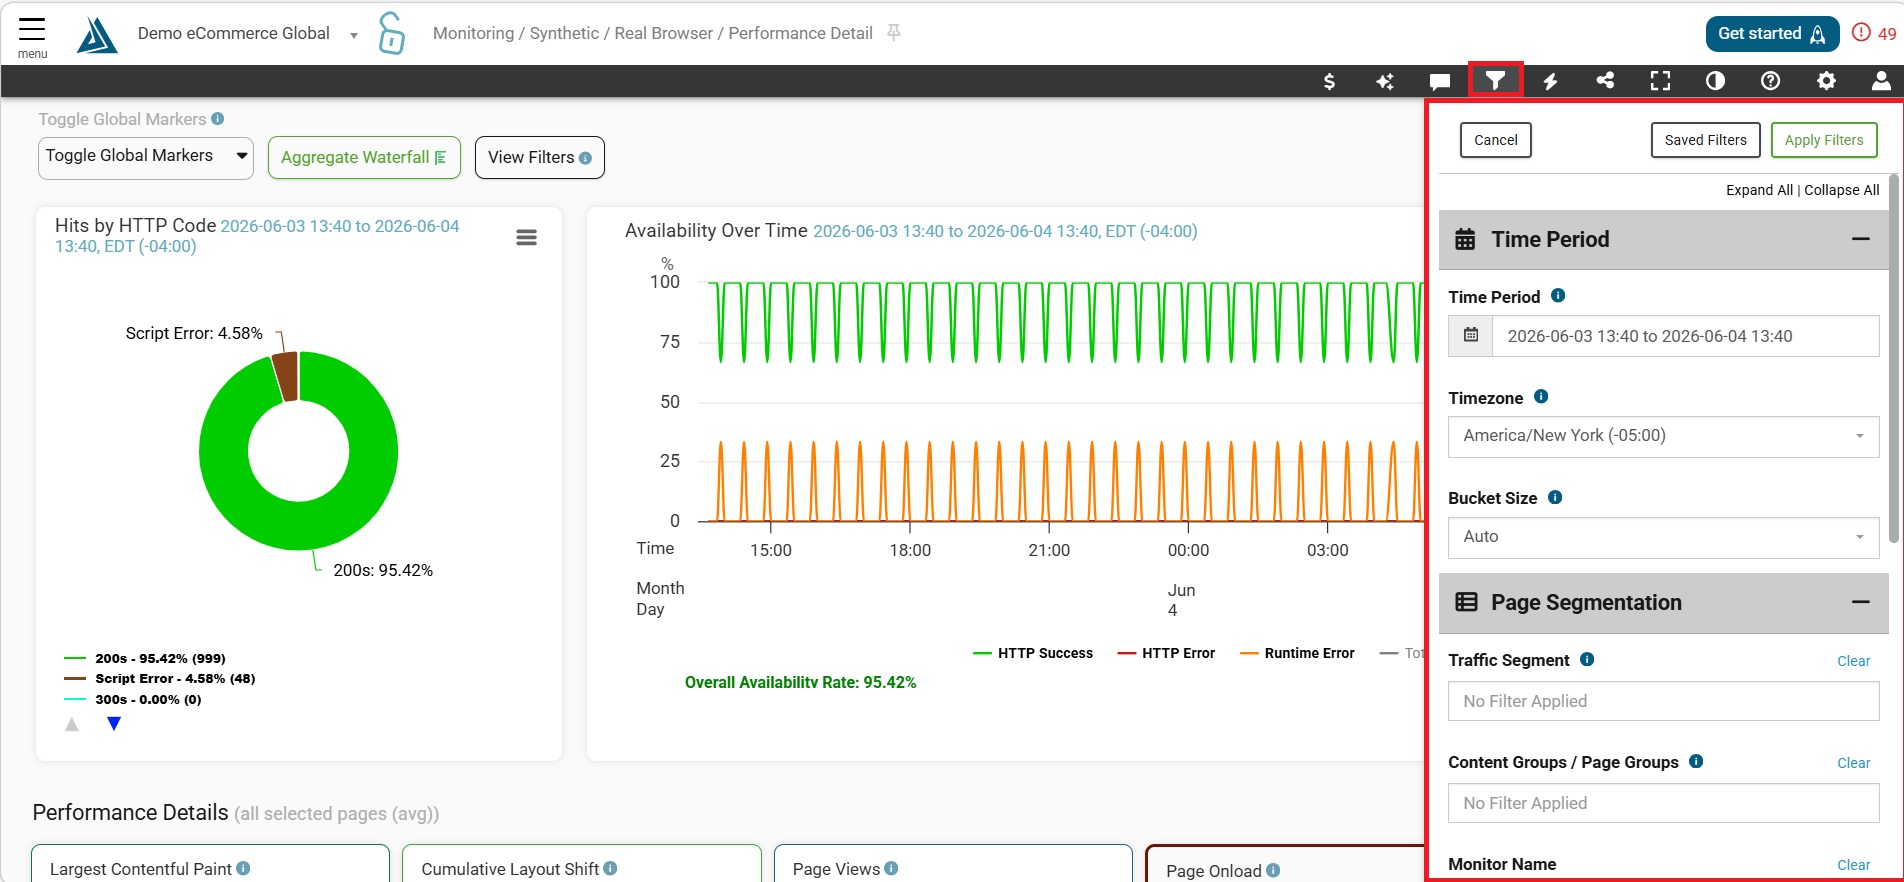
As always, you can change the time period for the page at the top, and if you want to filter down the data by script name or page name or agent location, you can do all of that and more by clicking the filter icon in the top right.