

Overview
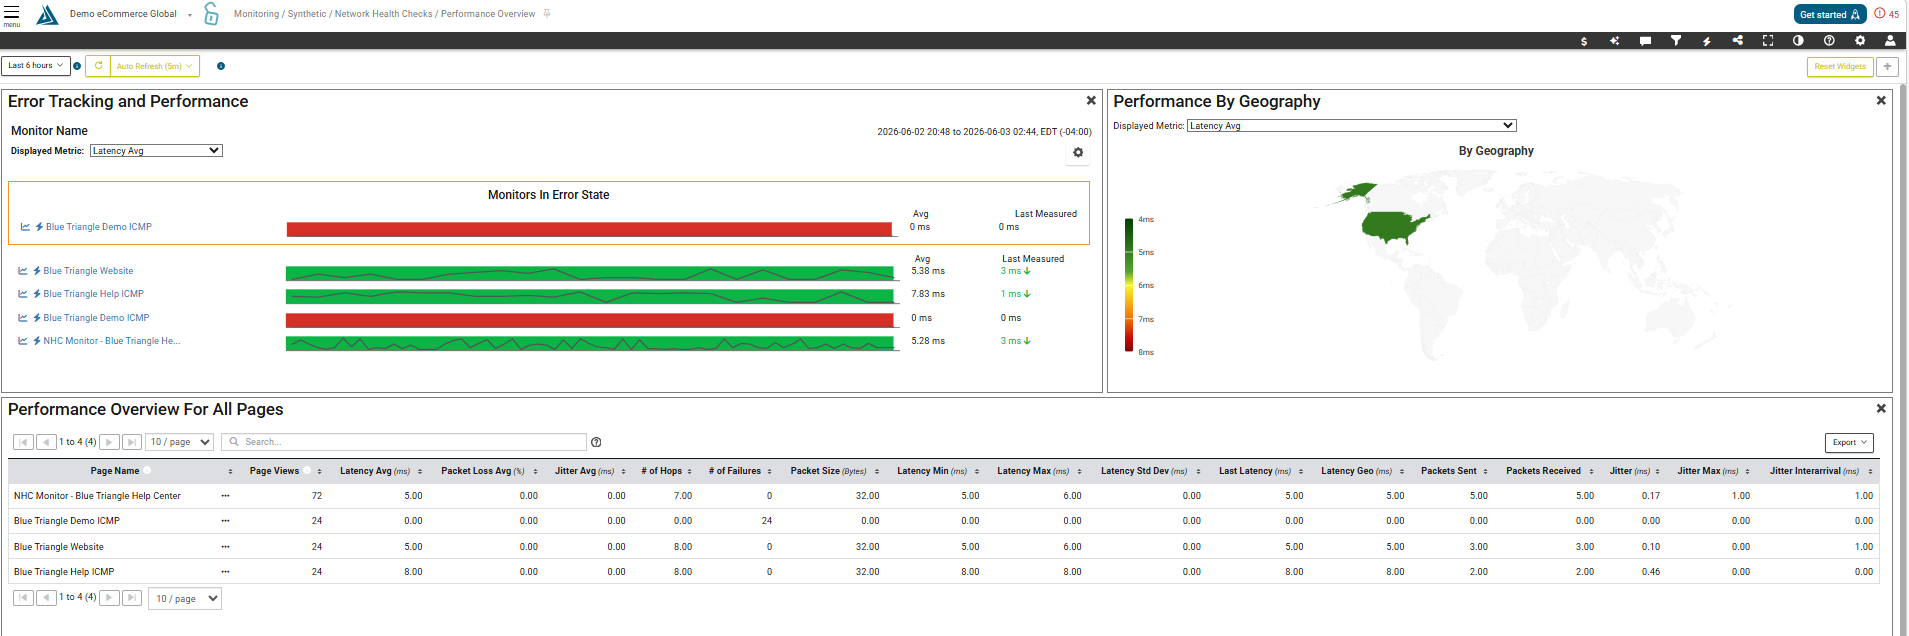
The Network Health Checks Overview page is a dashboard containing four widgets displaying an overview of performance and availability for each of your active synthetic network health checks monitors. The default lookback period for this report is the last 6 hours, however the time period can be selected in the top right corner of the page.
Where to Find the Network Health Checks Overview Page
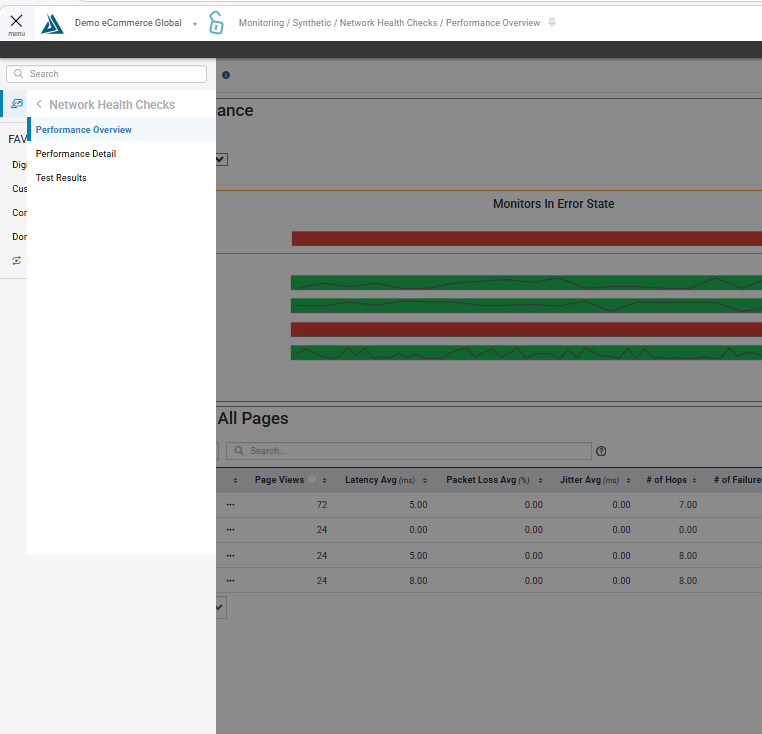
To find the Network Health Checks Overview page go to the main menu at the top left of the portal, go to Monitoring, then Synthetic, then Network Health Checks, then Performance Overview
Widgets
Error Tracking and Performance
The Error Tracking and Performance widget lists each enabled Network Health Checks for your site. The bars will appear red, green, or yellow bar depending on the the availability for each monitor over the chosen look-back period. Hovering over the bar allows you to get a quick look at performance and some additional information as to what error may be occurring.
The default metric for the Performance Trend is Onload, but you are able to select your desired displayed metric in the left side dropdown menu. Additionally, on the right, the gear icon allows you to modify the height of each row and control the space between each row to custom fit your dashboard.
Performance by Geography
The Performance Geography widget is a global heat map of performance for the selected metric. Click a region to expand the graph and view the performance for the sub-regions.
From the legend to the left we can see the darkest green is optimal performance and the darker red is the worst performance.
Performance Overview for All Pages
This widget allows you to view the performance breakdown for you selected metric(s) by Country, Agent Location, or Browser. This option is made available by clicking the tabs in the top left of this widget.
Performance Breakdown
Click the three dots to the right of Page Name and a menu will appear that will link to other areas of the Blue Triangle portal that the selected page is being used for analysis.
You are able to toggle any of the performance metrics by clicking any of the names in the top of the graph. Each metric chosen will be added as a different colored bar in the graph. Toggle the data from table or graph with the icons in the top right of each relevant widget.
Filters
To select a specific lookback period, use the selector to the top left of the page. You can also set how often you would like the dashboard refreshed. To change the chosen filters for the page, click the filter icon in the top right to view the full list of available filters options.