

Overview
The API Checks Performance Detail page enables you to analyze your synthetic base page data both at a high-level glance and all the way down to individual page measurements. At the top of the page you are able to customize the time period you would like to analyze.
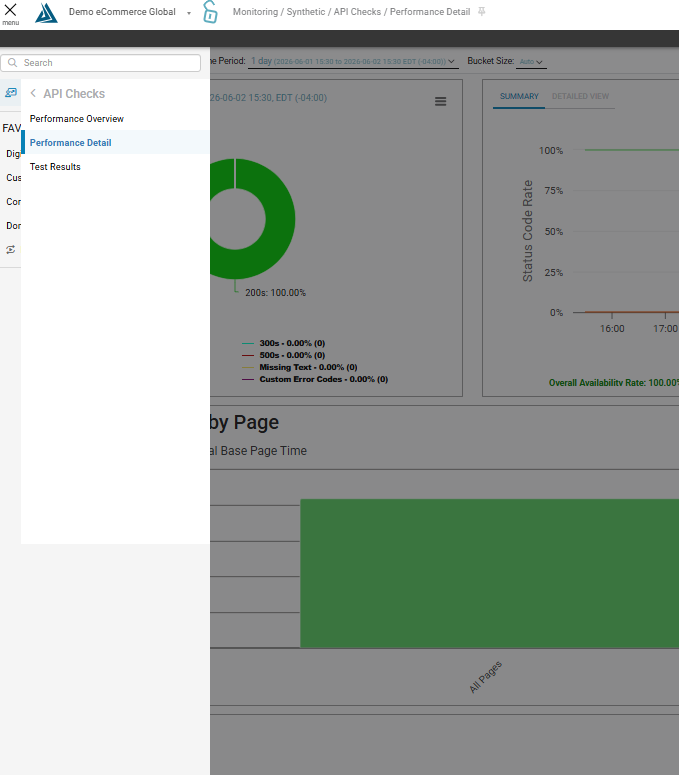
Where to Find the API Checks Performance Detail Page
To find this page click on the the main navigation on the left of the BT portal and go to Monitoring, then Synthetic, then Synthetic/ API checks, then Performance Detail
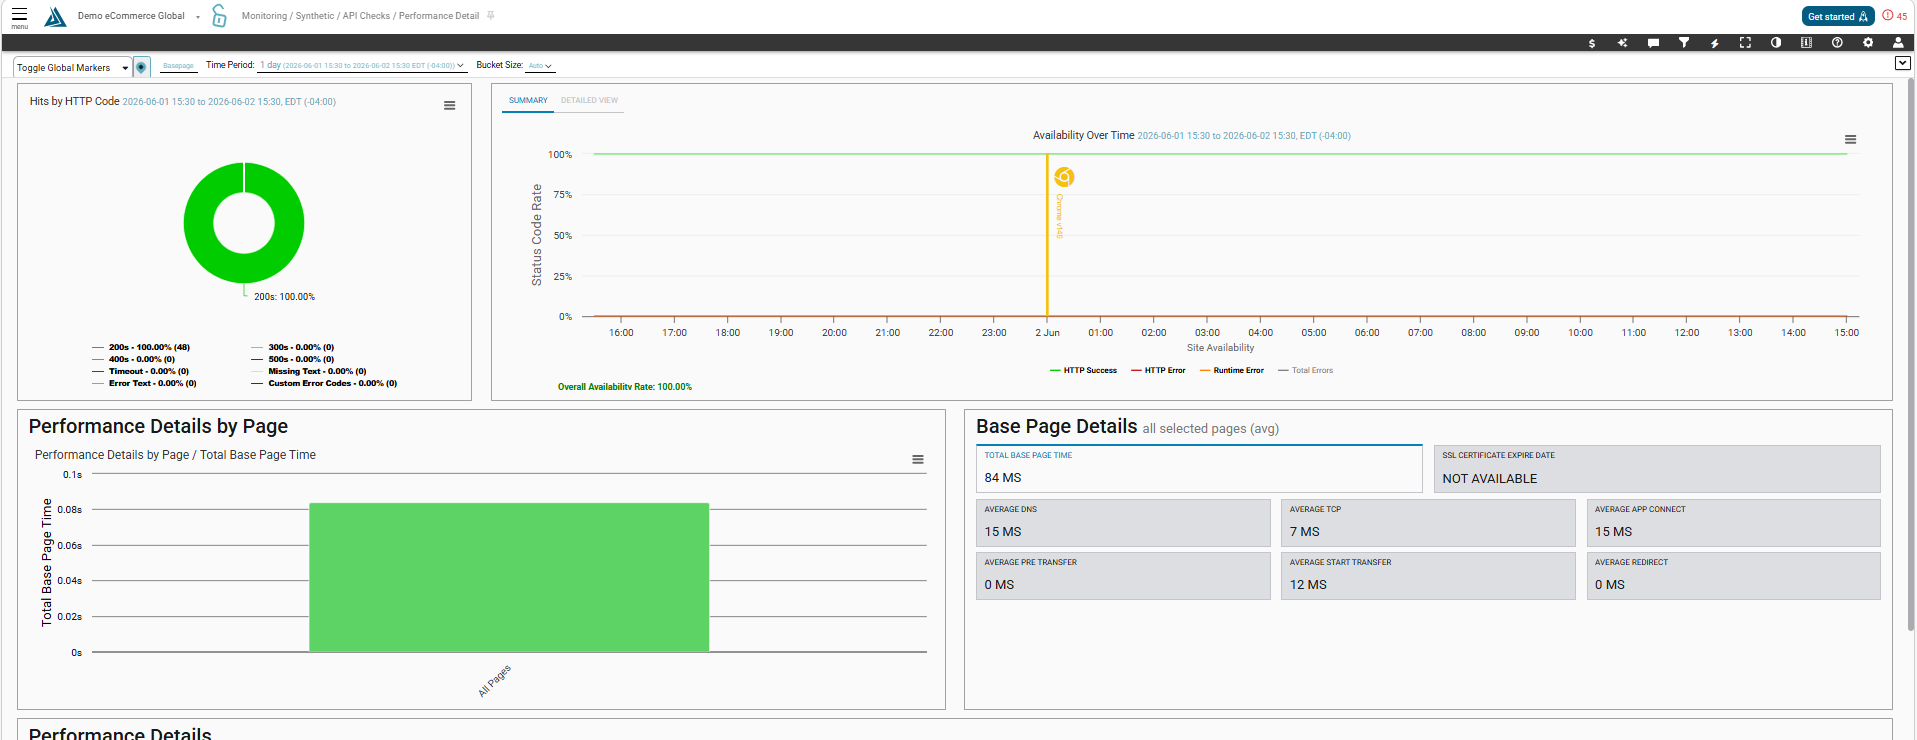
Widgets
Site Availability
The Site Availability Widget shows you a trend of errors and percent availability.
Performance Details
The bar graph and the cards here show you the high-level overview of metrics during the time period selected- in this case, the past 24 hours. You can click a card in the right to update the bar graph on the left and the graph below.
Page Views
The scatter plot shows the timings for each measurement taken.
Clicking a point on the scatterplot will load base page data.
Filters
To filter the data, click the Filter icon on the top right of the screen. This will open a menu where you can apply any number of criteria to filter on. Click Apply to reload the dashboard with the new filters. You can select a time period through the selector button in the top left of the dashboard.