

Overview
The Network Health Checks Performance Detail page enables you to analyze your synthetic network health data both at a high-level glance and all the way down to individual page measurements.
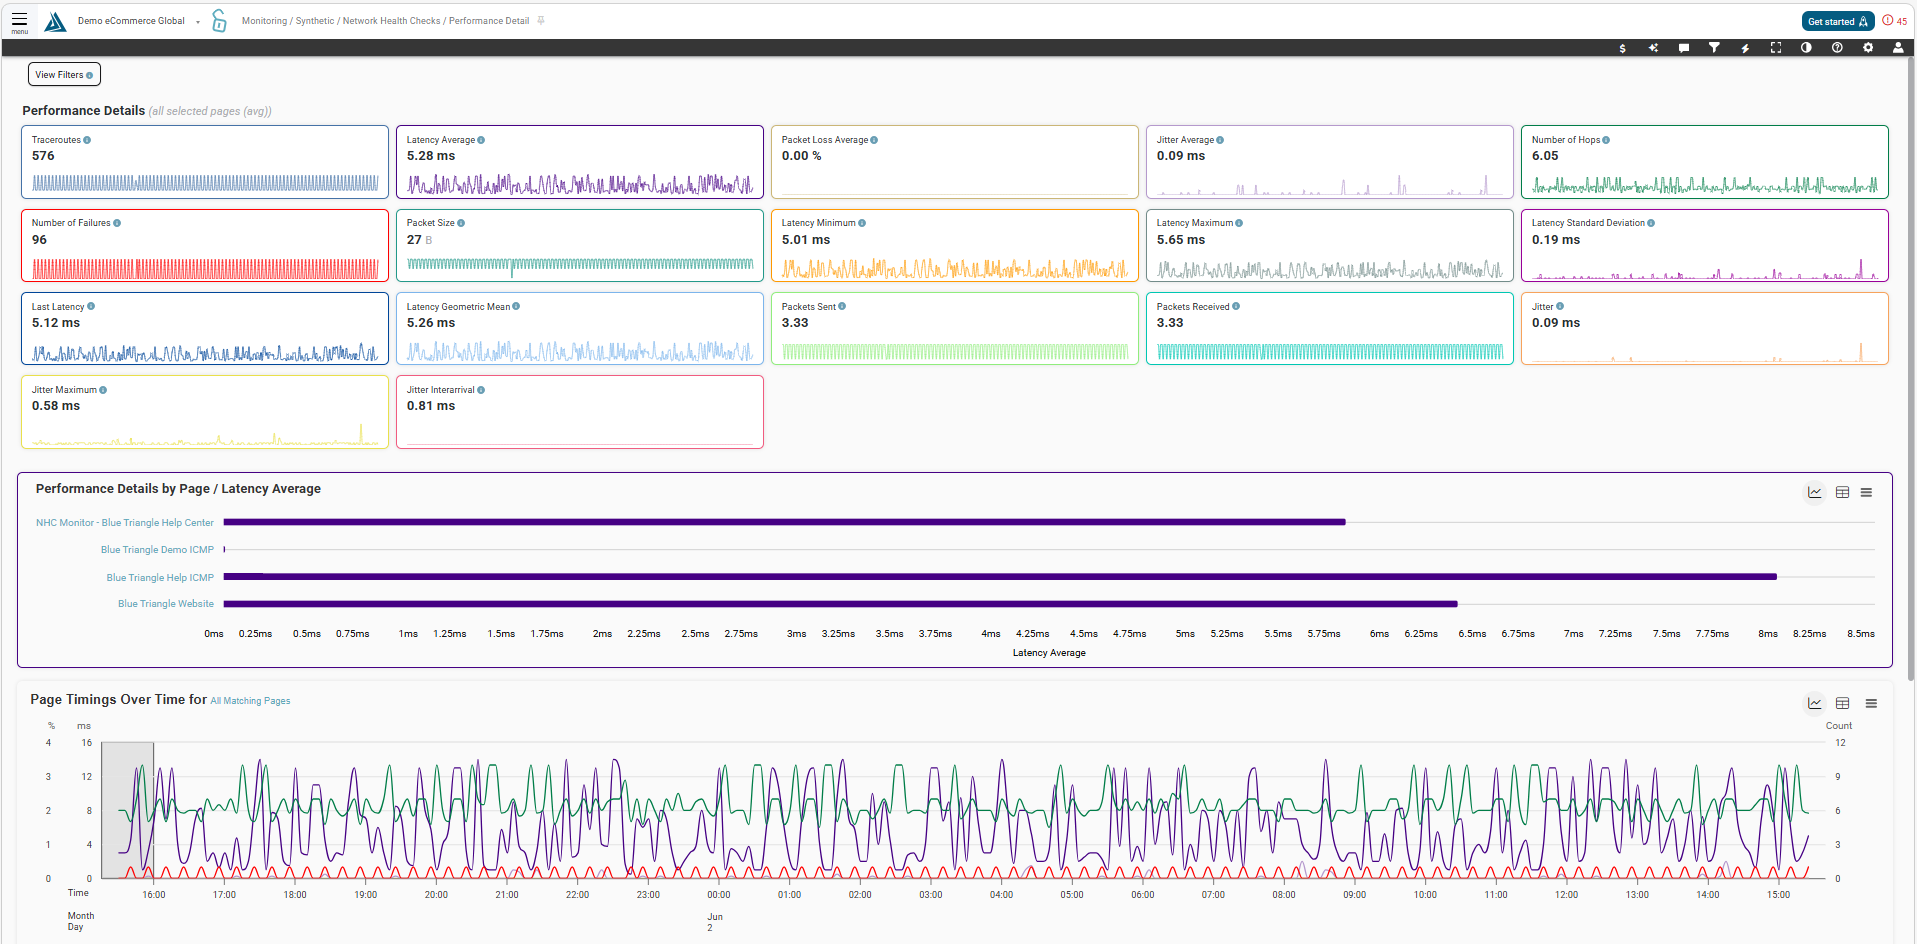
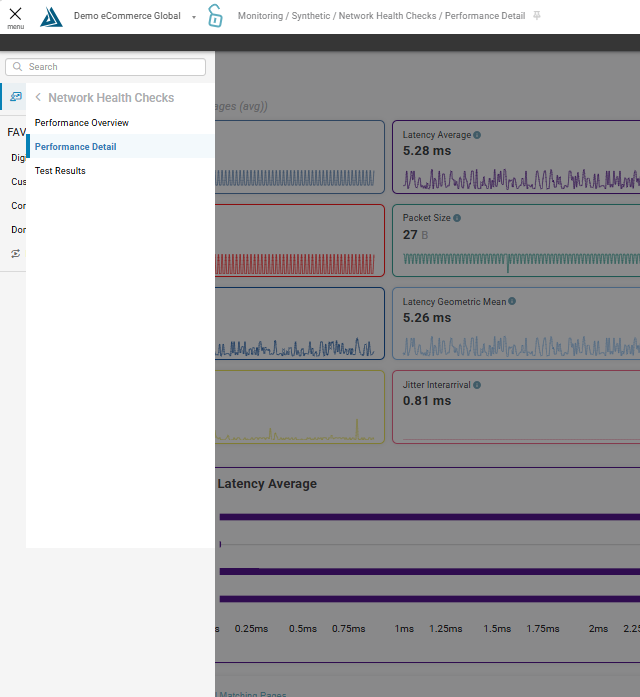
Where to Find the Network Health Checks Performance Overview Page
To find this page go to the main navigation on the left side of the portal, go to Monitoring, then Synthetic, then Network Health Checks, then Performance Detail
Widgets
Performance Details by Page
The bar graph and the cards here show you the high-level overview of metrics during the time period selected- in this case, the past 24 hours.
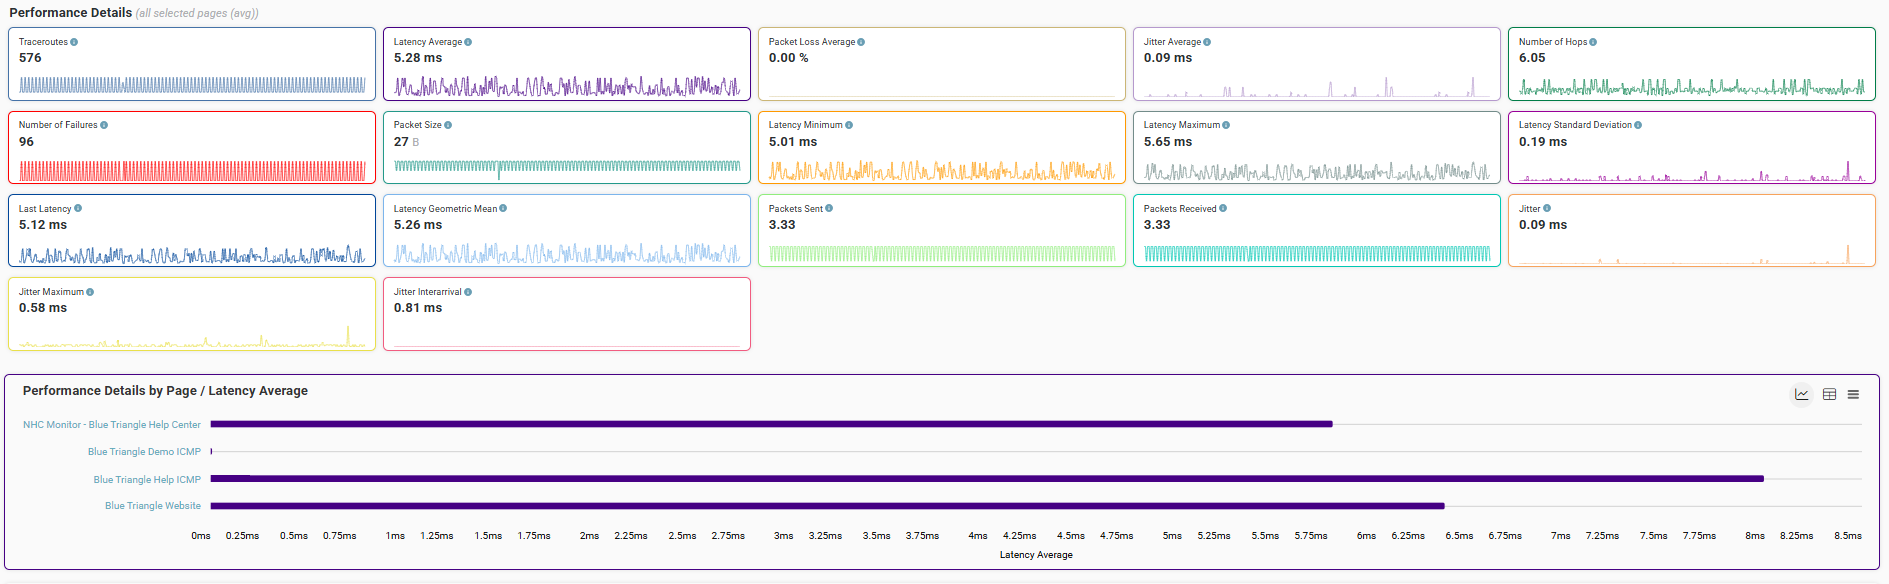
You can click a card on the right to update the bar graph.
Page Timings Over Time
Moving down the screen we see the Performance Graph. This shows all of your metrics trended across the time period.
Traceroutes
The Traceroutes scatter plot gives a quick glance of latency averages of synthetic monitors. Any traceroutes that may need to be investigated for issues with a particular step are indicated by a red square.
Selecting on a point in the Traceroutes scatterplot will load a table showing the route and latency info for each step of the route for that given point.
Filters
You can change the time period for the page at the top, and if you want to filter down the data by script name or page name or agent location, you can do all of that and more by clicking the filter icon in the top right.