

Overview
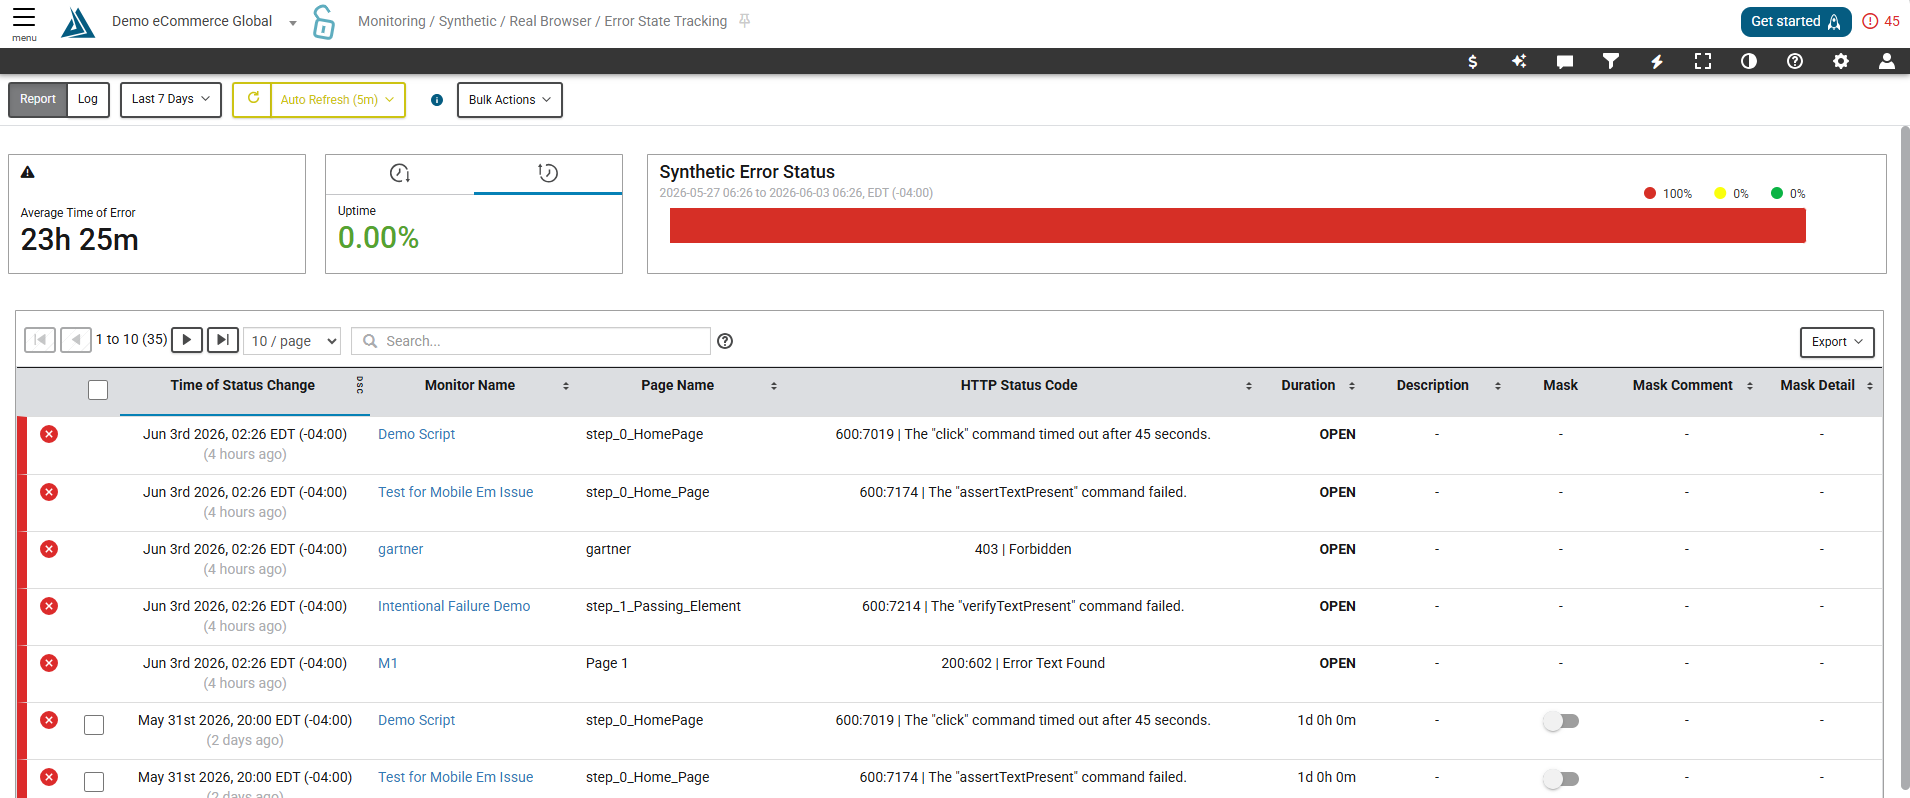
The Error State Tracking Page shows you all the errors that have occurred on your synthetic monitors, as well as other related information, such as the duration of each error.
How to Find the Error State Tracking Page
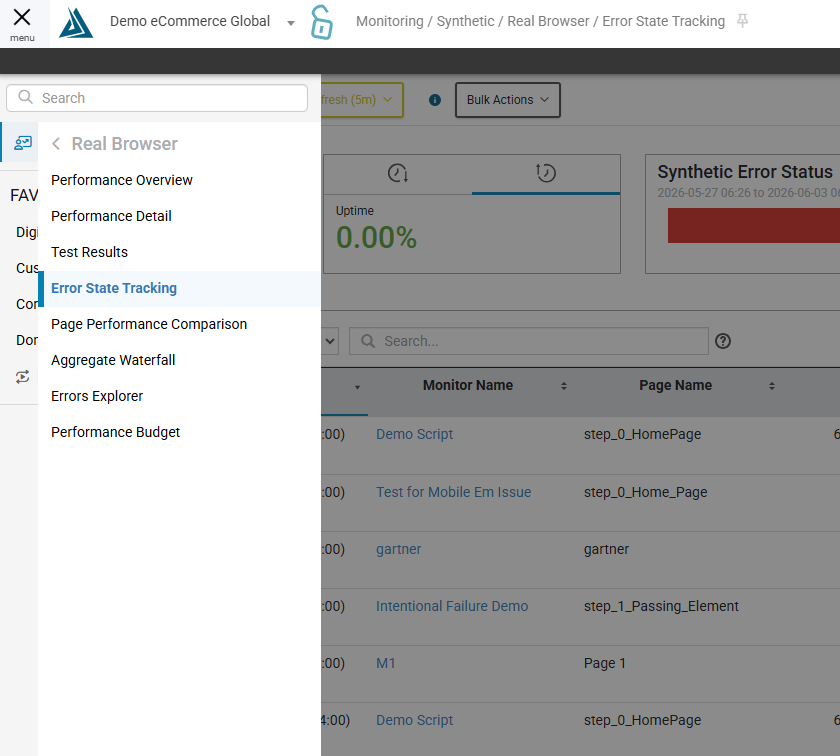
To find the Synthetic Error State Tracking Page go the main navigation on the top left of the BT portal, go to Monitoring → Synthetic → Real Browser → Error State Tracking
High Level Metrics
At the top of the page you will notice three widgets.
On the far left, you see the average time of all errors on the page.
To the right of that, you'll see the percentage of downtime. Click the clock icons at the top of this widget to toggle between viewing downtime and uptime.
On the far right, you can use the Synthetic Error Status widget to see the percentage of synthetic monitors experiencing errors in red
Please see our help center article here for information on how Availability is calculated in Blue Triangle.
Searchable Table
Moving down the page, we have a searchable table of all errors on synthetic monitors.
In this table you are able to:
-
type in the search bar to find the error you are looking for
-
see the time the error occurred, its duration, and other information here
-
click the headers at the top to sort the errors by that category
-
click the export button in the top right to see the export options and save the data for later
-
click the sliders on the far right of the table to mask individual errors from appearing in the high level metrics at the top of the page
Updating Monitors from the Error State Tracking Page
In the top left, there are several buttons you can use to personalize this page.
To update monitors in error state directly from the Error State Tracking Page, click Log to see the errors in the Log format.
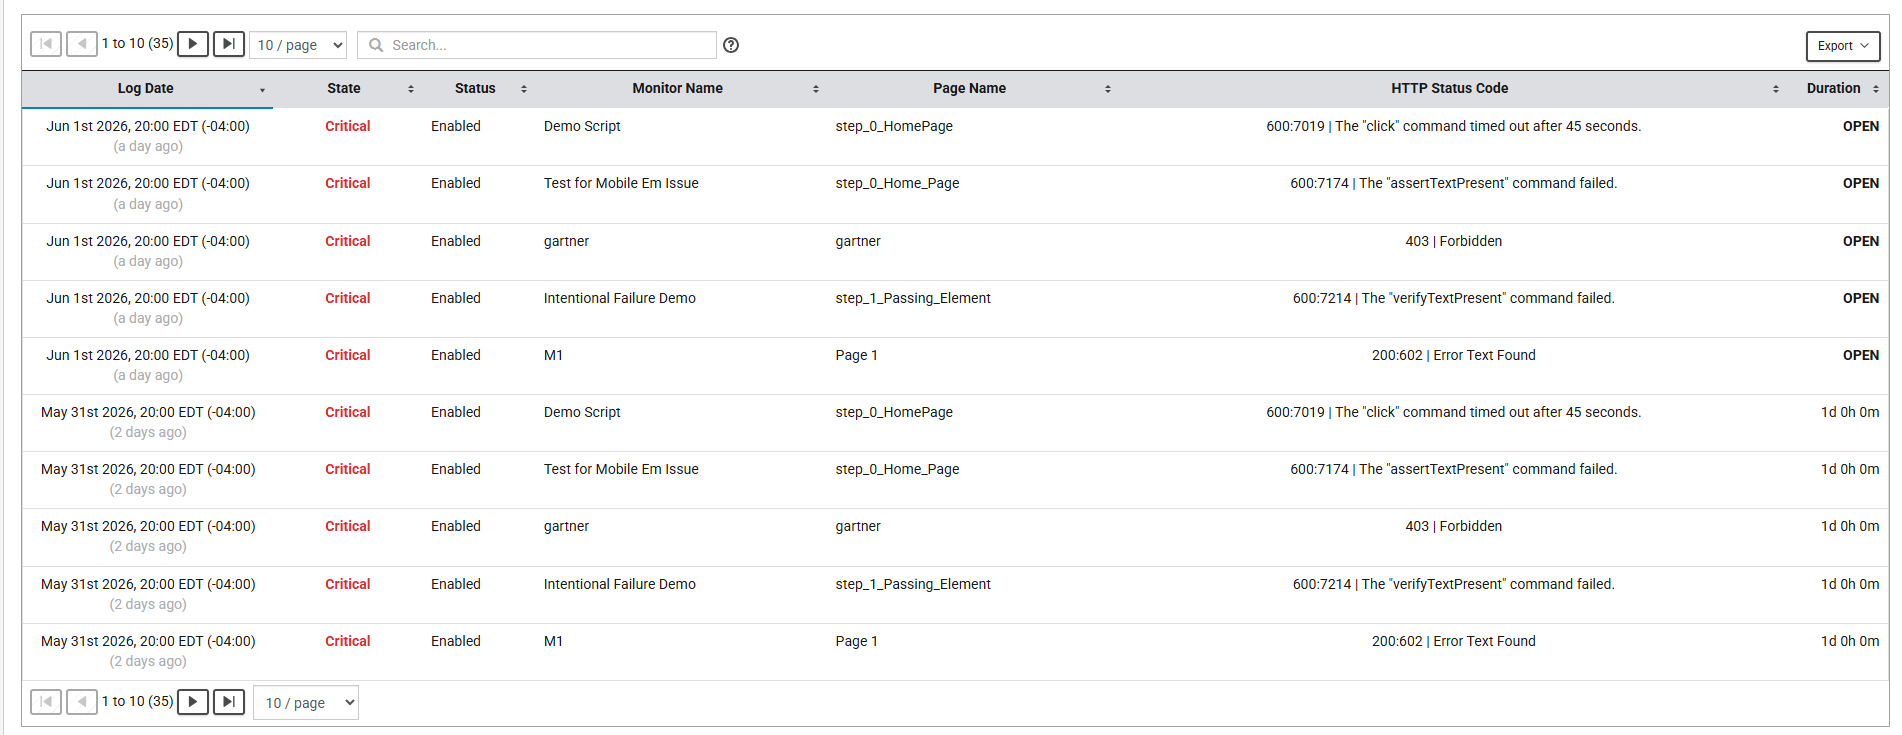
This view of the errors can be exported as well by clicking the export button in the top right.
Click the edit icon to the right of the log date to take a look at specific monitors from this list and update them. (Delete ?)