

Overview
The Synthetic Performance Comparison Page allows for comparison of different metrics between several different pages.
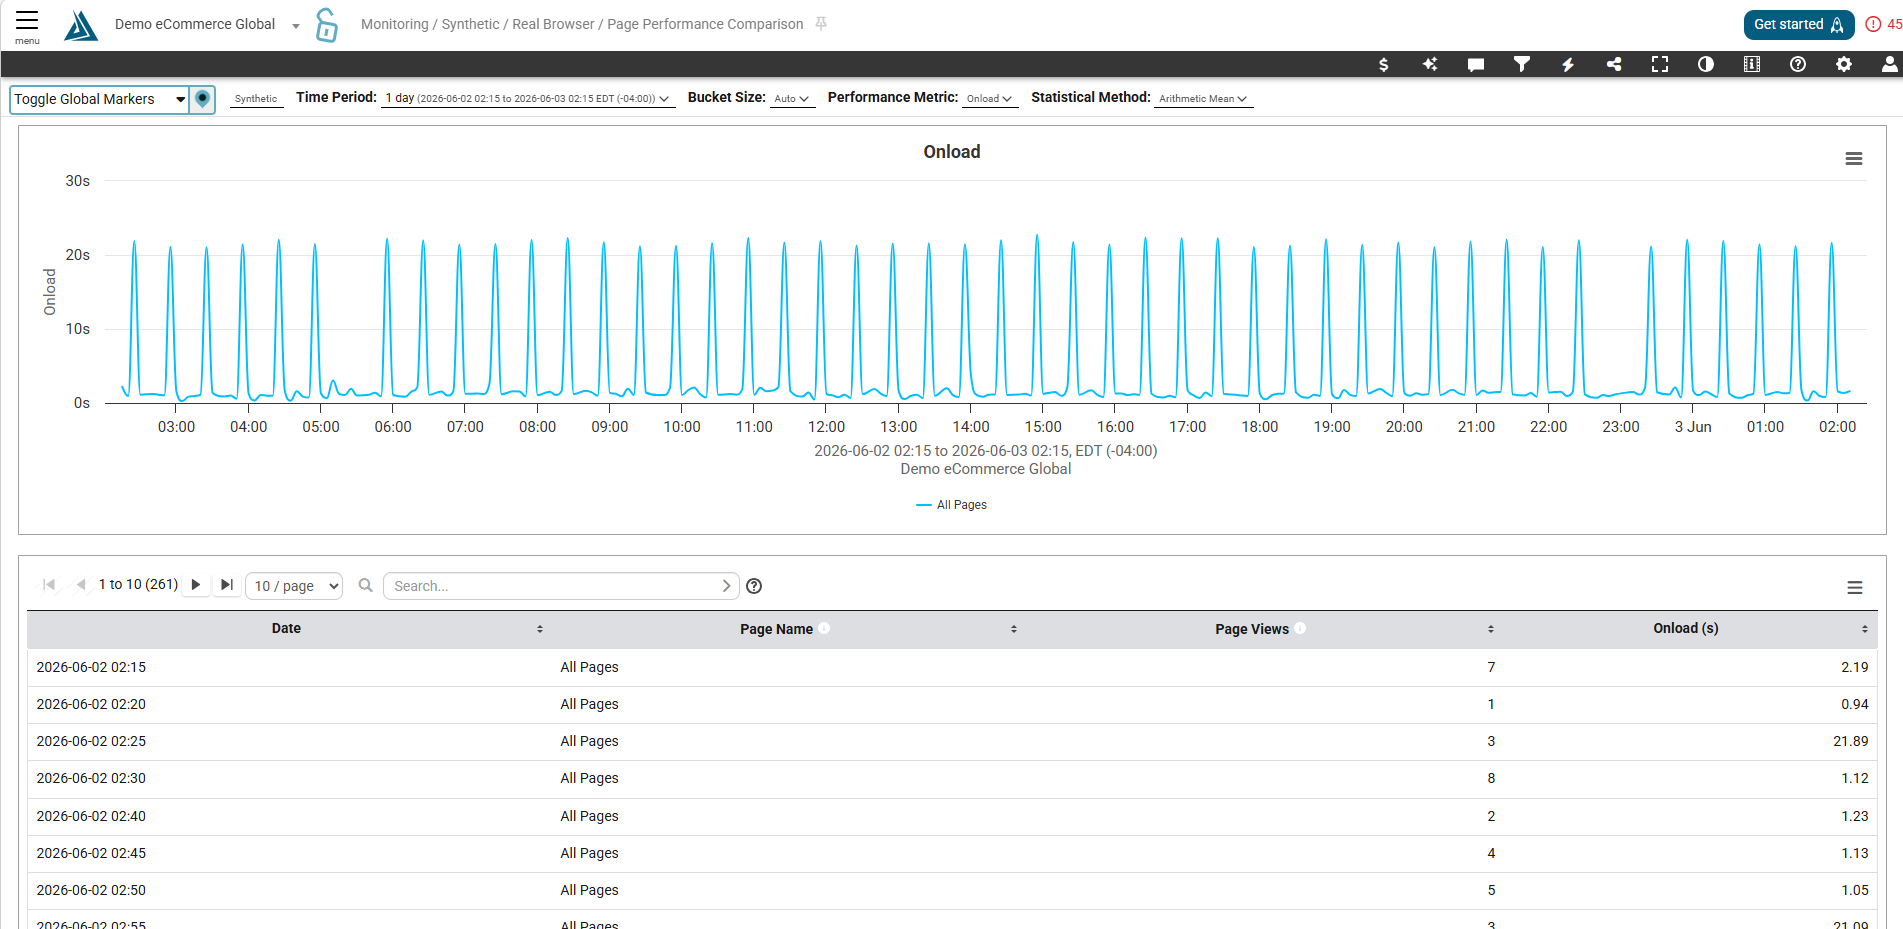
Note: This page has the same features and functionality as the 'Page Performance Comparison' page in Real User Monitoring.
How to Find the Synthetic Page Performance Comparison Page
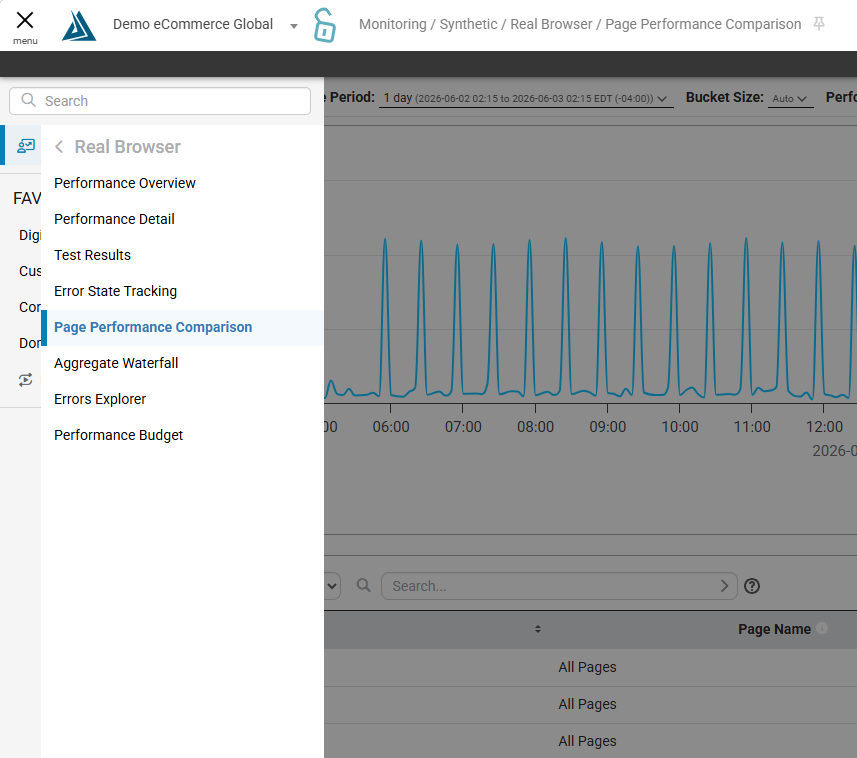
To find this page go to the main navigation on the BT portal and click on Monitoring → Synthetic → Real Browser → Page Performance Comparison
How to Use the Synthetic Page Performance Comparison Page
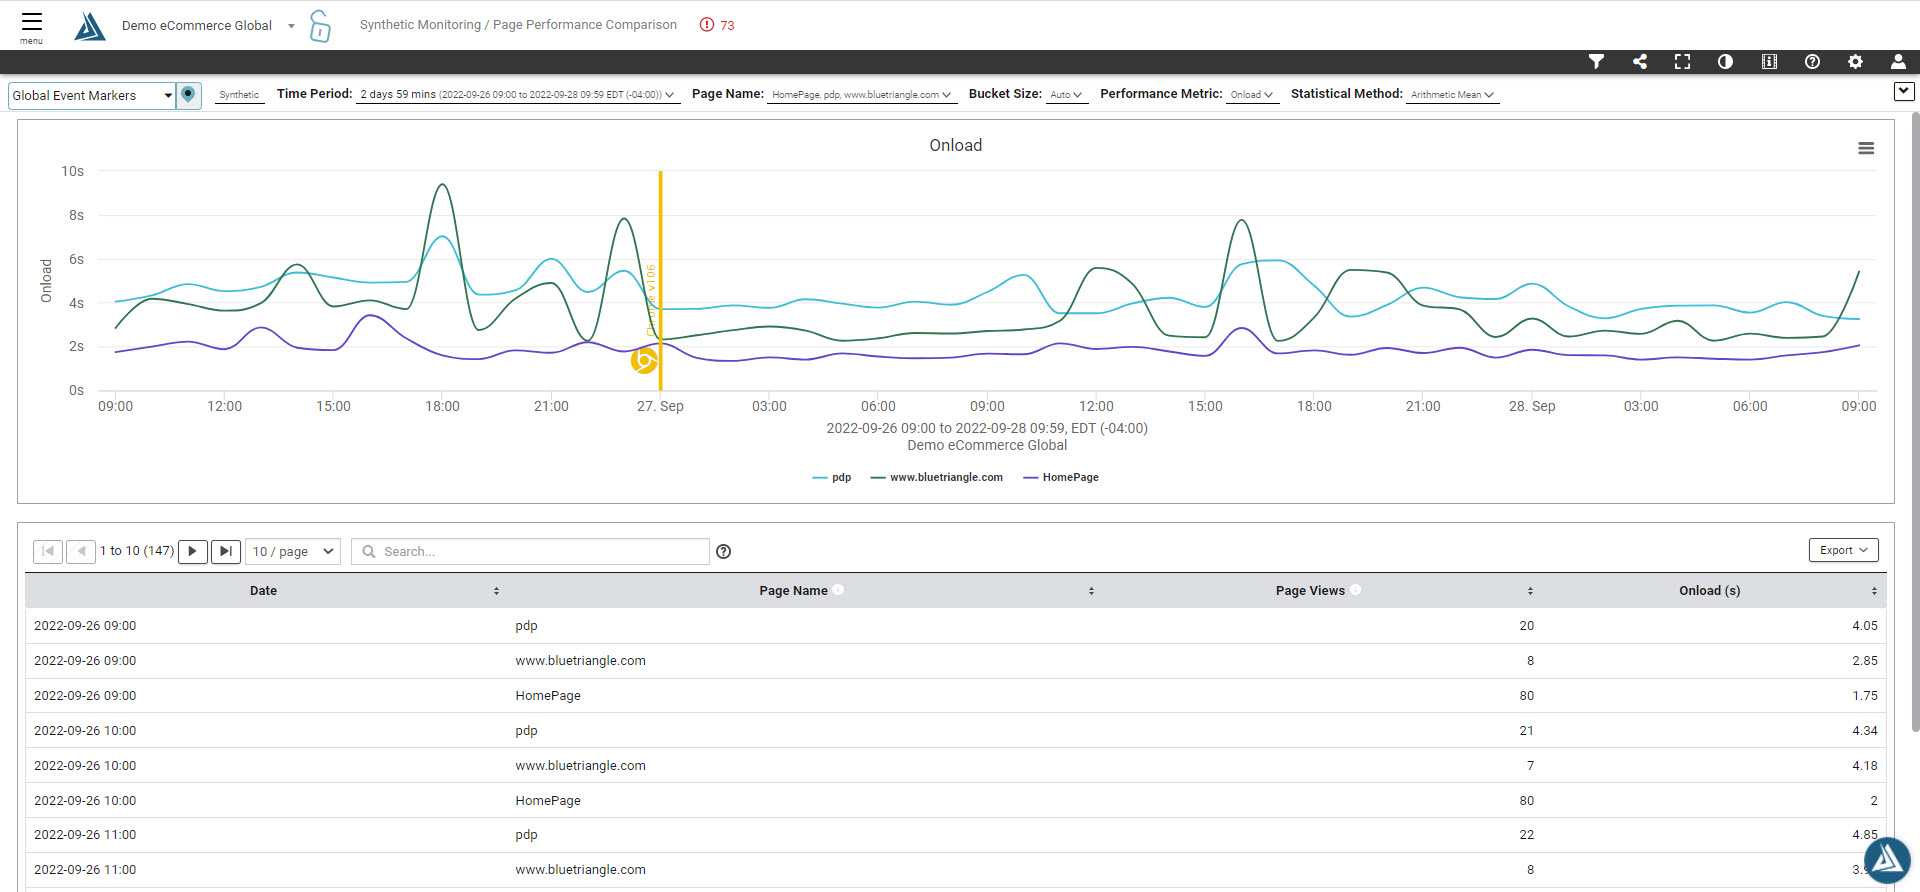
When the page is first opened it will display the Onload average for all pages within the chosen site. Hover over a section of the graph for more detail on the data points, the same data is shown below in the table.
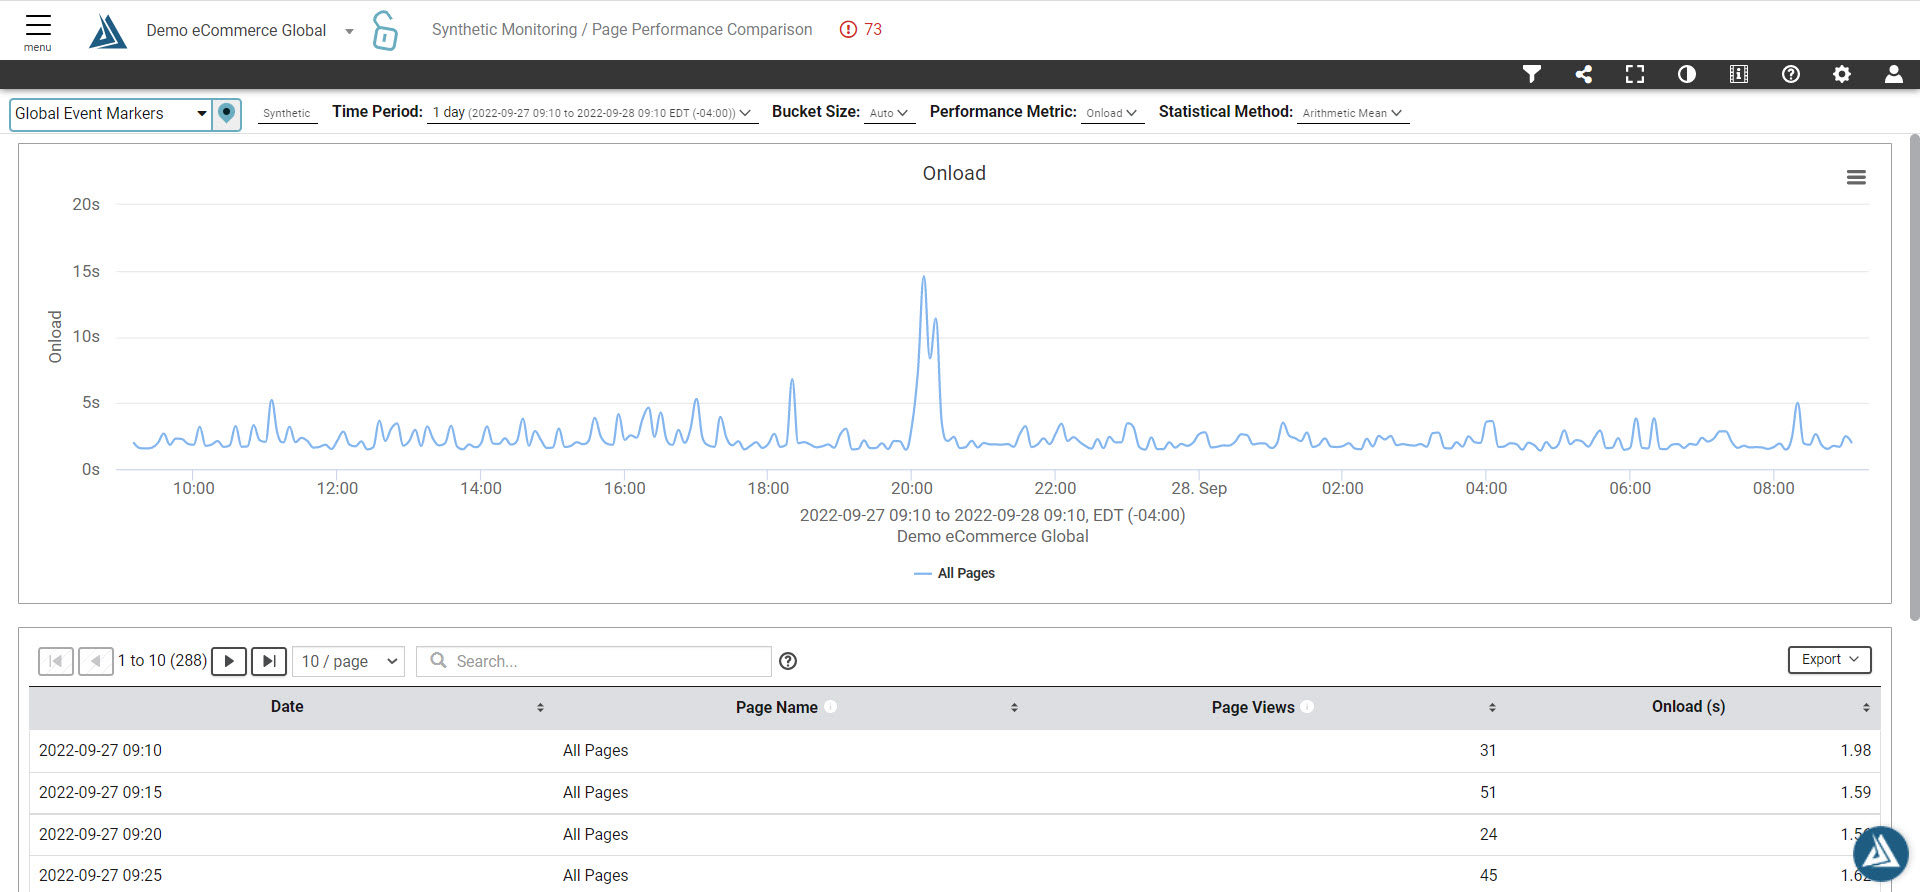
When the page is first opened it will display the Onload average for all pages within the chosen site. Hover over a section of the graph for more detail on the data points, the same data is shown below in the table.
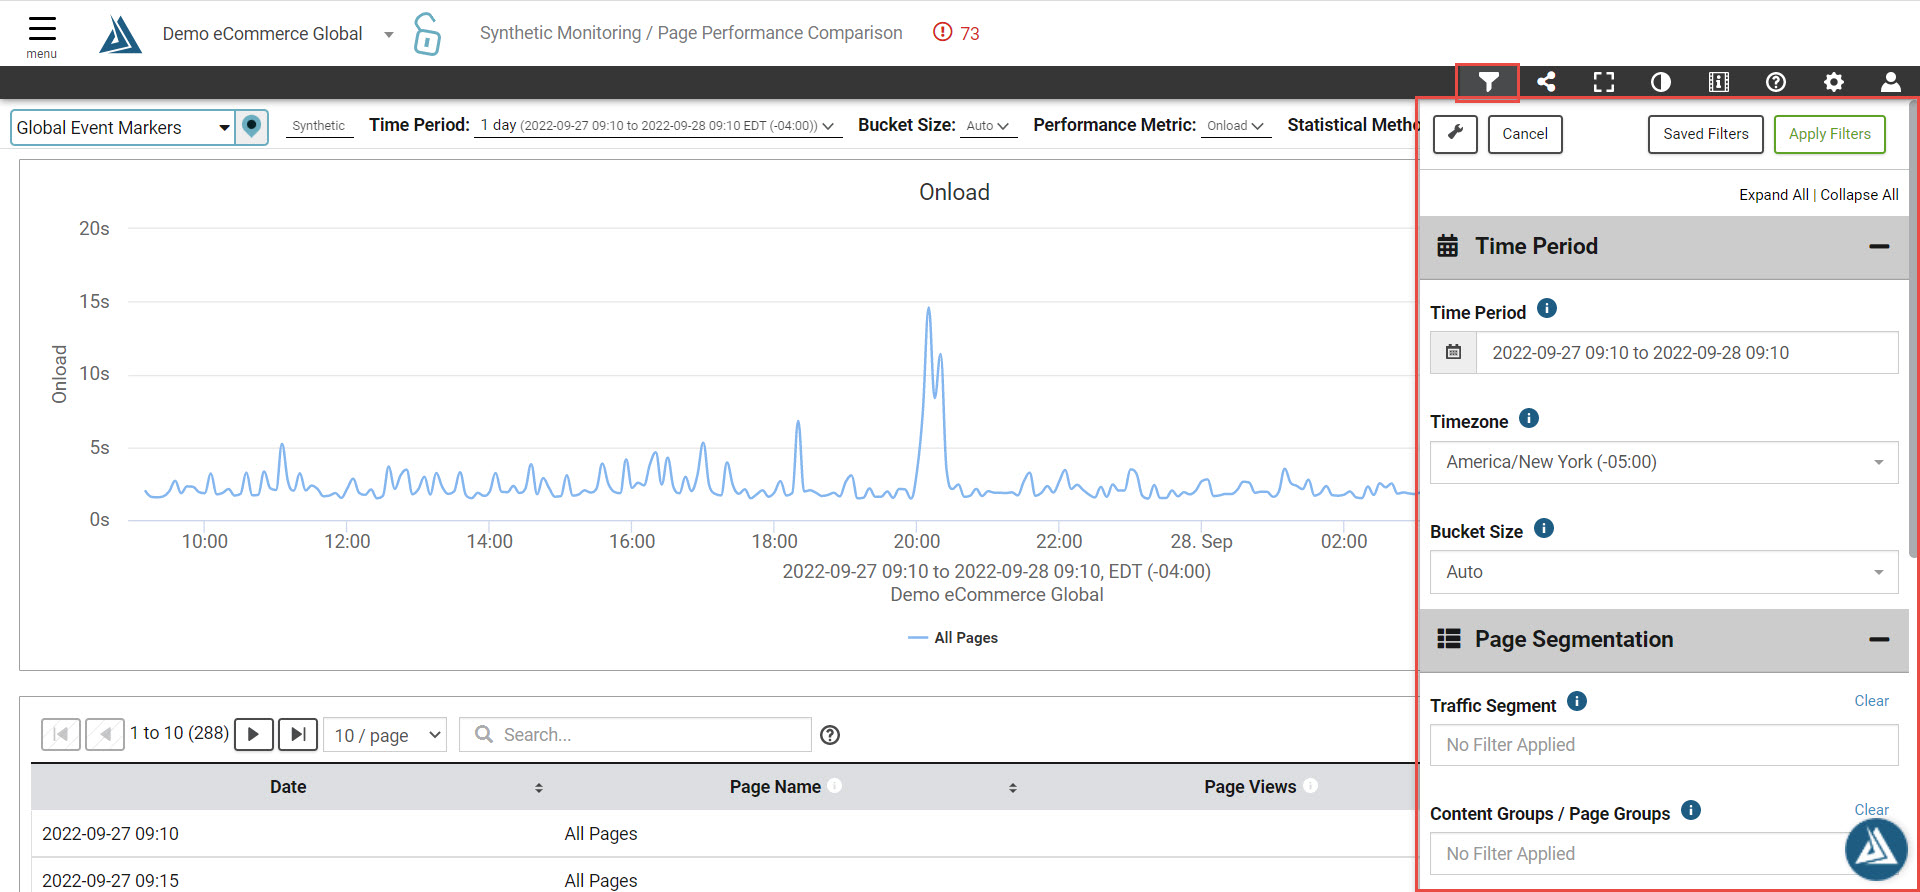
Click Apply when you finish configuring the filters you wish to use. The graph will load with it's corresponding table, and you can toggle Global Event Markers on and off at the top right of the page.
To export the data, click the Export button at the top right of the table.