

Overview
Network Health Checks are configurable synthetic monitors that can run with Internet Control Message Protocol (ICMP), Transmission Control Protocol (TCP), User Datagram Protocol (UDP), or Stream Control Transmission Protocol (SCTP). These protocols determine how data is communicated and what kind of packets are sent. This offers engineers flexibility in the types of tests sent through the network. You can configure additional monitor options such as max number of hops, domain/host to measure, report cycles, and error state tracking.
Example Uses
-
Ability to see aggregate traceroutes (MTR) between public or private Blue Triangle synthetic nodes to destinations on the internet or on private networks with private synthetic agents.
-
Ability to configure MTR between public or private Blue Triangle synthetic nodes to destinations on the internet (or on private networks with private synthetic agents).
-
Ability to see the health of your organization's network globally, at a glance
-
Network engineers will want to be able to see data related to these measurements along with other custom widgets in the dashboard module for real time monitoring
-
Someone responsible for multiple data centers in multiple geographies and backbone internet providers will need to understand the network availability and health to and from each of the data centers for key network performance metrics
-
Someone responsible for multiple data centers will need to be able to configure measurements that utilize ping in order to check network availability and health to/from each of the data centers
-
Ability to see how all synthetic measurements are performing simultaneously
-
Dev/Ops will want to be able to see data related to these measurements along with other custom widgets in the dashboards module for real time monitoring
Network Health Check Monitors
How Monitoring Works
-
Default Reporting:
-
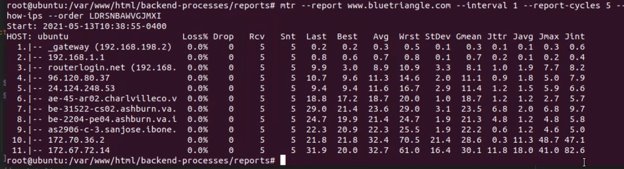
Last Hop will be standard for reporting in aggregated data
-
The last hop in MTR reports on the total time between synthetic monitor and the host
-
Labeled "11." in above image
-
-
Average Latency is most important metric, and the default for things like Error Tracking
-
Detail about all hops will be found in Network Health Checks (similar to Performance Detail for Single Page / Multi-Step Synthetic Monitors)
Understanding Terms
-
Hop – the transfer of data between two network nodes
-
Ping – the measurement of a hop
-
Latency – the round trip time between two network nodes
-
Packet – data sent between network nodes
-
Jitter – variation in the delay between packets sent in hops
-
ICMP = Internet Control Message Protocol
-
TCP = Transmission Control Protocol
-
UDP = User Datagram Protocol
-
SCTP = Streaming Control Transmission Protocol
|
ICMP |
TCP |
UDP |
SCTP |
|---|---|---|---|
|
Used for network testing |
Used for web browsing |
Used for pro gaming |
Used by telecom |
|
Commonly supported |
Commonly supported |
Commonly supported |
Not commonly supported |
|
Connectionless |
Creates connection |
Connectionless |
Creates association |
|
Communication both ways |
Communication both ways |
Communication one way |
Communication both ways |
|
No data order |
Data in order |
Data out of order |
Data out of order |
|
Known for echo requests |
Known for reliability |
Known for sending data quickly |
Known for multihoming (multiple IPs) |
Network Health Check Configuration
General
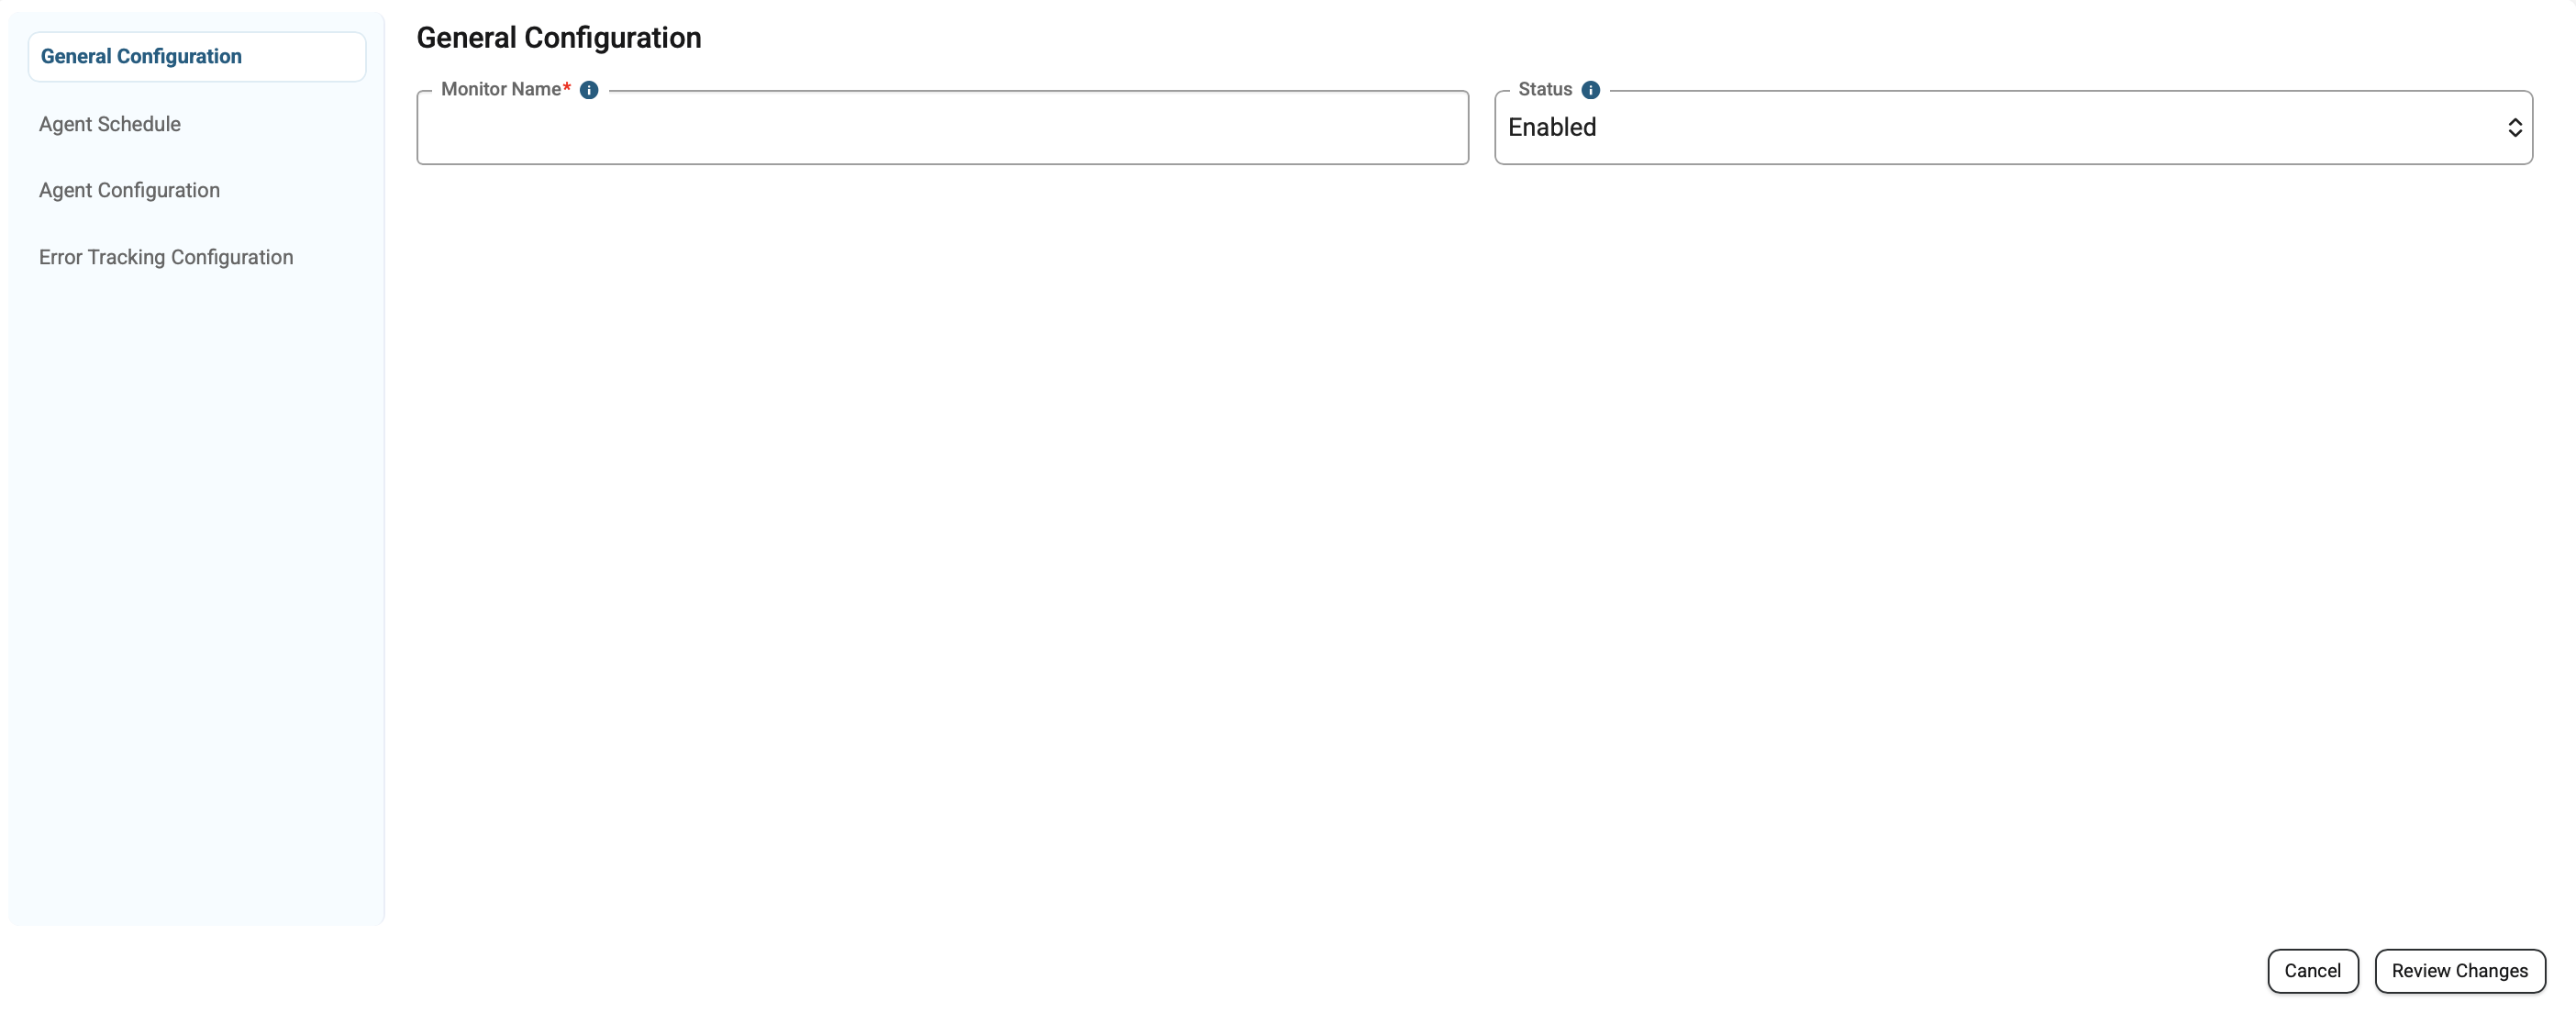
Choose a name for your monitor, and you can select it's status.
Agent Schedules
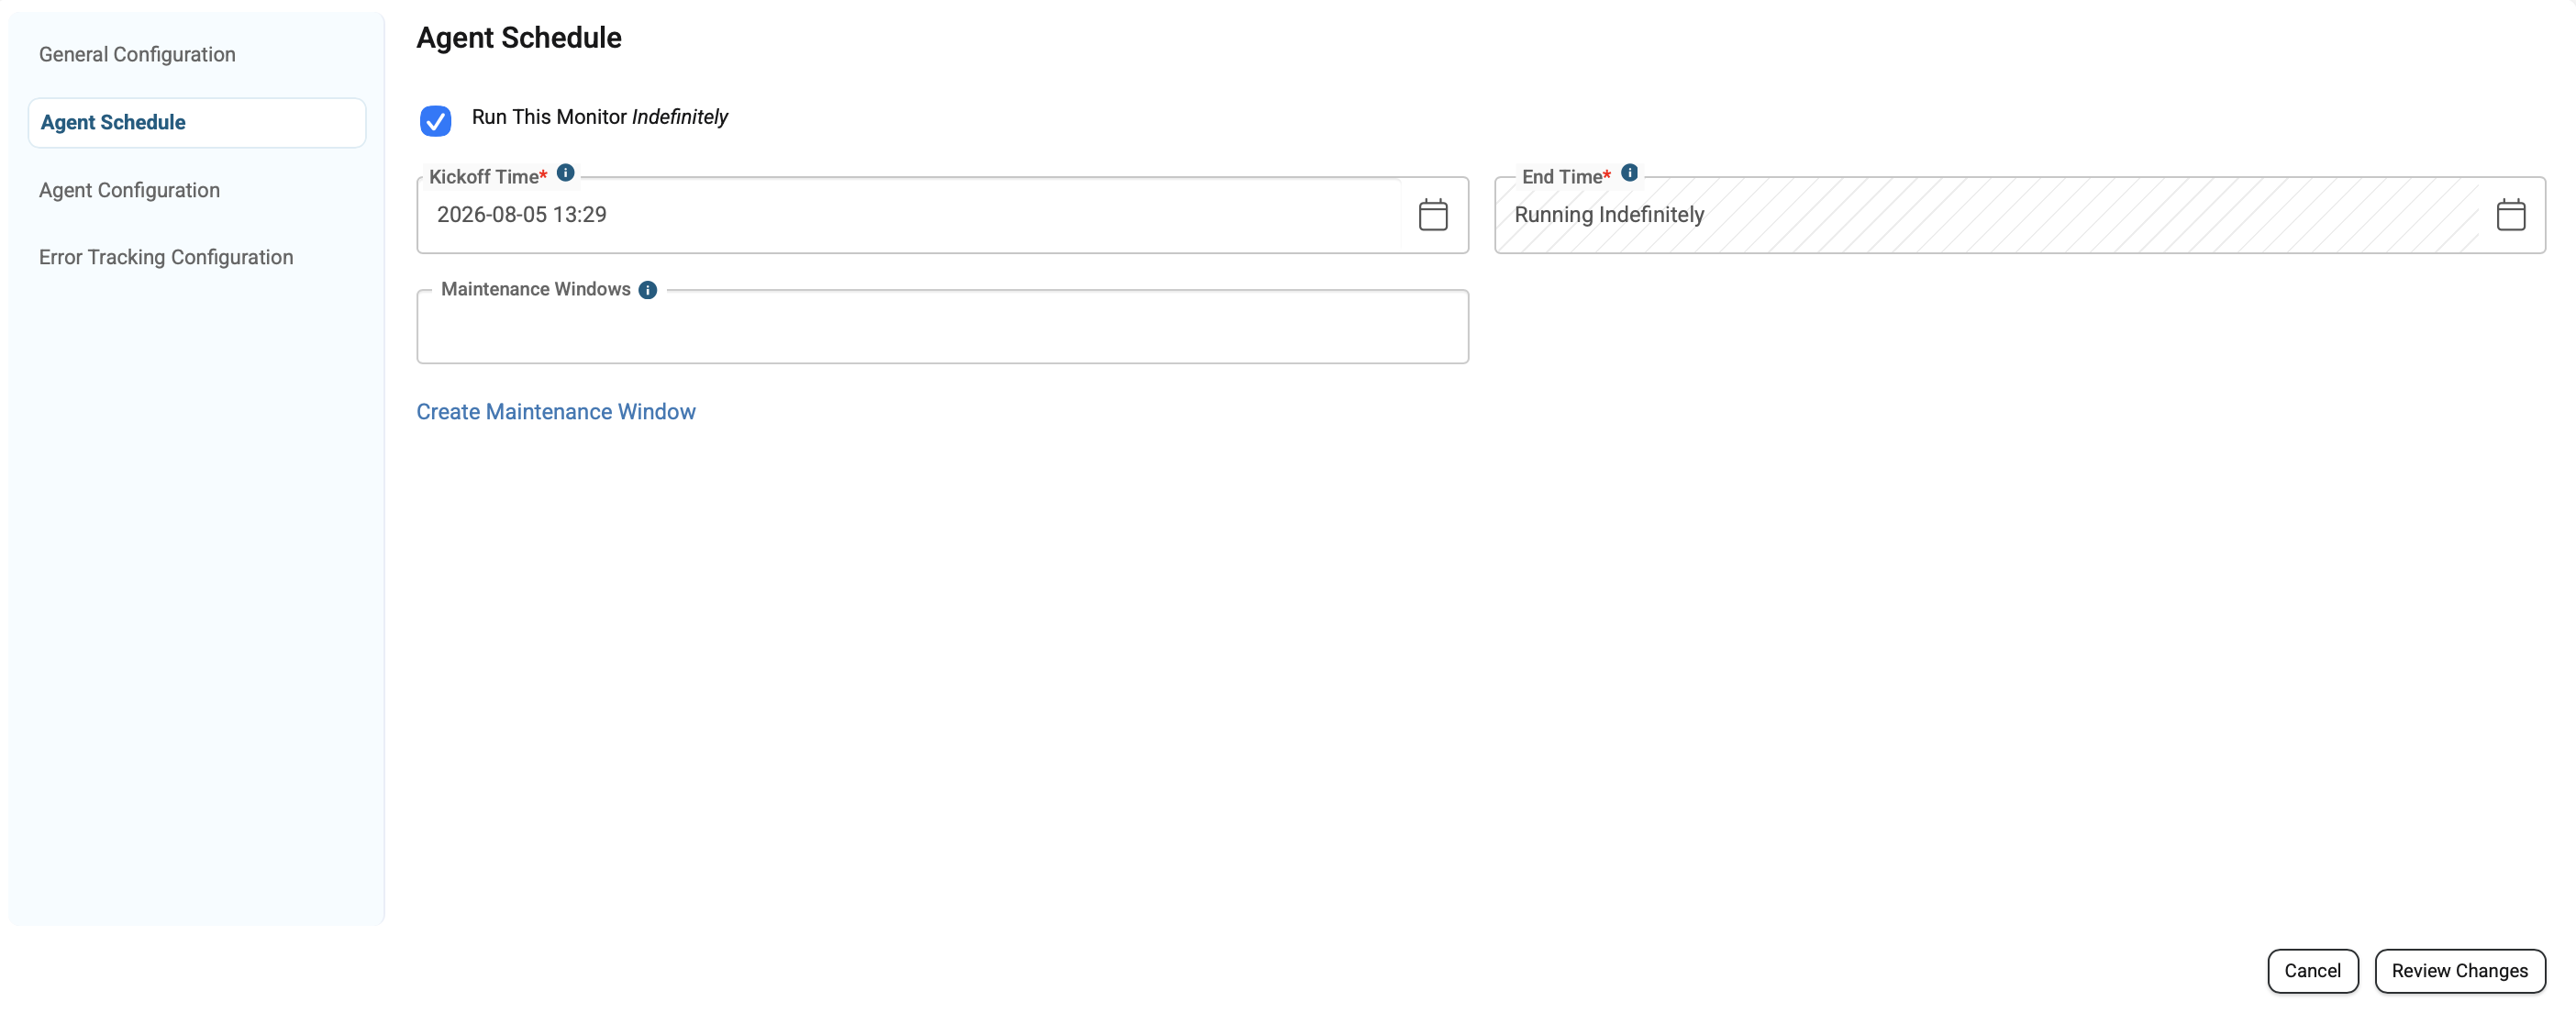
Select the timing for your monitor and set any maintenance windows if desired.
Agent Configuration
-
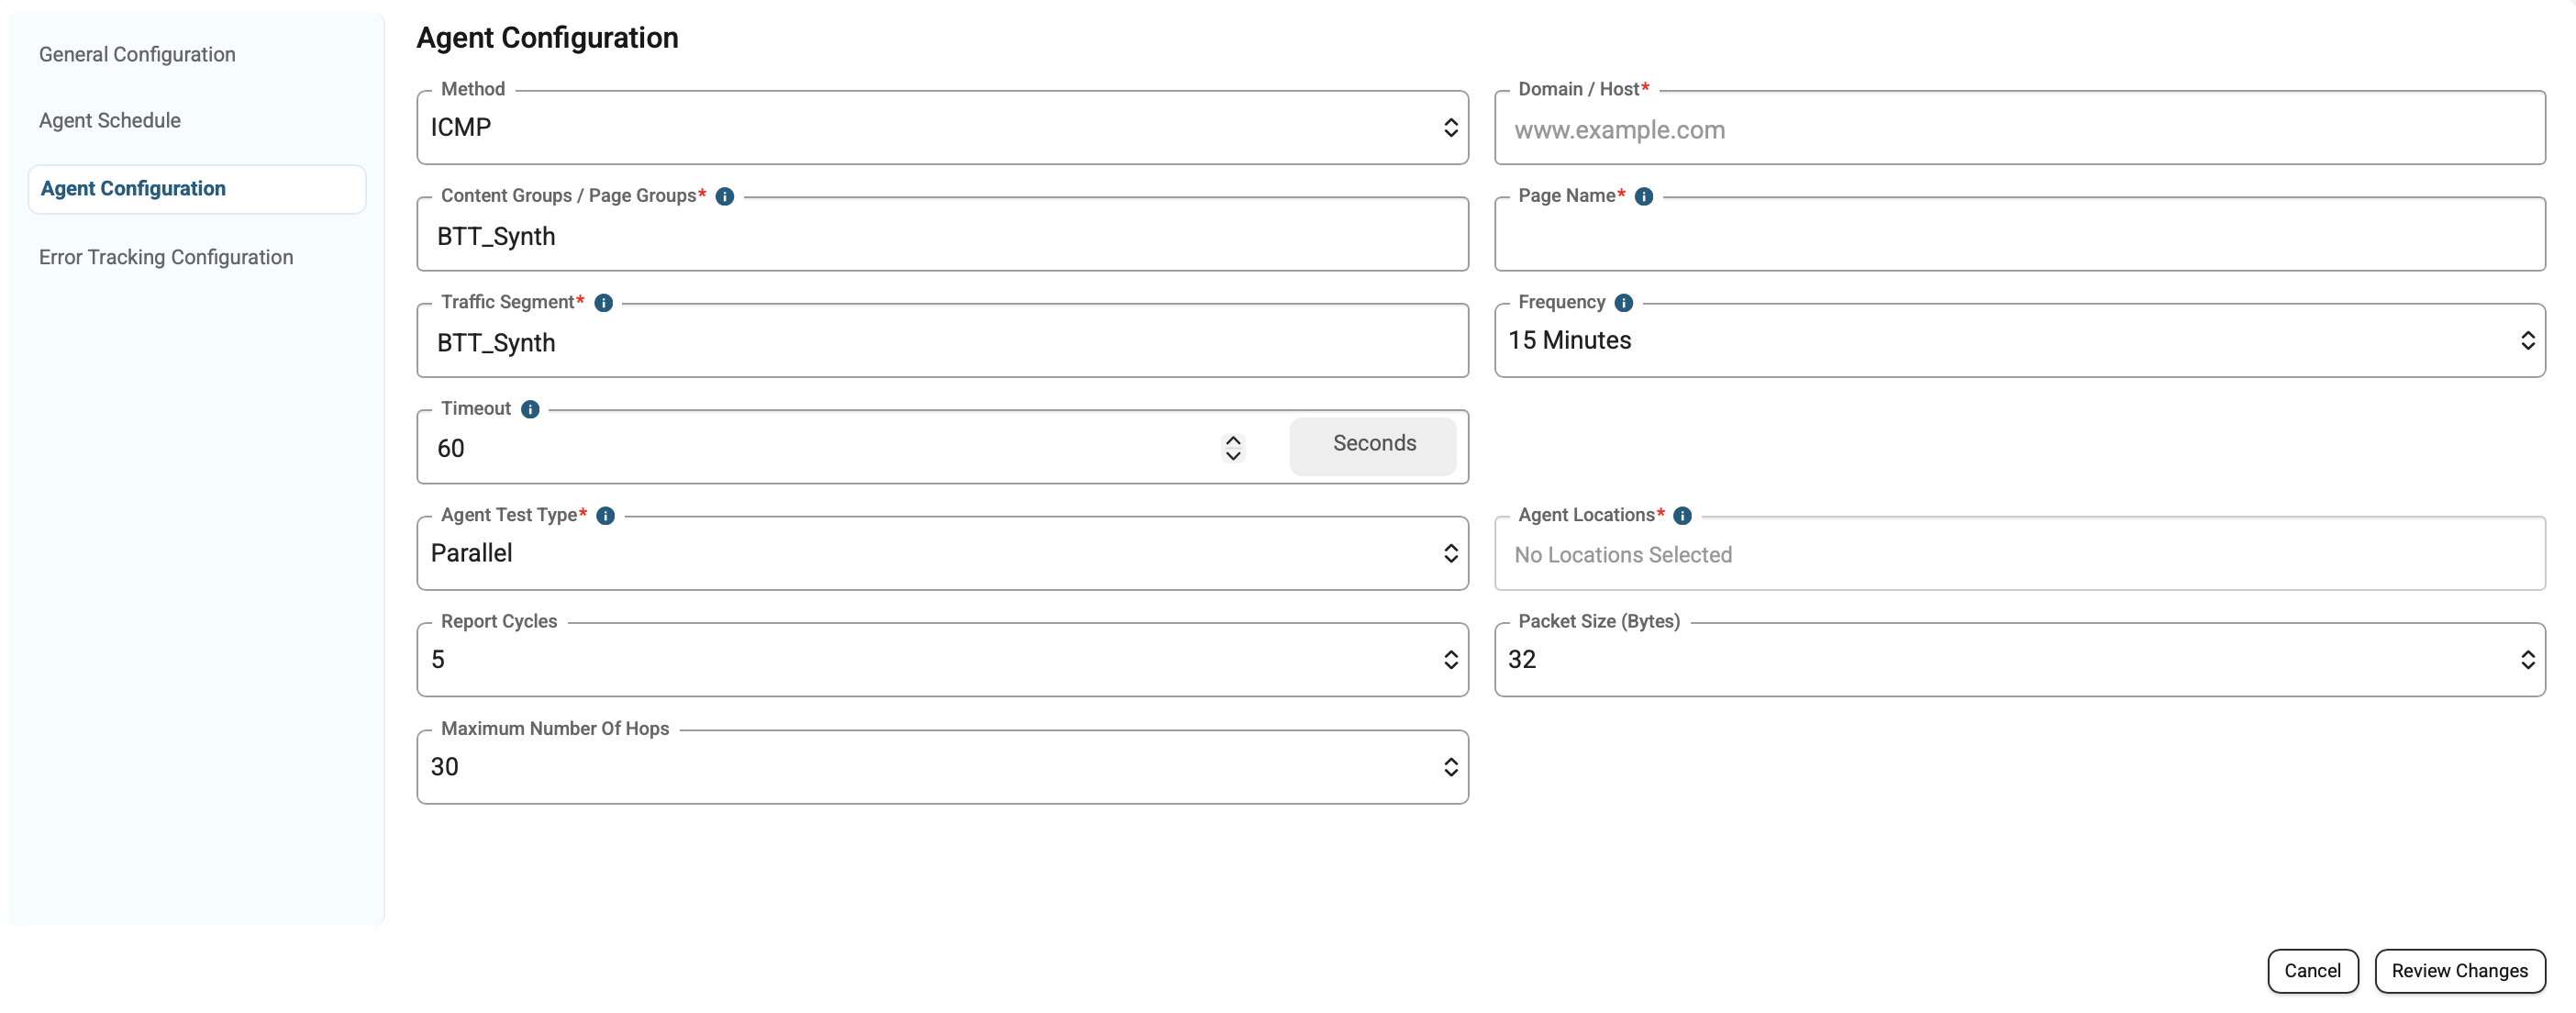
Method: protocol used to transmit data
-
Domain / Host: target for measurement
-
Report Cycles: number of measurements used for final MTR report data
-
Packet Size: how much data is transmitted during measurement
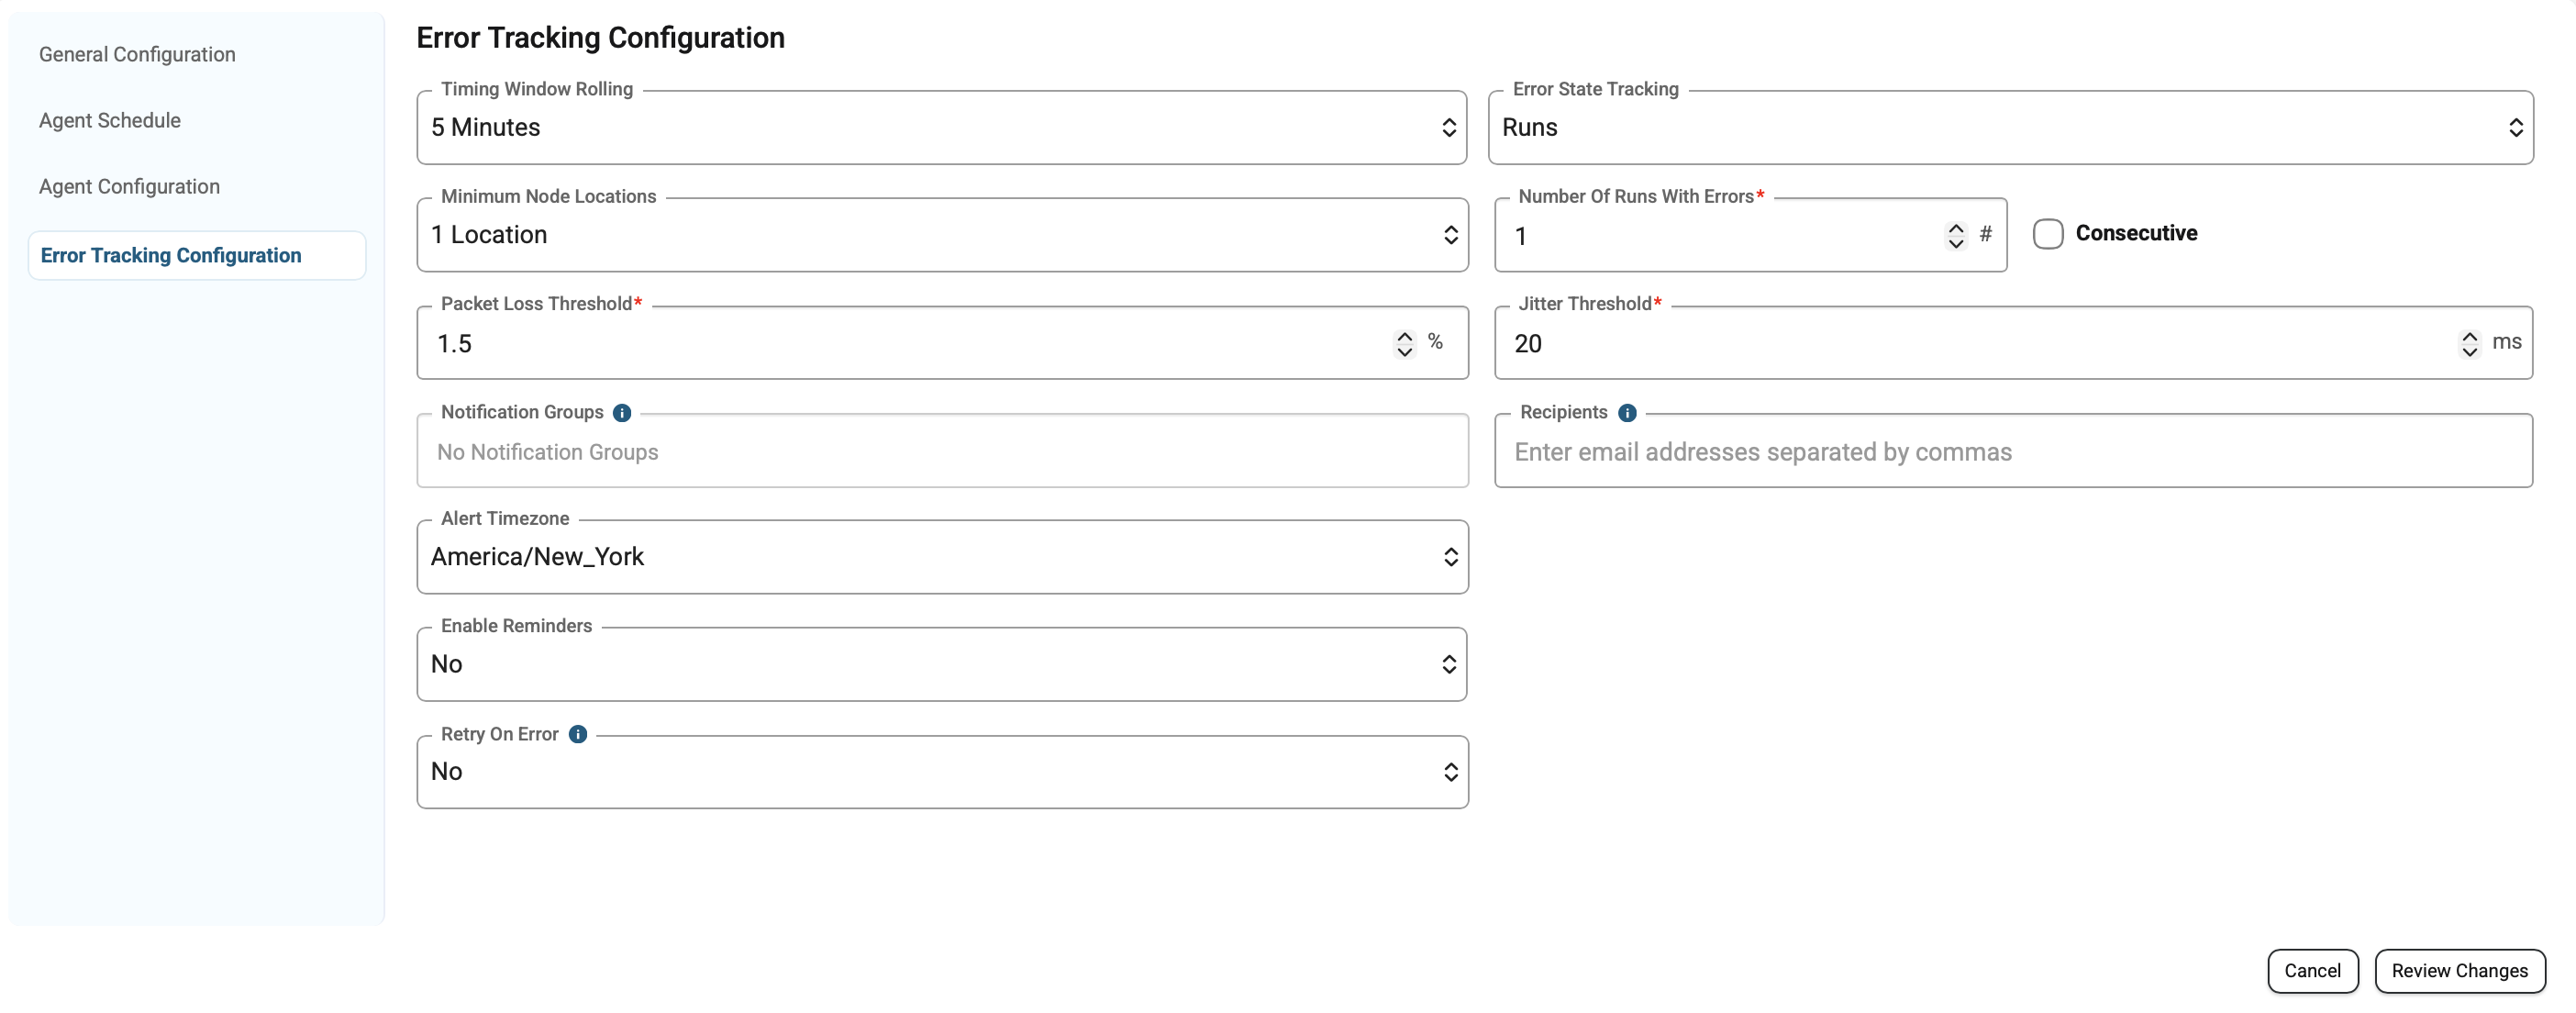
Error Tracking Configuration
-
Port Number (TCP method only): a more specific target on a server
-
Type of Service (Private Agent Location Only): setting for data priority
-
Max Number of Hops: total stops between monitor and host, inclusive
-
Packet Loss for Error Tracking: % of packets dropped before critical
-
Jitter for Error Tracking: amount of variance in ms before critical
Network Health Checks Pages
Performance Overview
-
High-level dashboard on availability and performance by both monitor and geography
-
Error State tracking for all configured Network Health Check Synthetic Monitors
-
Overview table of all Network Health Check monitors with all metrics reported
Performance Detail
-
High-level report on aggregate data for last hop
-
Trended data for last hop
-
Ability to drill down into trended data for scatter plot view
-
Select individual measurements to see full Traceroute (MTR)
Test Results
-
Drill-down to individual synthetic runs filtered by monitor including error codes
-
Includes MTR and Hubs data for each applicable measurement