

Overview
The Overview page for the Tag and Content Governance module shows at a glance how the tags on a site are behaving.
Where to Find the Tag Governance Overview Page
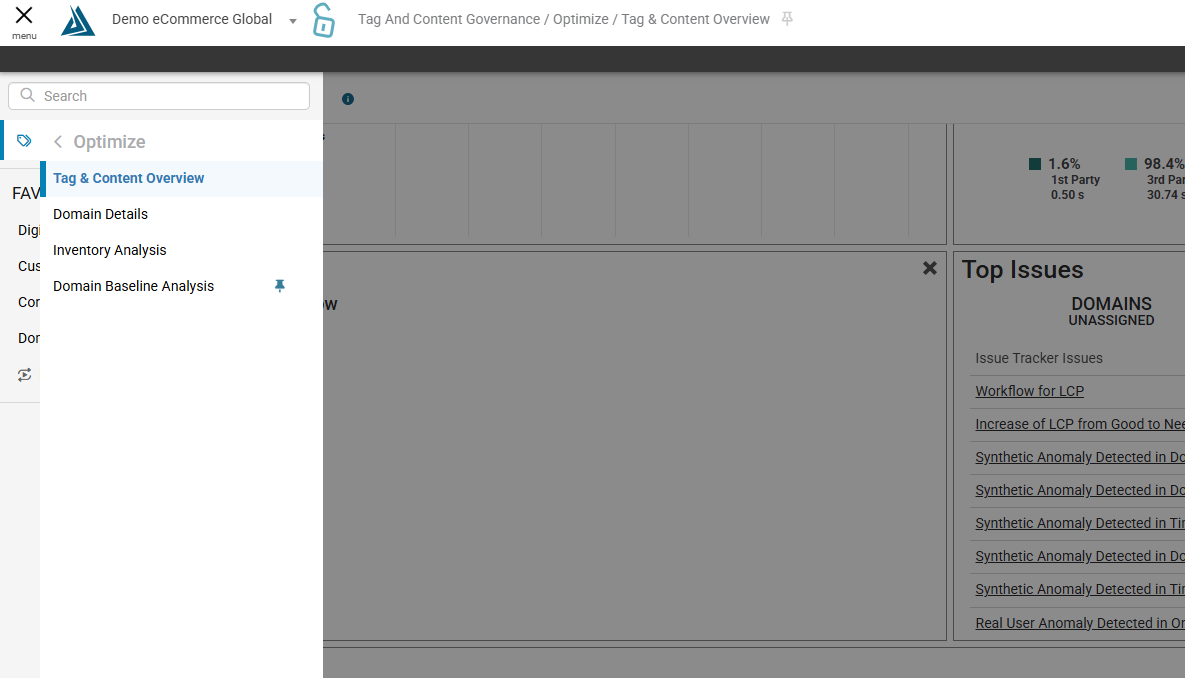
This page can be found in the portal in the left-side menu under CSP Tag & Content Governance, then Optimize, then Overview.
Widgets
The lookback period can be found on the top left. The page will default to the last 6 hours, change this by clicking the drop-down. Select Custom Date Selection to open the calendar picker in the right-side filtering menu.
1st and 3rd Party Activity and Composition
In the top left is the 1st and 3rd Party Activity widget. Toggle between the service, domain and file level view by using the tabs at the top.
To the right is the 1st and 3rd Party Composition widget. Here is shown at glance the makeup of the first and third party content on the site, including domain activity, file size and element count per page.
SLA Violations
Moving down the page, there is a widget showing SLAs that are currently in violation. The lines to the right show a trend of performance for this domain over the time period.
The SLA value is shown as the dotted line. Clicking the SLA will link to the SLA Status Page, giving more detail about the current status of all SLAs.
Top Issues
To the right is the top issues widget. At the top is the number of domains not categorized, the number of services without profiles, and a quick link to view any currently missing services.
Below, this area will display the top issues the BT system has detected on the site.
Environment
At the bottom of the page is the environment widget. This shows a trend of some high-level numbers, such as the average number of domains, pages, and files, observed from both RUM and Synthetic data. For each trend there is a delta, both a number and a percentage.
Below are more trends to give context on how tag governance management is going.
Customization
To customize the dashboard view, click and drag any of the widgets. Click the x icon in the top right of any widget to hide that widget entirely from the view. This places it in the panel to the side.
You can hide the side panel by clicking the minus icon above.
To show hidden widgets, simply click the plus icon, then click and drag the widget back into the dashboard view.
Also, to revert the page to the system default, click the button in the top right “Reset Widgets.”