

Video / Walkthrough
Overview
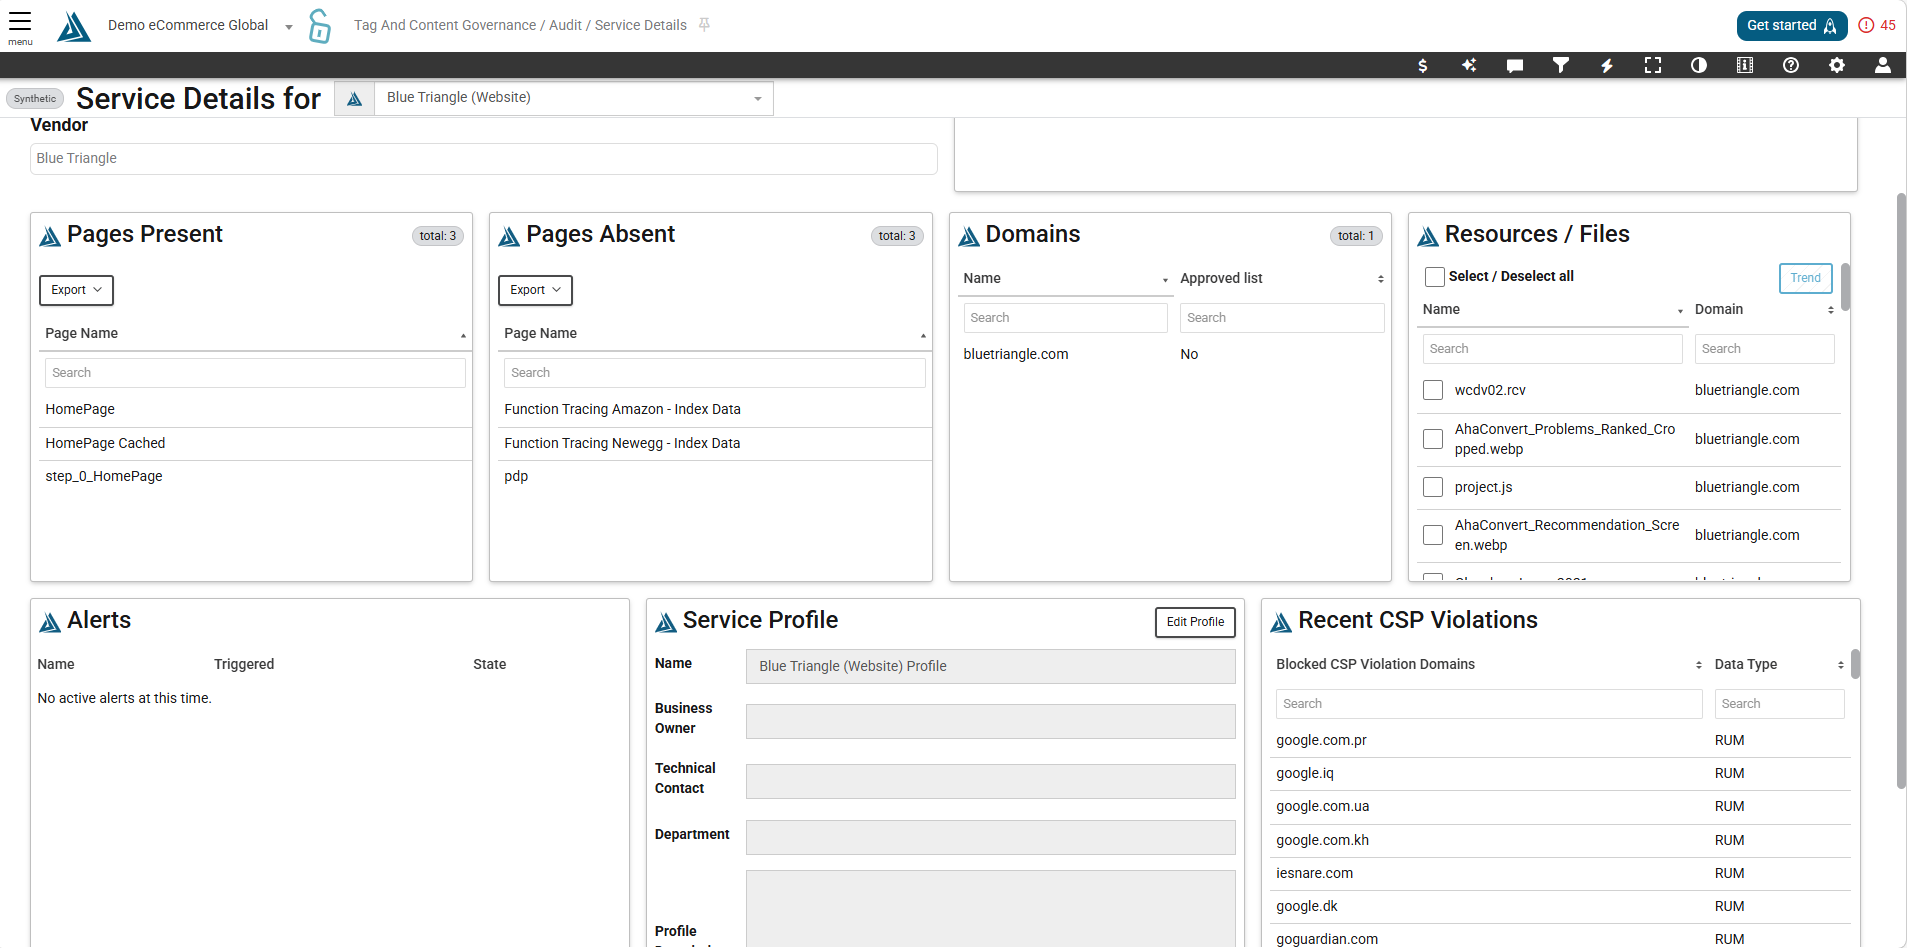
The Service Details page enables you to view in-depth information for each configured Service Profile for your website.
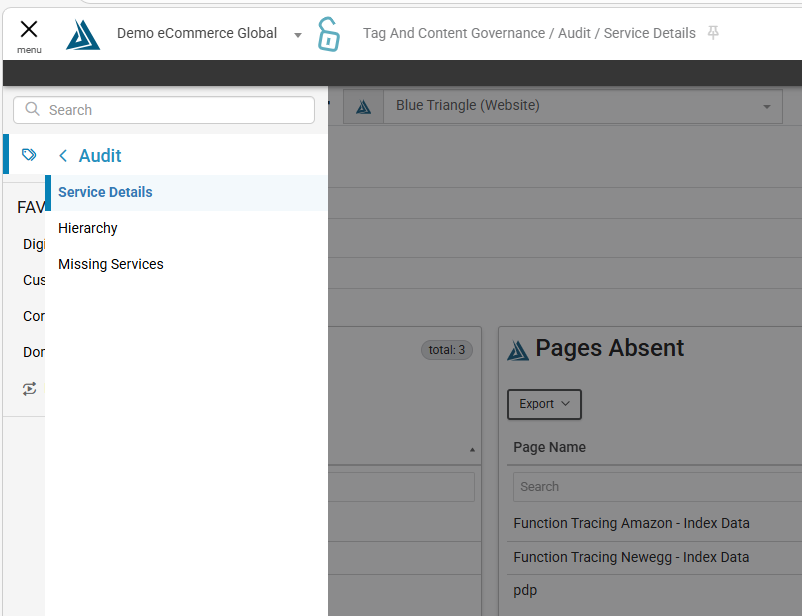
Where to Find the Service Details Page
You can find the Service Details page using our Left Navigation Menu. Go to CSP and Tag Governance → Audit-> Service Details
For more information, please see our documentation on our Left Navigation Menu.
Navigating the Service Details Page
Service Information
At the top of the page is the Service Selector. Below is displayed information about this service, including it’s category (vertical), the Vendor, and a brief description.
Pages Present
Moving down the screen there are two tables on the left that list the pages this service is on, and the pages this service is not on.
Domains and Resources
To the right is the domains and resources/files that comprise this service.
Select one or more resources from the list and trend their performance over the time period currently selected for the page.
SLA Thresholds
Below we can see the SLA thresholds configured for this service. Here we can create an alert from this SLA, edit the SLA, and tell at a glance whether the SLA is currently passing or failing.
Click the arrow button to expand the details for an SLA, view resources related to this SLA, and a sparkline trend for each. Click the button next to the resource to trend that resource’s performance in the graph.
Resource Timings
On the Resource Timings Over Time graph the SLA value is shown as a dotted line in the graph.
Alerts/Profile/CSP Violations
Moving to the bottom of the screen are the alerts, a quick view of the Profile, and Recent CSP Violations coming from this Service.
Filters
The indicator to the left of the service selector shows what type of data is currently being shown, in this case it is Synthetic. Change the type of data to view inside the filter menu, which can be opened by clicking the filter icon in the toolbar at the top of the page
By Default, data for the last 24 hours is shown. The time period can also be changed in the filters menu.