

Overview
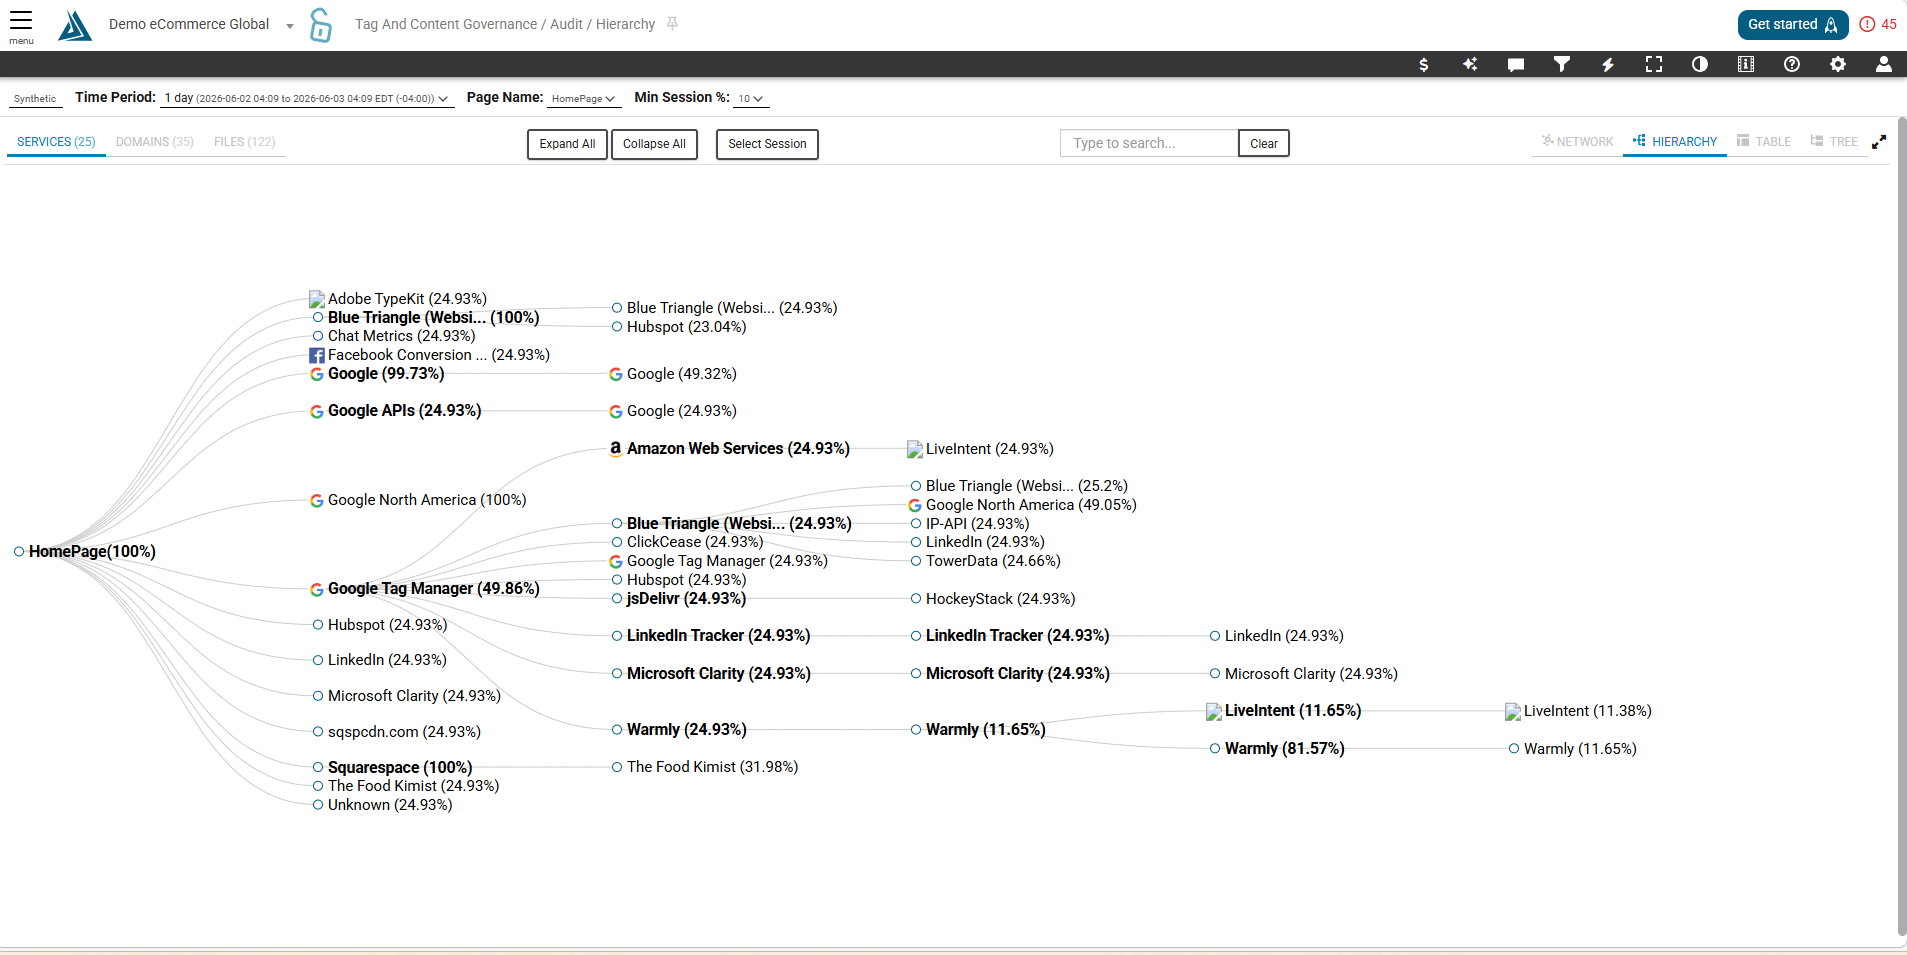
The Hierarchy Page shows an aggregate view of how web-pages load. This diagram is viewable in a variety of formats, and you can see this information at the Service, Domain and File level.
Where to Find the Hierarchy Page
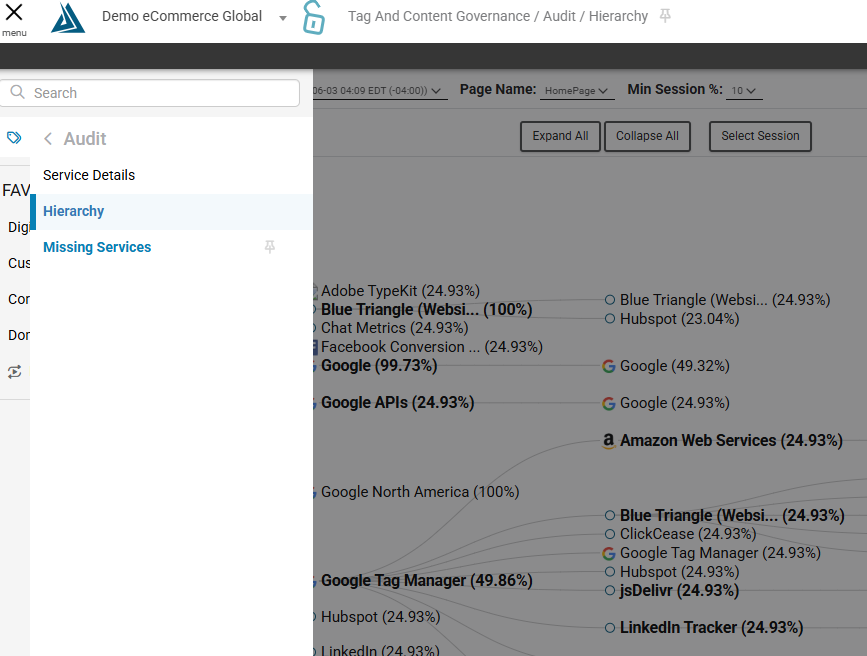
The Hierarchy page can be found in the left-side portal menu under CSP and Tag Governance → Audit → Hierarchy
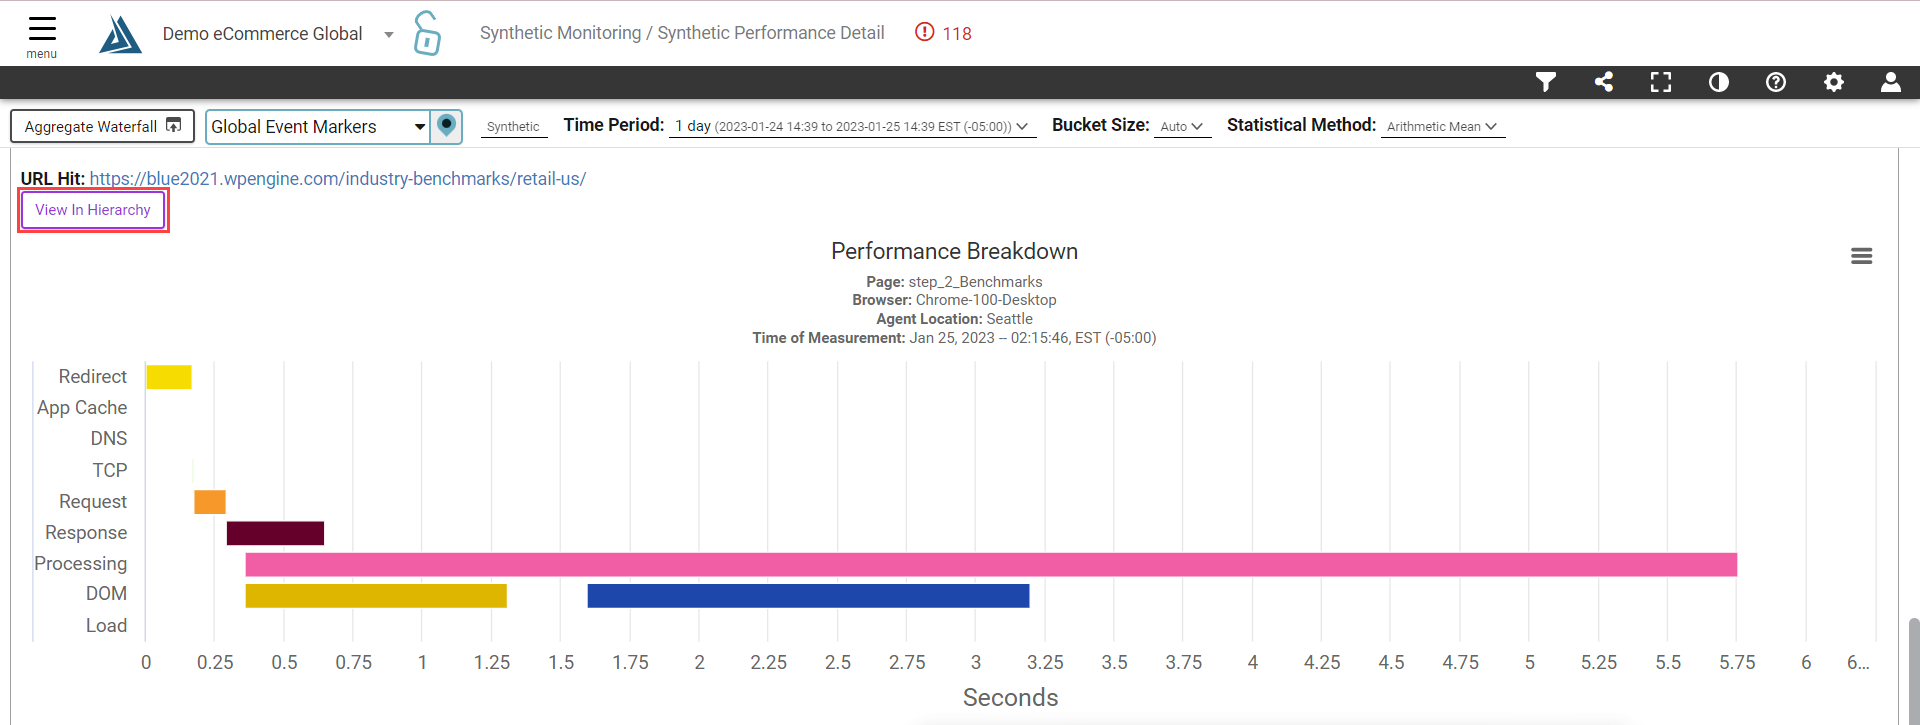
This page can also be found through the Synthetic Performance Detail in the Performance Breakdown widget. To view the data of a specific measurement, select the datapoint in the scatterplots above, then click the “View in Hierarchy” button.
 How to Navigate the Hierarchy Page
This page automatically displays Synthetic Data for the past 24 hours for the selected site. The Minimum Session Percentage, the minimum amount of time that element was present in the session, can be changed through the quick filter drop-downs at the top of the page.
In the top left switch between the Service, Domain and File level view by clicking the tabs.
Expand and collapse the hierarchy by clicking the corresponding buttons.
Also, search for specific items using the search bar.
Looking closer at the diagram, there are percentages next to each item. These percentages indicate the amount of time each Service/Domain/or File appeared on the page. Hover over the elements to get more information.
This diagram enables us to see how the page is loading and how elements are calling each other.
To zoom in an out, click control and scroll with your mouse. Click and drag the diagram to move it around.
There are three additional views in which to see this data: Network, Table, and Tree. Switch between these views using the tabs on the top right of the page.
Network Example:
Table Example:
Tree Example:
Filters
Use the filter menu to change the page and time period for which you are viewing data.