

Overview
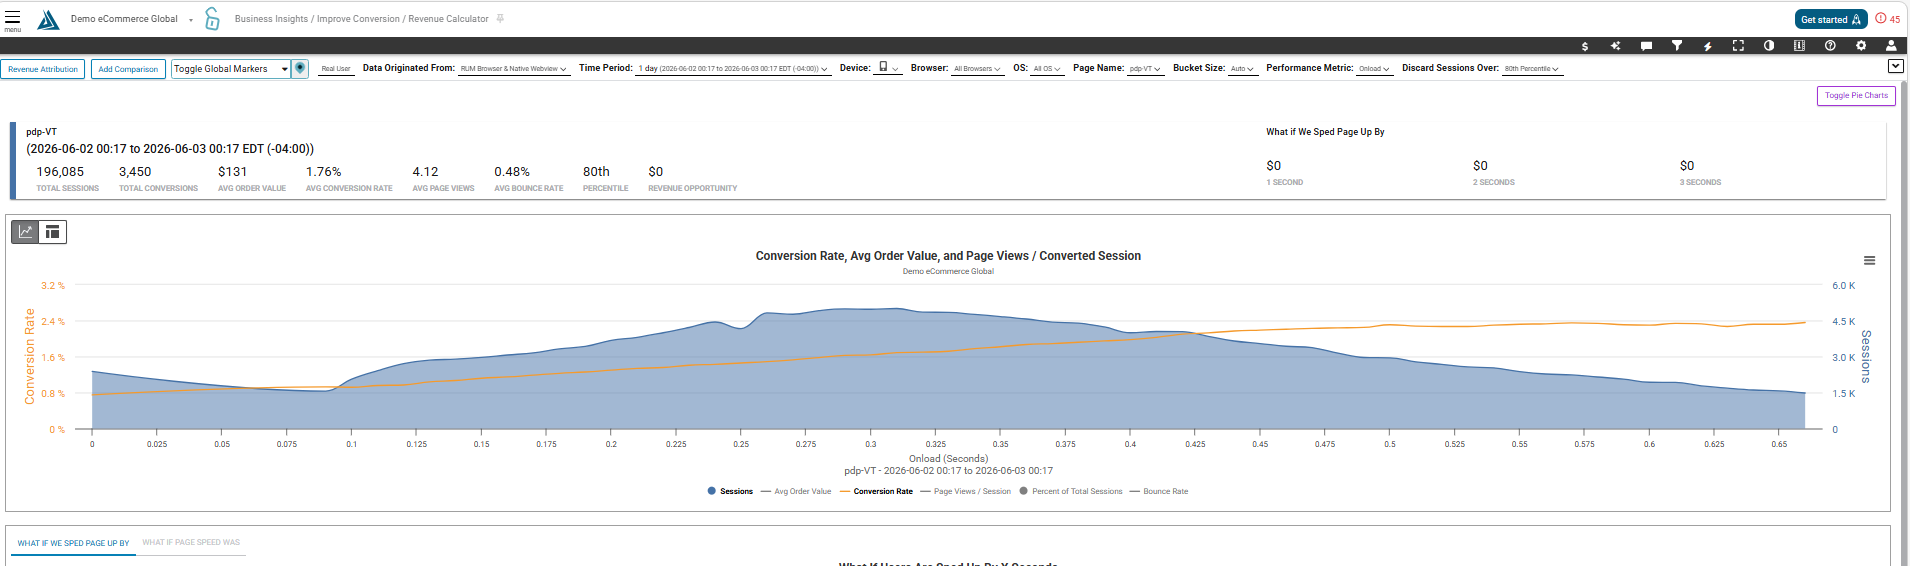
The 'Business Analytics – Revenue Calculator’ page accurately predicts the impact that changes in page load time will have on your revenue for every web page. It also visualizes the impact page load time has on various business KPIs (Conversion Rate, Sessions, Average Order Value, Page Views / Sessions, Bounce Rate).
How to Find the Revenue Calculator
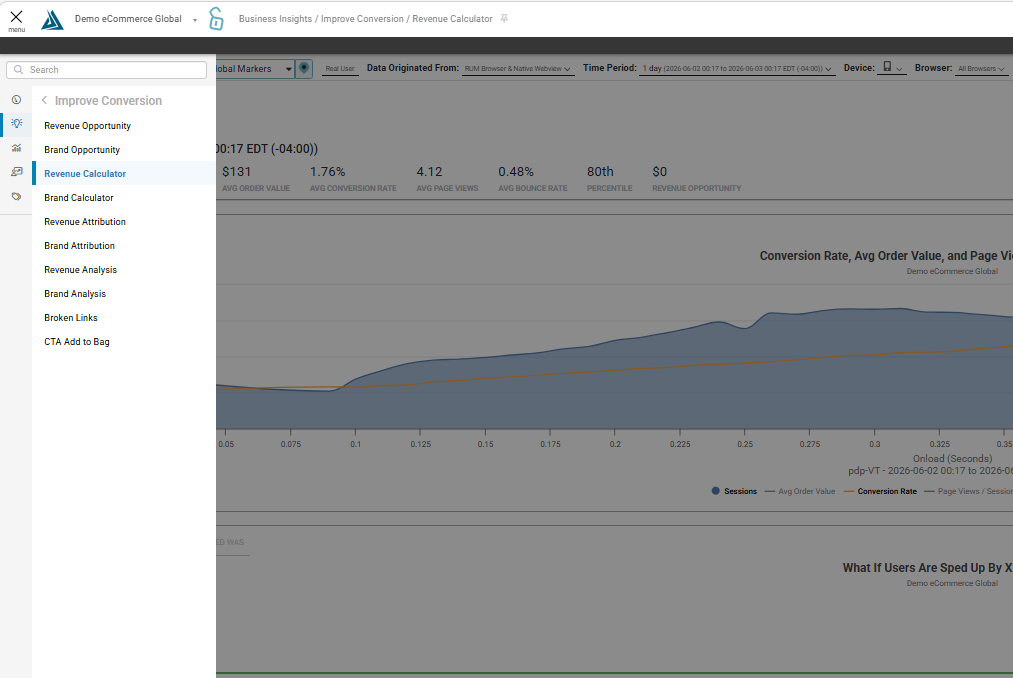
To find the Revenue Calculator, click on the menu at the top left side of the BT Portal and go to Business insights, then Improve Conversion, then Revenue Calculator
How to Set Up the Revenue Calculator
Click the filters icon on the top right of your screen and select any filters you would like to apply (e.g. Traffic Segment, Page Group, Page Name, Device, etc.).
If you’ve made a performance change and would like to see its impact on revenue in an emailed report, click the Revenue Attribution button located at the top left side of the page.
Select the date of performance change and click Run Report.
The report will be sent to the email address provided.
After closing this window, click Apply Filters in the filters menu.
How to Navigate the Revenue Calculator
Once you’ve applied your filters, a series of graphs will update.
Business KPIs by Page Load Time
This graph visualizes how business KPIs (Conversion Rate, Sessions, Average Order Value, Page Views / Sessions, Bounce Rate) were impacted by variations in page load time during the time period selected. The X axis is page load time. The Y axis varies based on the metric(s) selected.
What If Users are Sped Up by X Seconds
This graph calculates how incremental changes in page load time would have impacted revenue during the time period selected. The X axis is improvement in page load time. The Y axis is revenue opportunity.
What If Users are Sped Up to X Seconds
This graph calculates how a change in average page load time would have impacted revenue during the time period selected. The X axis is improvement in page load time. The Y axis is revenue opportunity.
Conversion Rate, Average Order Value / Converted Session Over Time
See how these metrics trend over the time period selected.