

Overview
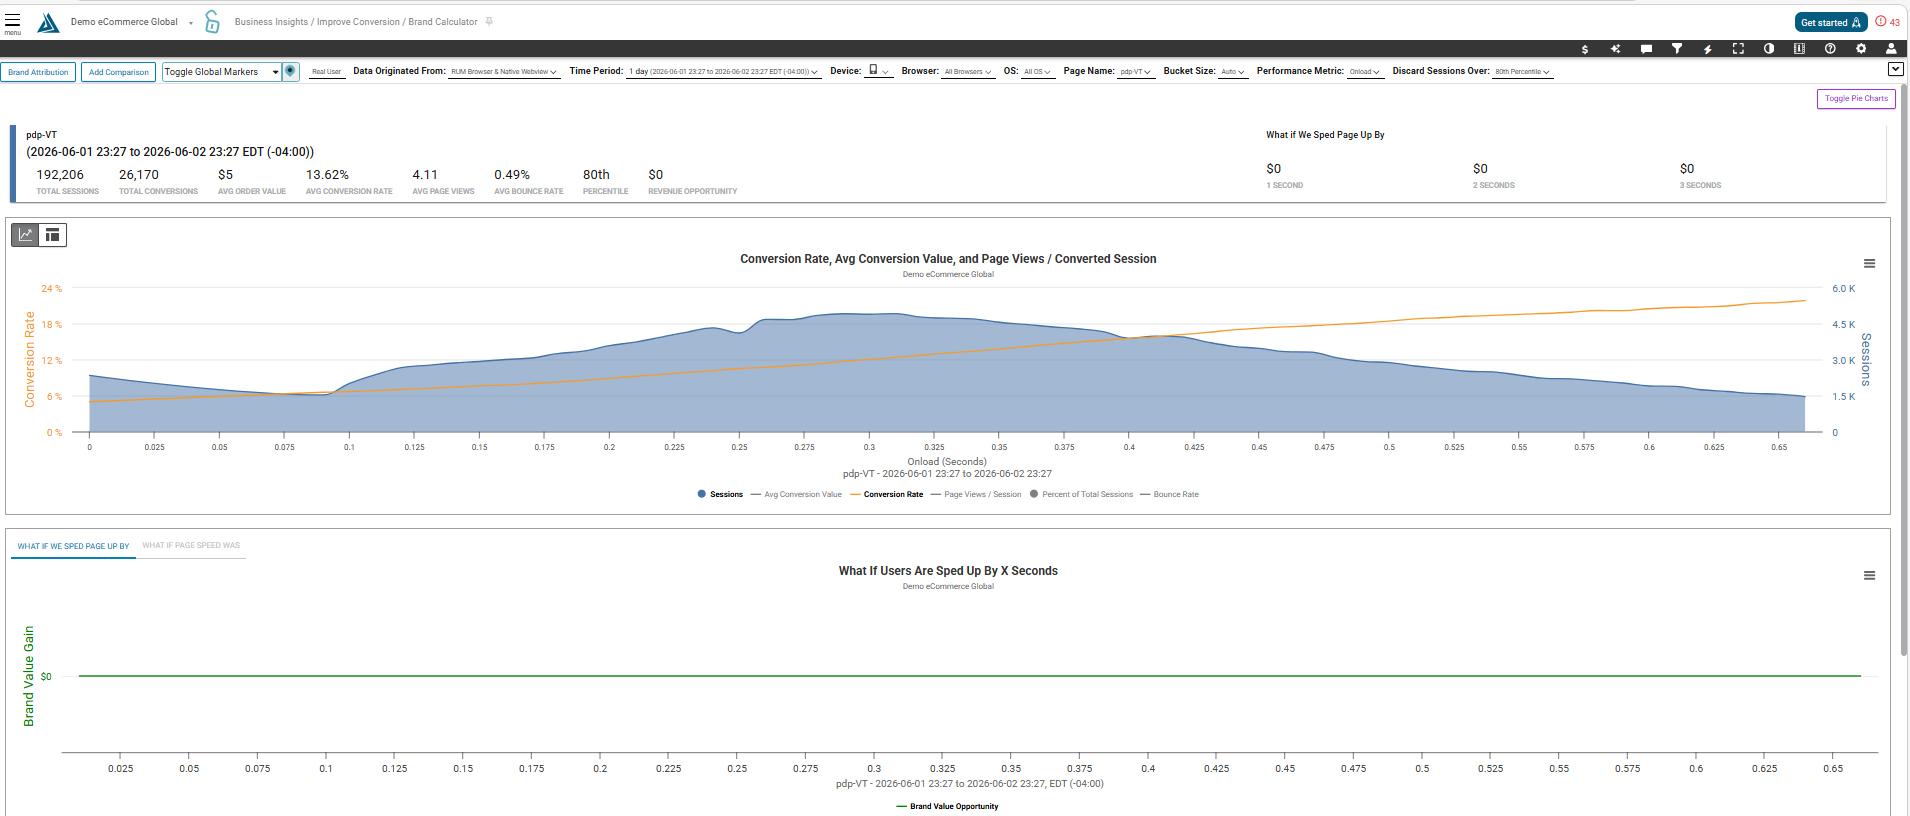
The Brand Calculator page accurately predicts the impact that changes in page load time will have on brand value for every web page. It also visualizes the impact page load time has on various business KPIs (Conversion Rate, Sessions, Average Order Value, Page Views / Sessions, Bounce Rate).
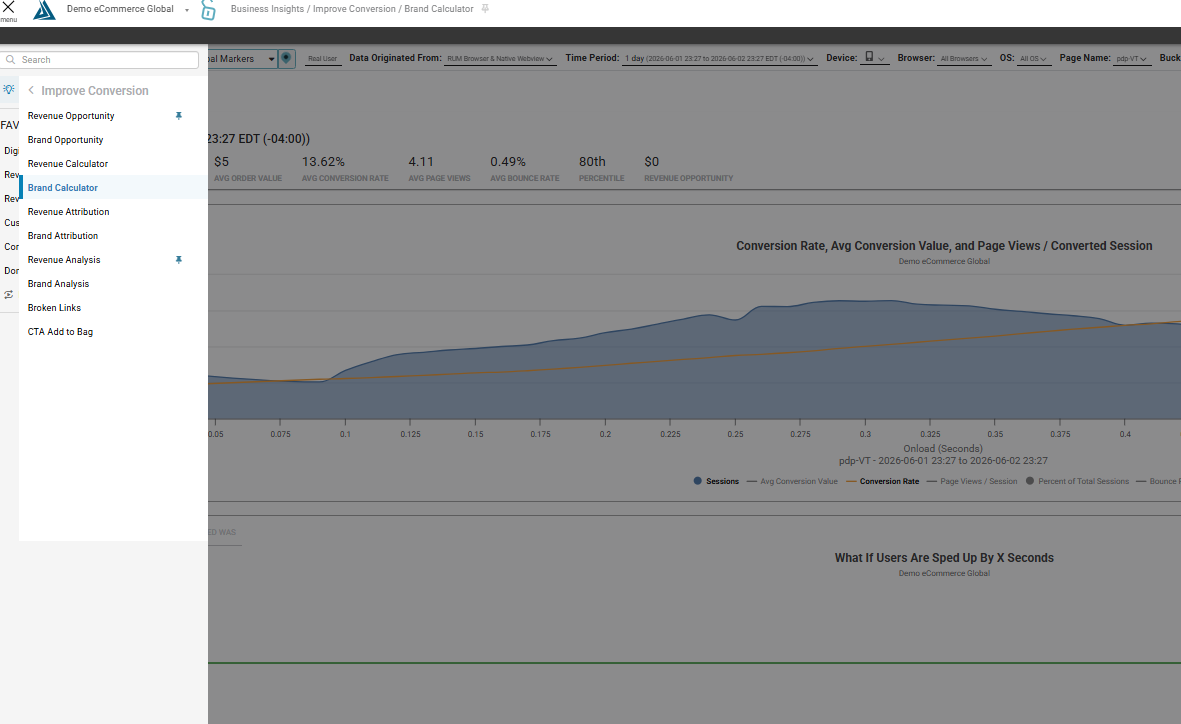
How to Find the Brand Calculator
The Brand Calculator page can be found in the the left-side portal menu under Business insights, then Improve Conversion, then Brand Calculator
How to Set Up the Brand Calculator
Click the filters icon on the top right of your screen and select any filters you would like to apply (e.g. Traffic Segment, Page Group, Page Name, Device, etc.).
If you’ve made a performance change and would like to see its impact on brand value in an emailed report, click the Brand Attribution button located at the top left side of the page.
Select the date of performance change and click Run Report. The report will be sent to the email address provided.
How to Navigate the Brand Calculator
Use the arrow tab at the top right of the page to expand the quick filters.
The top of the page gives a quick breakdown of brand performance, as well as how much brand value can be added if the page is sped up by one, two, or three seconds.
Following this is a series of graphs. Toggle each of these graphs into a table using the tabs on the left side of the graph. Click on a metric to add or remove it from the graph.
Business KPIs by Sessions:
What If Users are Sped Up By X Seconds:
Conversion Rate, Average Order Value / Converted Session Over Time:
Add a Comparison
To add a comparison, simply click the button at the top of the page.
Choose a time period to compare to, name the comparison, and choose which configurations to include. Click Next.
Now choose any other filters necessary, and click Add Comparison.
A breakdown with the new time period will appear at the top, and comparison lines are added to the graphs.