

Overview
The revenue analysis page shows your revenue performance over time.
How to Find the Revenue Analysis Page
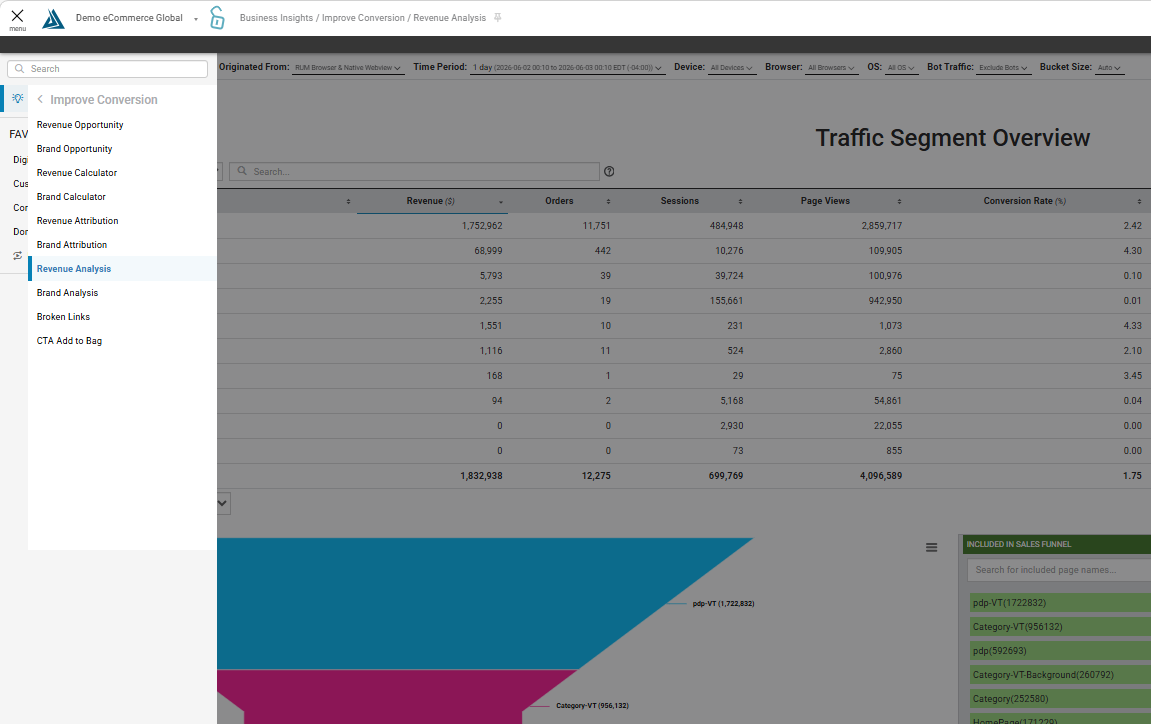
To find the Revenue Analysis page, first click on the menu on the top left side of the BT Portal, go to Business insights, then Improve Conversion , and then click on Revenue Analysis.
Page Views and Revenue by Platform
To view these graphs, use the purple 'Toggle Pie Charts' button indicated in the screenshoot above. You are able download these graphs as image files using the hamburger icon on the right of each pie graph. In that menu, you can also snag the JSON for the BT API used for this graph.
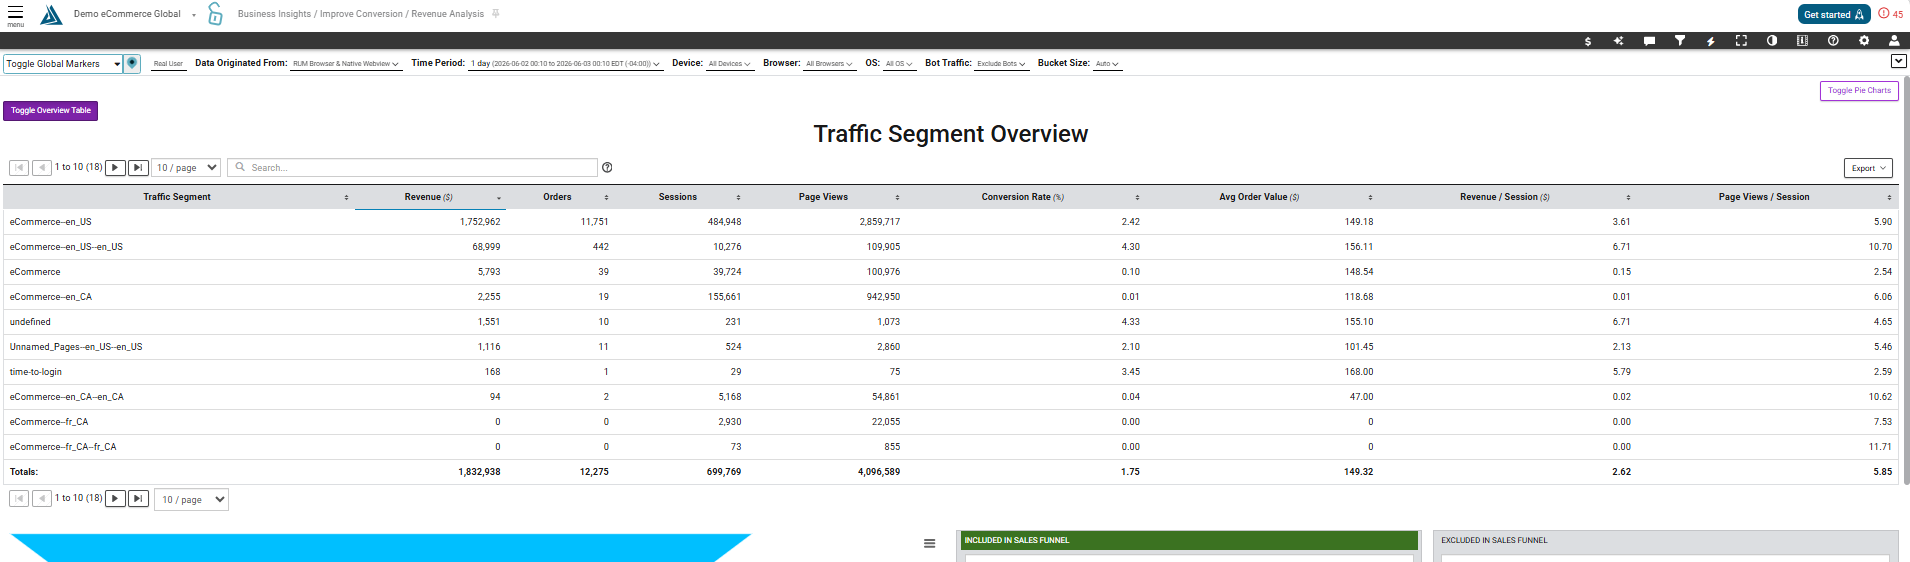
Traffic Segment Overview
When you first access the page, you will see your data from over the last 24 hours at the 80th percentile. The table at the top is an overview of the various traffic segments you have configured, and is sorted by revenue.
In this example, we see there was an A-B test running with eCommerce as the default, against eCommerce US, which is getting a different experience. As you can see in the table, eCommerce US is performing much better.
Sales Funnel
Below you will see the sales funnel. Each page is listed with the number of page views from the selected time period. Notice the two tables to the right. To add pages to the sales funnel, simply click and drag from the right to the left. You can remove them by doing the reverse.
Graphs
Toggle each of these graphs into a table using the buttons on the left side.