

Overview
The Brand Attribution page utilizes an algorithm based on Sessions to identify and quantify the key influences driving weekly brand value changes. These factors are grouped into two categories: Experience Influences (Performance and Stability) and Marketing Influences (Traffic, Average Conversion Value, and Intent). Together, they contribute to the overall Brand Value change.
As a best practice, select a meaningful comparison date, such as the rollout of a brand or site change, to compare brand value metrics from the week before and after the change. By default, this report runs once every week on Monday.
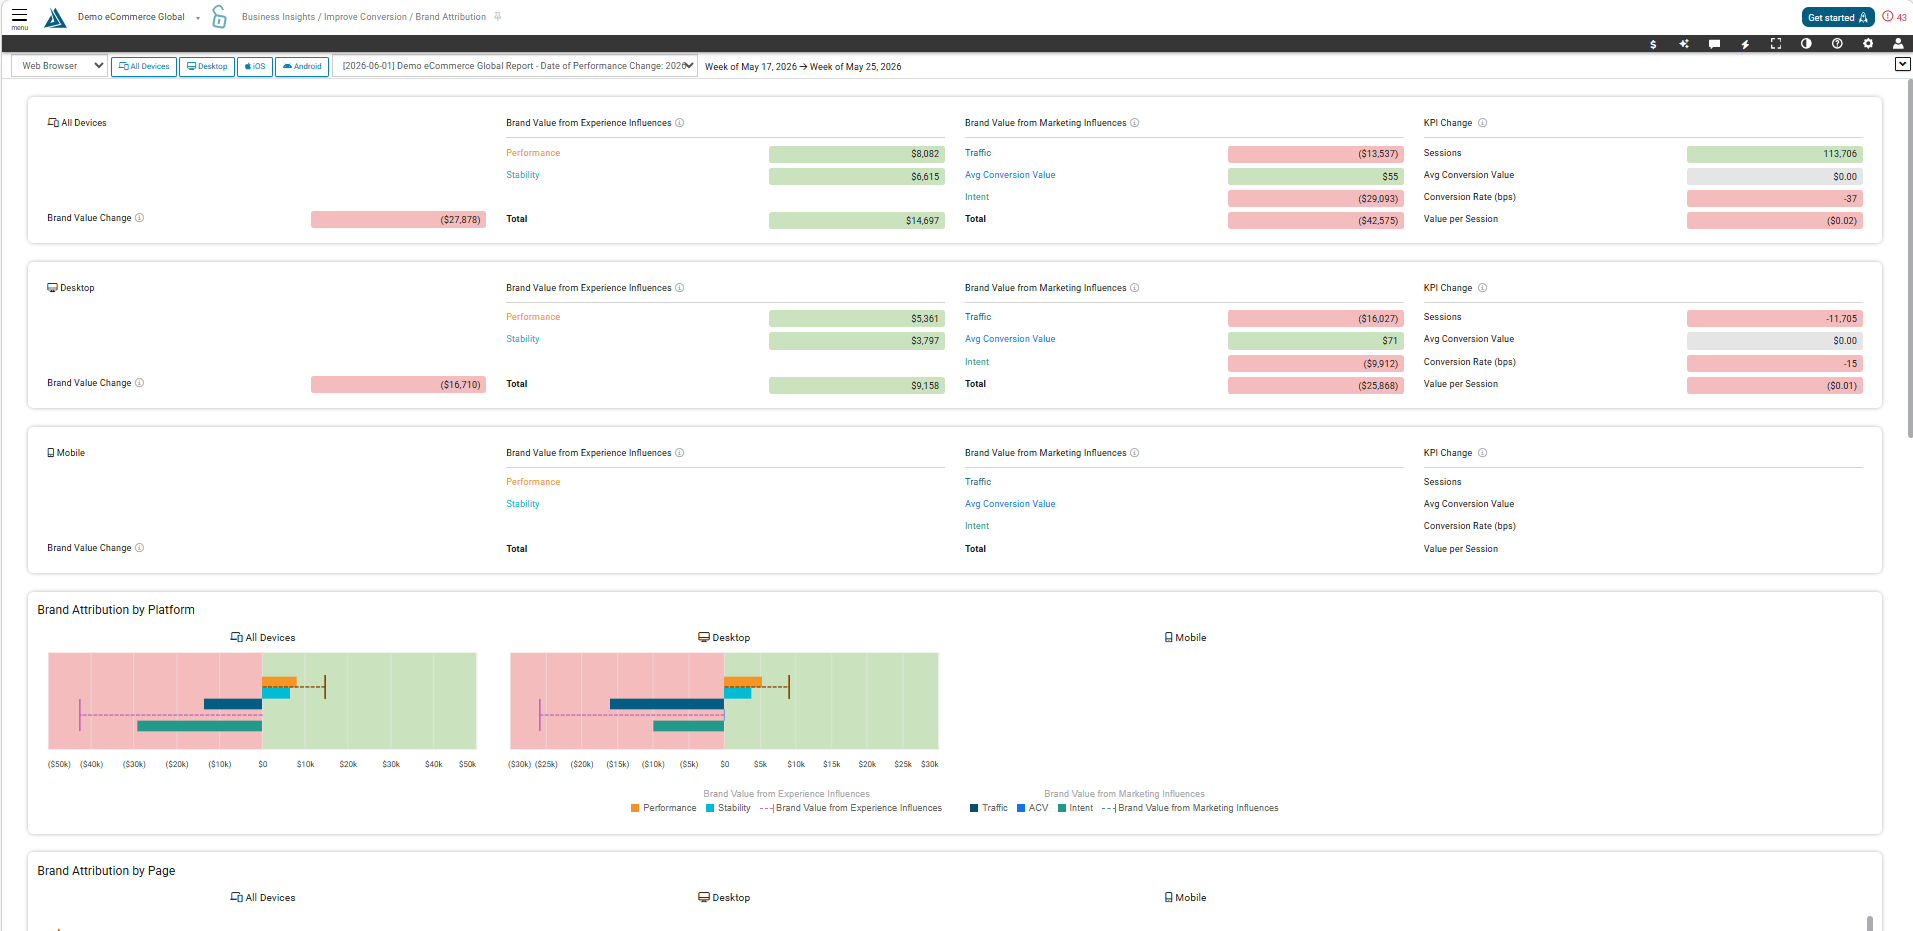
How to Find the Brand Attribution Page
The Brand Attribution page can be found in the the left-side portal menu under Business Analytics, then Brand Attribution.
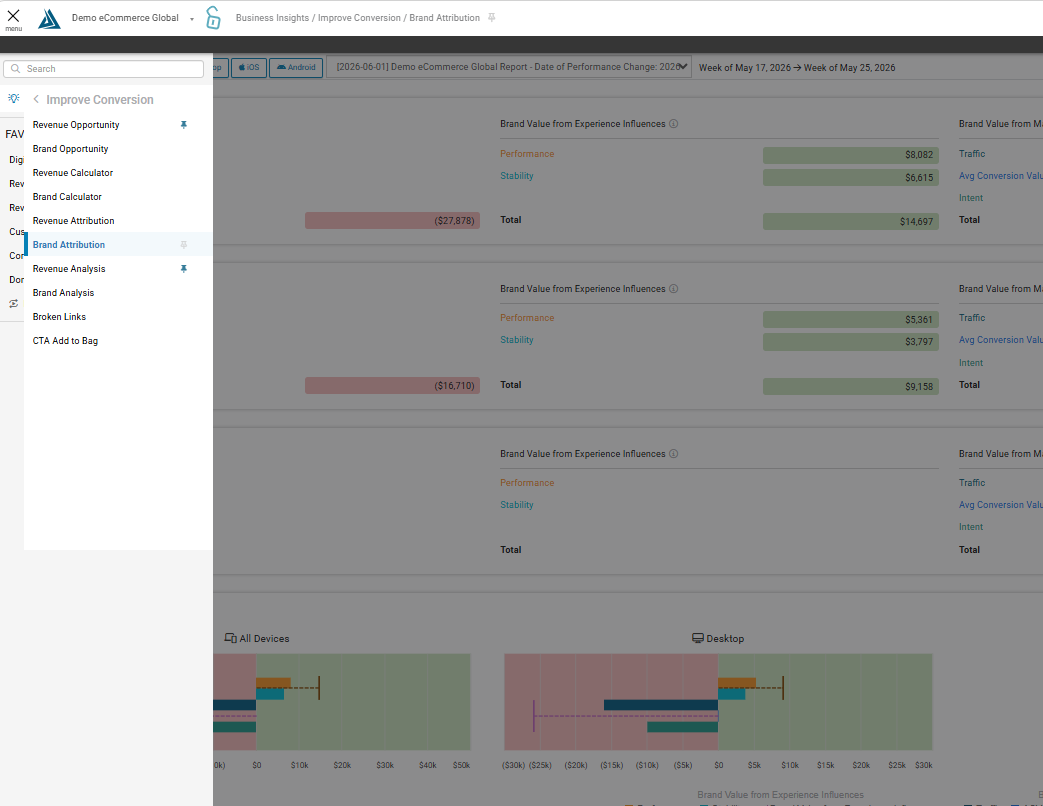
How to Filter the Brand Attribution Page
The quick filters can be found at the top of the page.

Brand Value Attributed to Experience vs Marketing
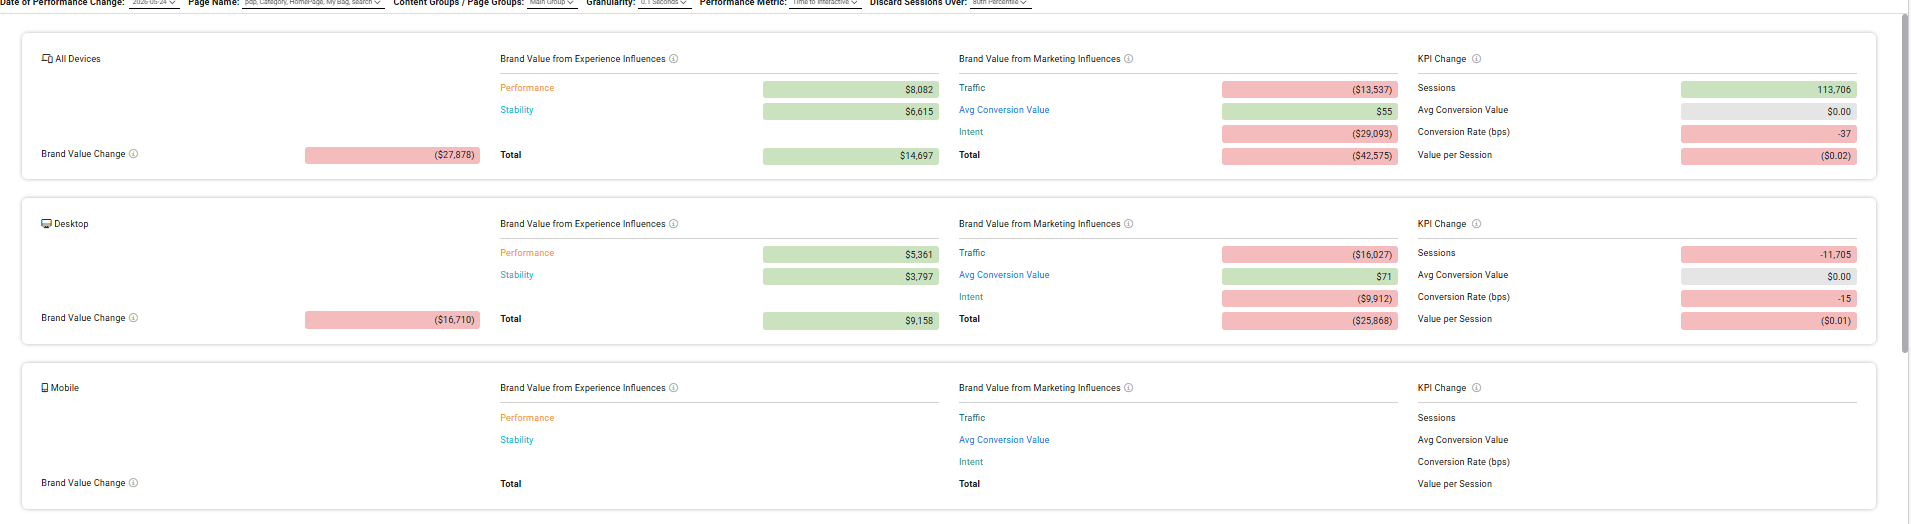
The top section of this report shows the calculated Brand Value attributed from each influence. It is a display of the data in the sections below in one succinct location.
This report breaks down five distinct influences into two categories: Experience Influences (Performance and Stability) and Marketing Influences (Traffic, Average Conversion Value, and Intent). Each influence is measured in terms of the brand value it generated, isolating its impact by controlling for the other factors. The combined effect of all five influences represents the total Brand Value change.
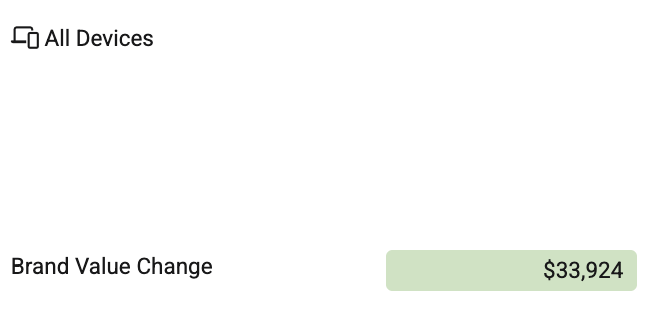
Brand Value Change
This is the overall brand value change for the selected period, representing the net combined impact of all Experience and Marketing Influences week over week. A positive number indicates an increase in brand value from the previous period, while a negative number indicates a decrease.
Brand Value from Experience Influences
Brand value attributed to Experience Influences reflects changes, positive or negative, in the user experience and how users perceive the page. These influences are evaluated in terms of Performance and Stability, and their combined impact is summed to represent the total Experience Influence.

Brand Value from Marketing Influences
Brand value attributed to Marketing Influences is associated with changes in the market, traffic volume, pricing, or promotions. These influences are evaluated in terms of Traffic, Average Conversion Value, and Intent, and their combined impact is summed to represent the total Marketing Influence.
KPI Change
This section uses all of the filters that are applied and shows the actual measured KPI differences week over week.
This is the actual measured difference in the number of sessions week over week. A positive number indicates an increase in sessions from the previous period and a negative number indicates a decrease.
This is the actual measured difference in Average Conversion Value week over week. A positive number indicates an increase from the previous period while a negative number indicates a decrease.
This is the actual measured difference in Conversion Rate week over week. A positive number indicates an increase from the previous period while a negative number indicates a decrease. This is measured in basis points, which represents the direction of conversion rate percentage in hundredths. One basis point is 1/100th of a percentage.
This is the actual measured average brand value per session week over week. A positive number indicates that there is an increase in average brand value per session from the previous period while a negative number indicates a decrease.
Brand Value Attribution by Page
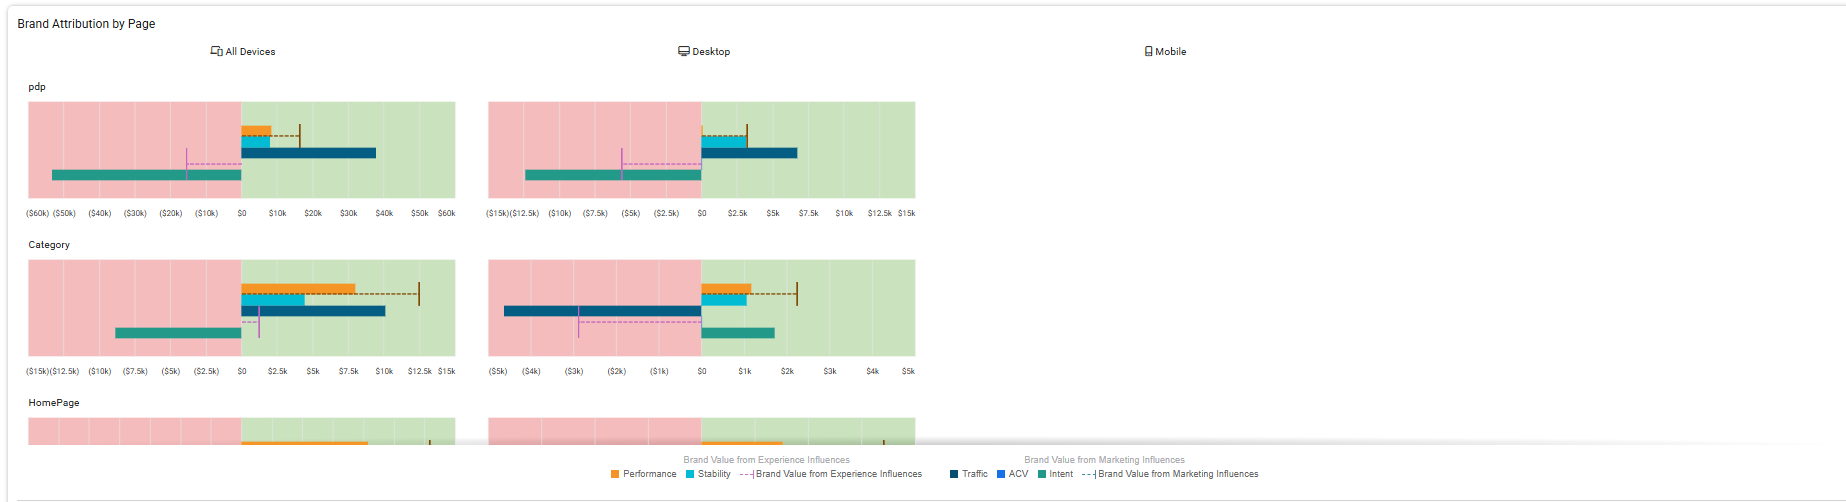
This section shows Brand Value Influence data on a page-by-page basis in both a bar chart and table format. Use this section to identify how Influences are impacted on specific pages of your site and determine if one page is contributing more to brand value changes than others.
Each bar in the chart represents an individual influence, while the whisker represents the brand value attributed to the Influence Group. The legend below the chart identifies which color corresponds to each influence. Hovering over a bar or whisker will display the exact value it represents.
The bar direction indicates performance: a bar extending to the right (green) represents a positive change from the previous period, while a bar extending to the left (red) represents a negative change.
Brand Value Attribution by Platform

This section displays Brand Value Influence data broken down by platform (device). Each bar in the chart represents an individual influence, while the whisker represents the brand value attributed to the Influence Group.
The legend below the chart identifies which color corresponds to each influence. Hovering over a bar or whisker will display the exact value it represents.
The bar direction indicates performance: a bar extending to the right (green) represents a positive change from the previous period, while a bar extending to the left (red) represents a negative change.
Brand Value Attribution Table by Device
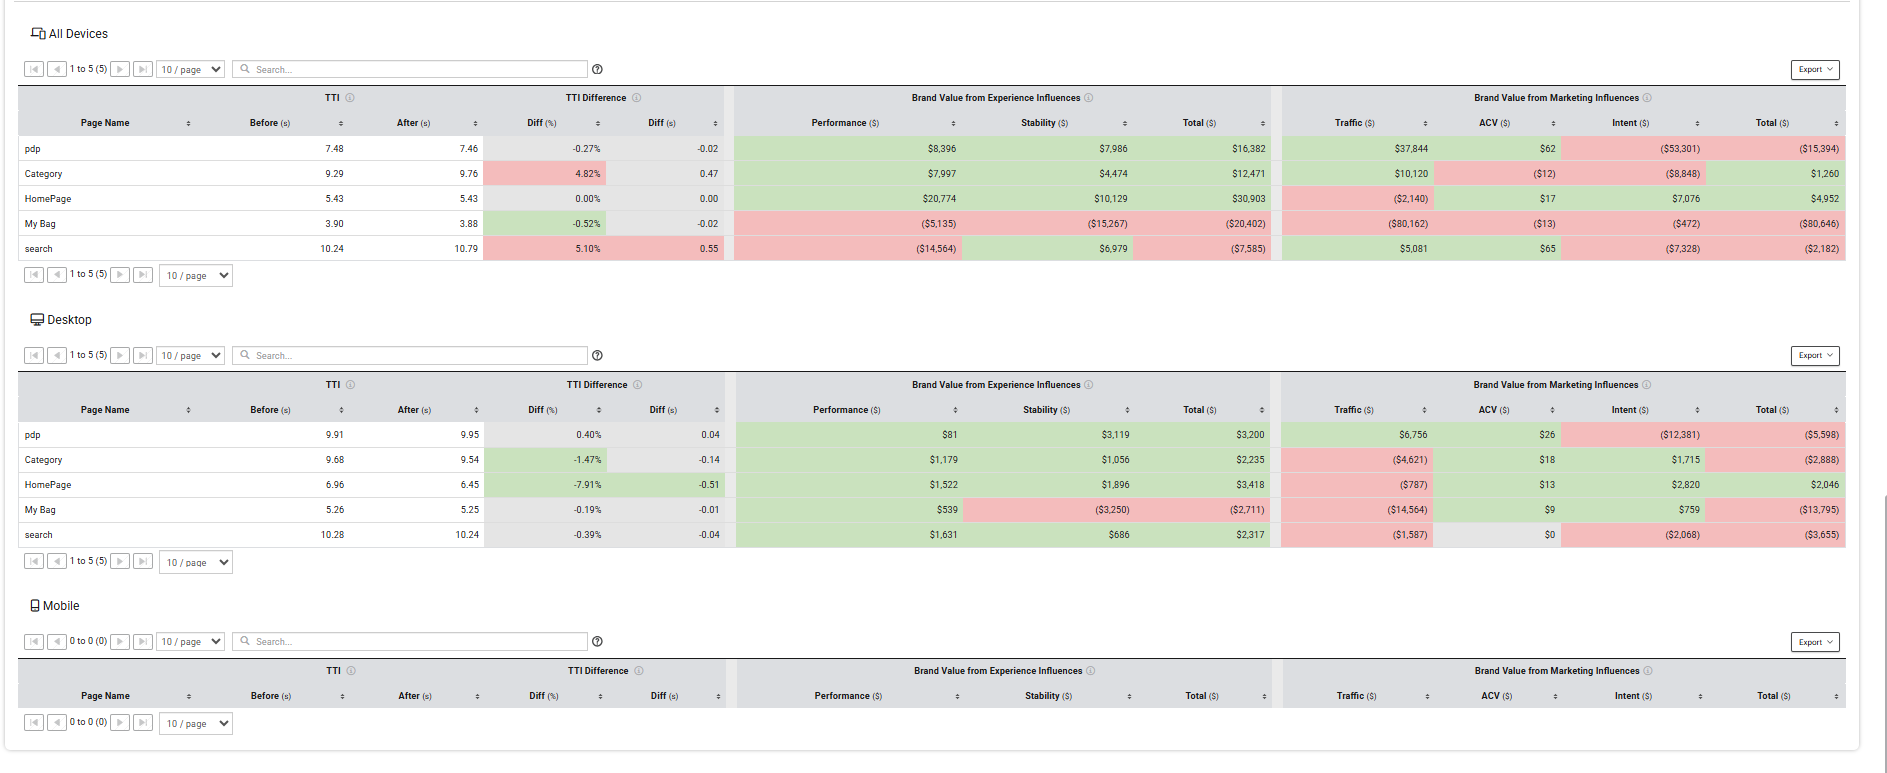
This section provides a detailed table view of Brand Value Influence data broken down by device (All Devices, Desktop, and Mobile). The table includes the performance metric (TTI) before and after the change, the TTI difference, and the brand value attributed to each Experience and Marketing Influence for each page.
You can use the table to compare brand value impact across pages and devices. The table can be exported using the Export button in the top right corner of each device table.
Brand Value Attribution Report
Finding Your Reports
To find the report in the Left Navigation menu, click on Business Insights → Improve Conversion → Brand Attribution. You can also use the search bar at the top of the menu to search for the report.
Each report you run can also be found in the dropdown menu located in the top left of the page. After clicking on the dropdown menu, you can see a list of all the reports that have been previously run. To change reports, simply click on the one you want to view and that report with its associated filters will load on the screen.
Filtering
To adjust the data displayed in your Brand Attribution report, click the filter icon located in the top right corner of the page.
Updating the filters will automatically trigger a new report to run after you press the “Save & Run Report” button. You can choose to give this new report a custom name, or it will be saved with a default name that includes the site title and the date of performance change that you are measuring.
All influences can be broken down by Desktop, Mobile, or All Devices. You can decide which devices you want to display on your report by clicking the device buttons in the top left corner of the page. When the device button is outlined in blue, that device selection will be visible on the page.
When the button is grayed out, that device selection will not be visible on the page and the remaining device visuals will adjust to fill the width of the page.
About Your Report
By default, the Brand Attribution report runs automatically at the start of each fiscal week. When a new report is generated, the initial processing may take 5 to 20 minutes to complete. This delay only occurs during the first run; subsequent views of the same report (accessed via the report selection dropdown menu) will load instantly.
KPI change and measured differences are calculated to understand actual brand value differences. The Influences are then scaled to match that measured difference.
For details on how to run a report with updated filters, please refer to the Filtering section of this article.