

Overview
The Brand Analysis page reviews performance attributed to your brand over time.
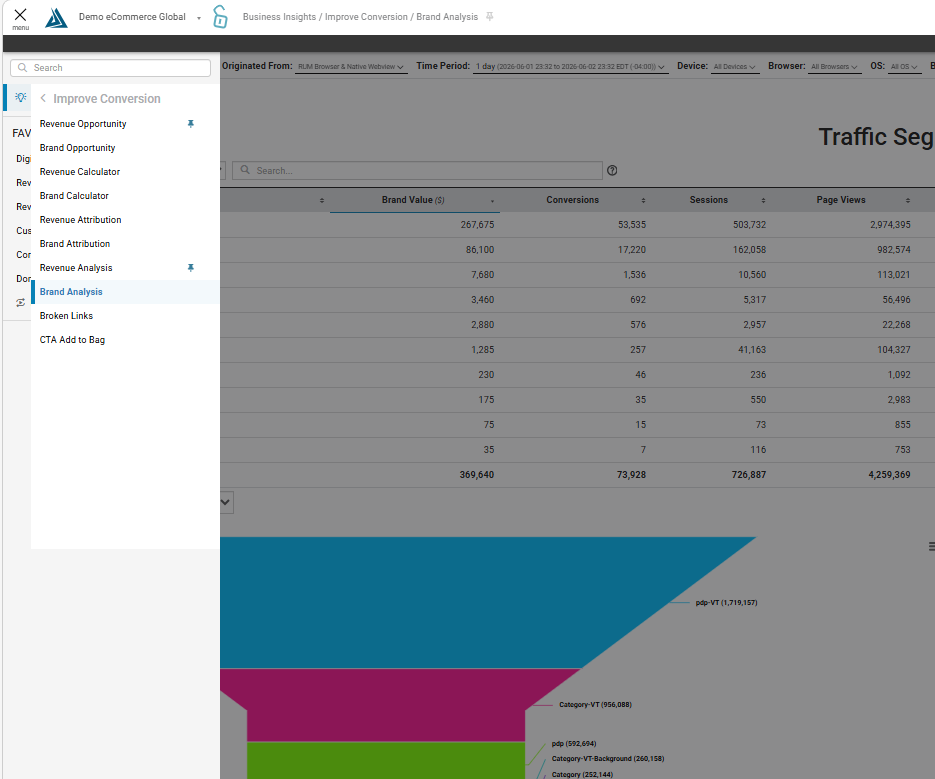
How to Find the Brand Analysis Page
The Brand Analysis Page can be found in the the left-side portal menu under Business insights, then Improve Conversion, then Brand Analysis.
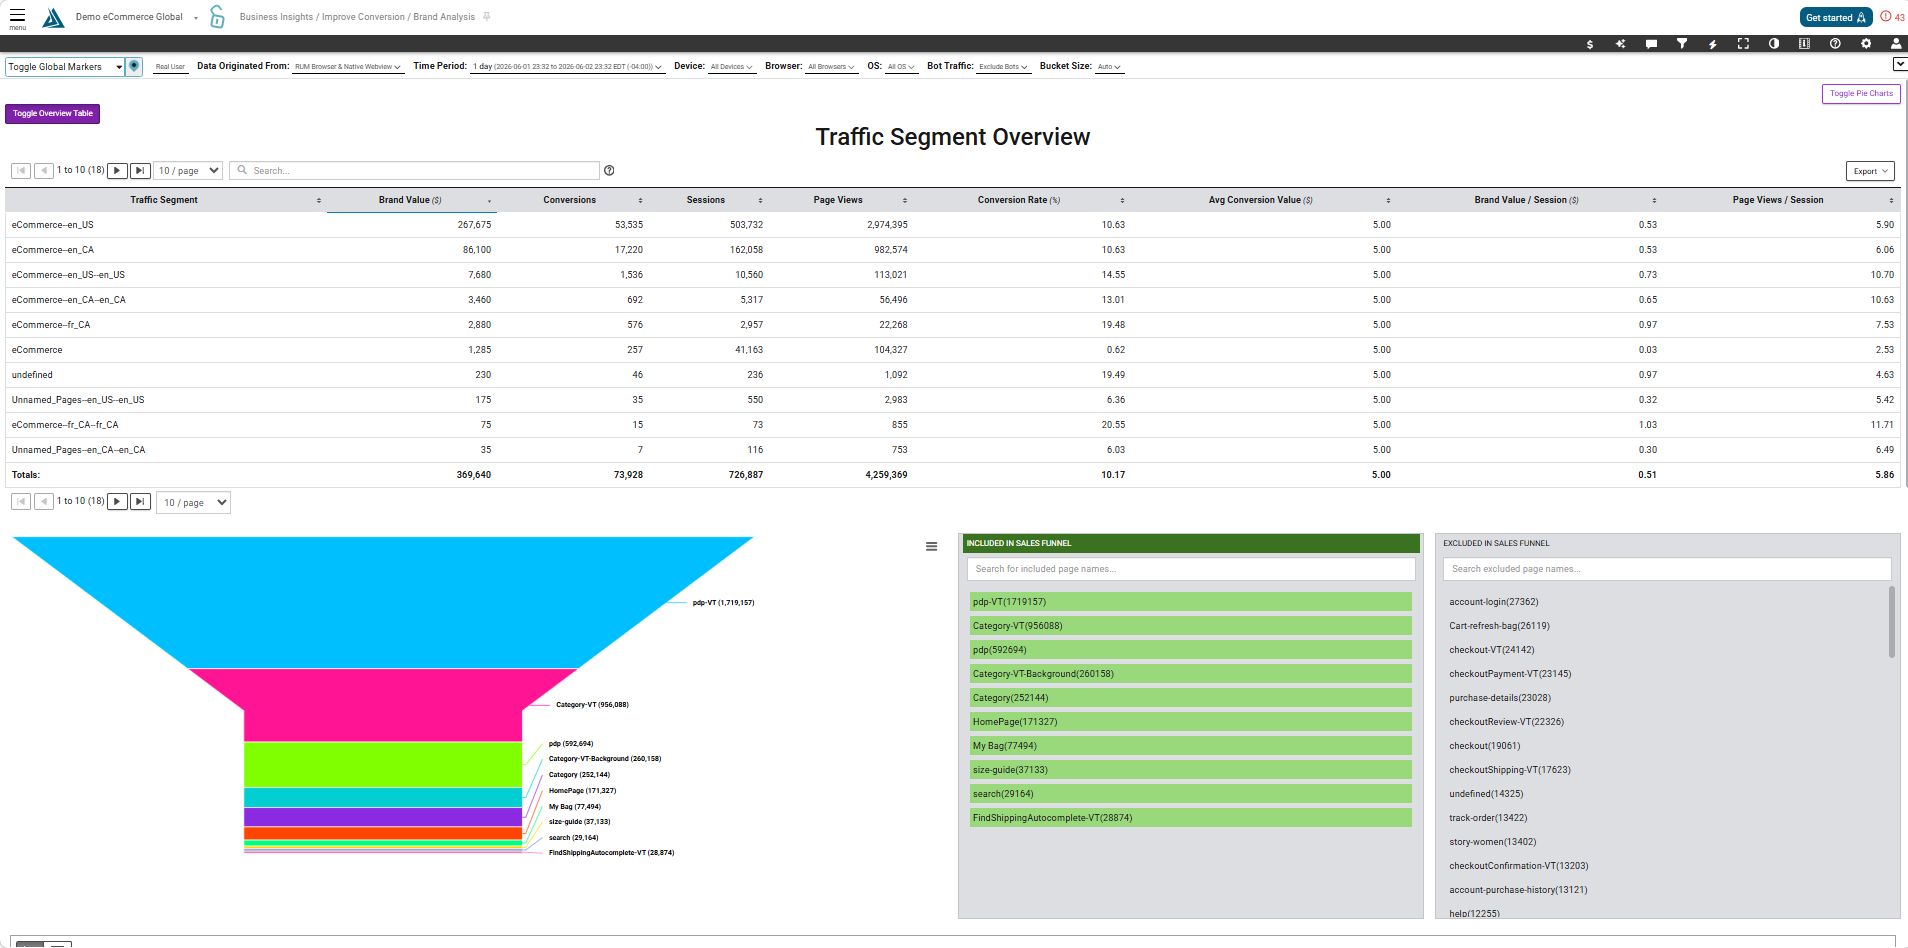
Traffic Segment Overview
When you first access the page, you will see your data from over the last 24 hours at the 80th percentile. The table at the top is an overview of the various traffic segments you have configured, and is sorted by revenue.
Sales Funnel
Below is the sales funnel. Each page is listed with the number of page views from the selected time period. Notice the two tables to the right. To add pages to the sales funnel, simply click and drag from the right to the left. To remove a page, do the reverse.
Graphs
Toggle each of these graphs into a table using the tabs on the left side of the graph. Click on a metric to add or remove it from the graph.