

Overview
The Broken Links report is designed to give you an idea of how many broken links there are on your site and on what pages they're on.
Accessing the Broken Links Report
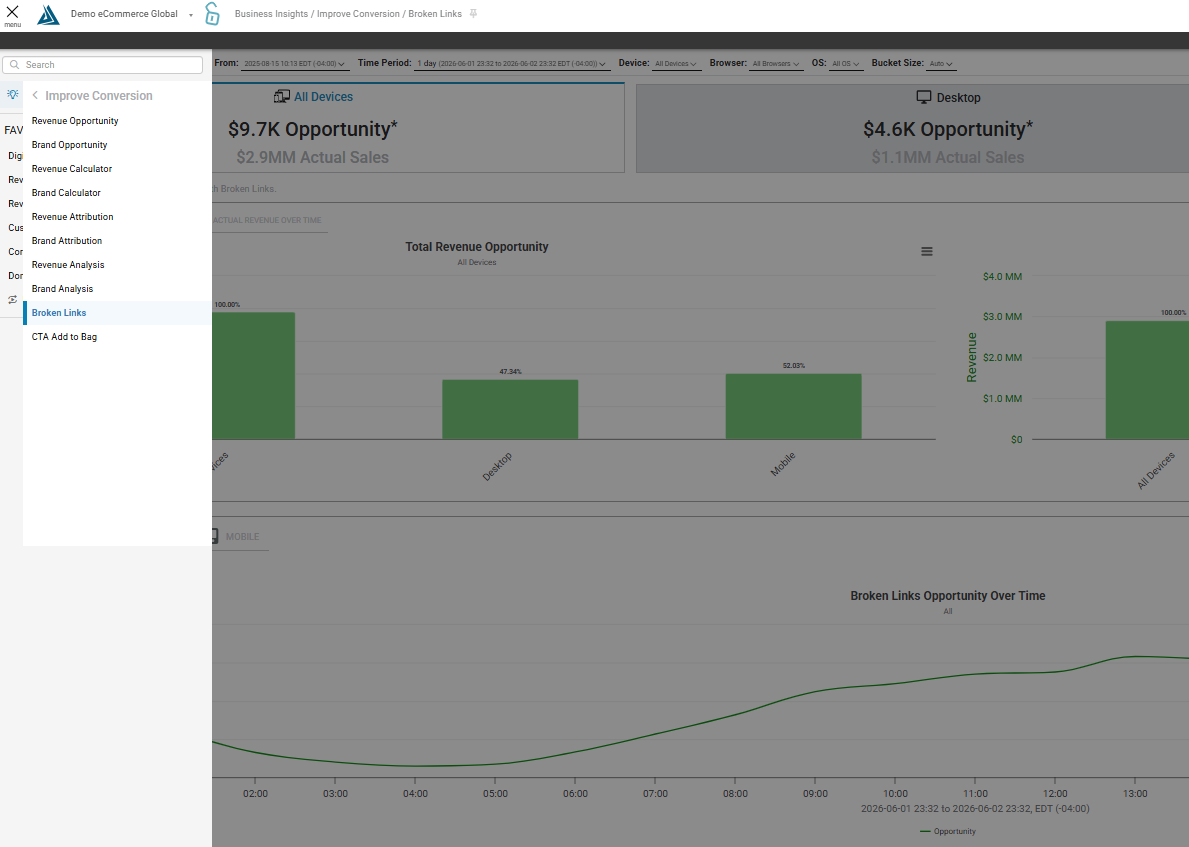
This report is accessible through the left side navigation menu under Business Insights, then Improve Conversion, Then Broken links.
Configuration
This page requires the set up of an Active Rule. To edit the rule, click either the "View Active Rule" button or the wrench icon, both available in the top left corner of the page.
Clicking the wrench icon opens the Broken Link Rules Version History menu:
From this menu create a new rule via the "+ Create New Version" button or view previous versions through the eye icons to the left of the version number.
Clicking the "View Active Rule" button will open the Rule Configuration window:
Choose the error page that indicates a broken link as well as define what a "Serious Shopper" session is.
How to Navigate the Broken Links Report
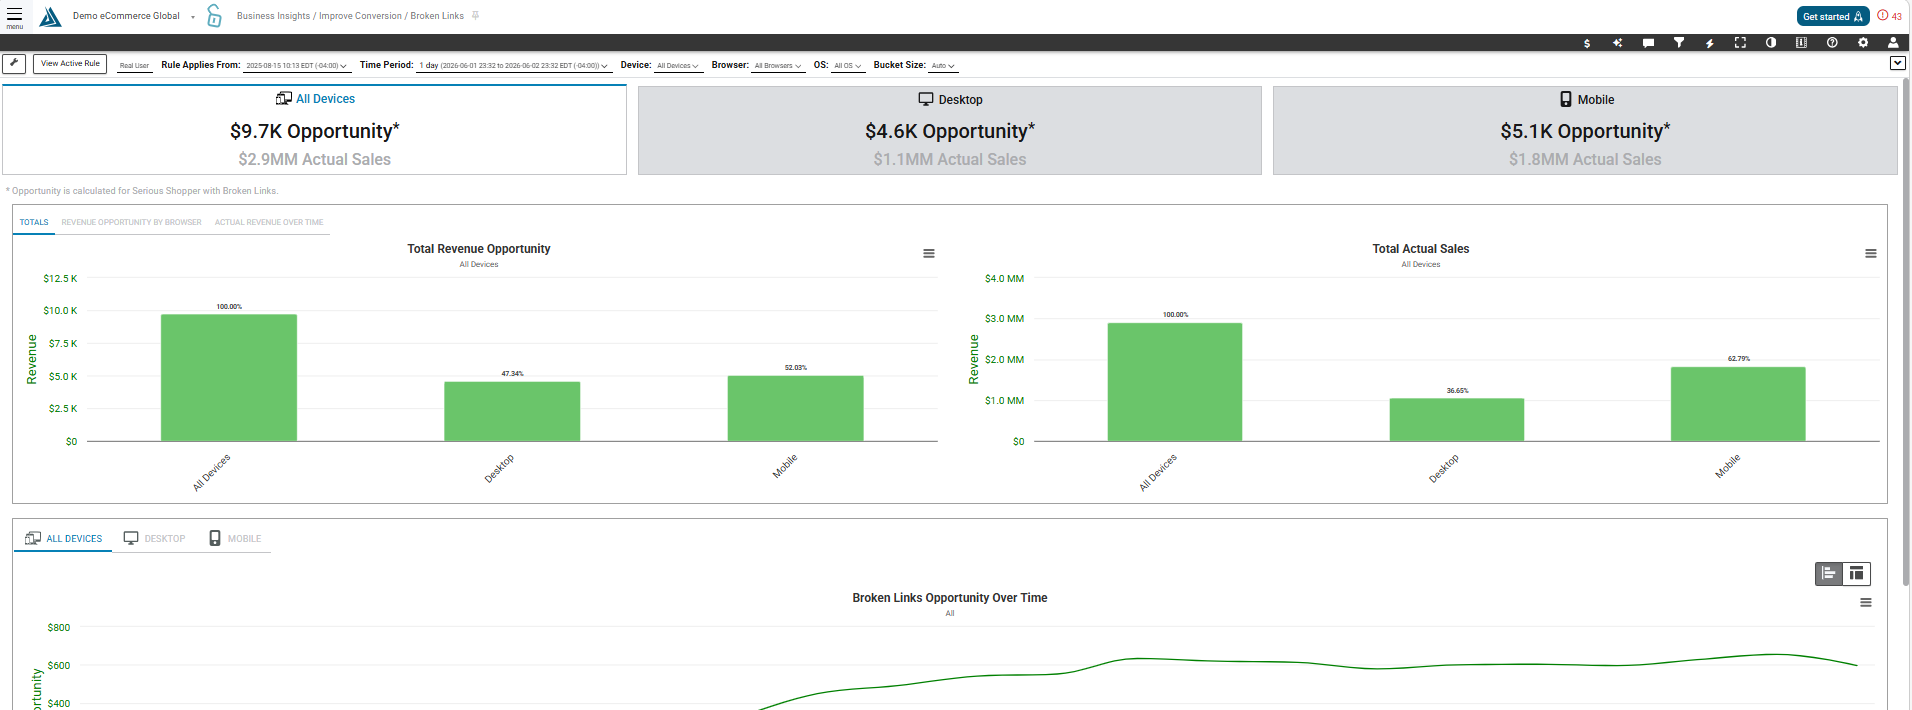
The first part of the report is the Revenue Opportunity by Device Type cards. These top cards are clickable and will filter the rest of the page to reflect the filter.
The tabs in the top left of the Revenue and Actual Sales graphs are clickable, allowing you to view Totals, Revenue Opportunity by Browser, and Actual Revenue Over Time. These graphs can be downloaded as a PNG, JPEG, PNG, or SVG through the hamburger menus indicated in the image below by red circles.
The next section is the Broken Links Opportunity Over Time graph. The clickable tabs at the top left corner will filter the rest of the page by the device type chosen. This graph can be downloaded through the hamburger menu on the right.

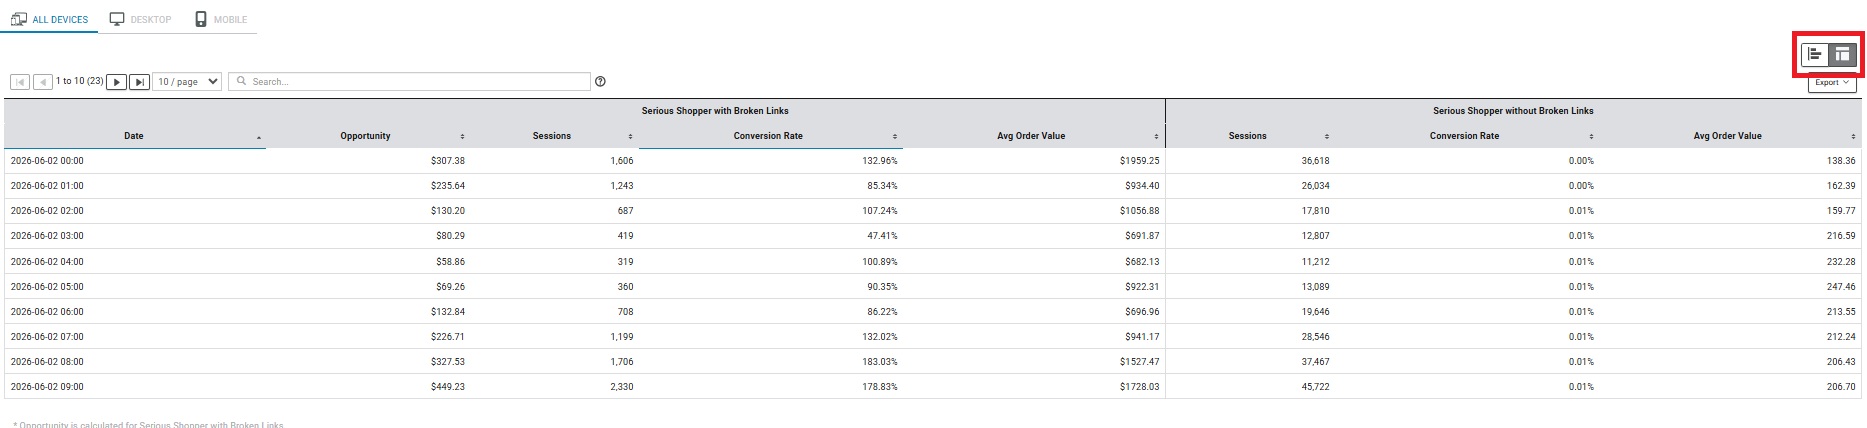
This graph is viewable as a table by toggling the set of buttons on the right side of the graph. From this view, export this data using the 'Export' button:
The part of the report is a table displaying Revenue Opportunity broken down by browser type, as well as the Actual Sales from both All Traffic and Serious Shoppers with/without Broken Links:
By clicking any of the purple buttons on the left side of the graph, a window will open displaying the data for the selected browser as a Broken Links Opportunity Over Time graph and a summary of this data in a table.
The last part of this page is a table that displays the Totals for All Traffic, All Serious Shoppers, and Serious Shoppers with/without Broken Links.
Click the Blue Triangle icon at the top left of this table to view our Customer Journey Analysis or RUM Performance Detail pages.