

Overview
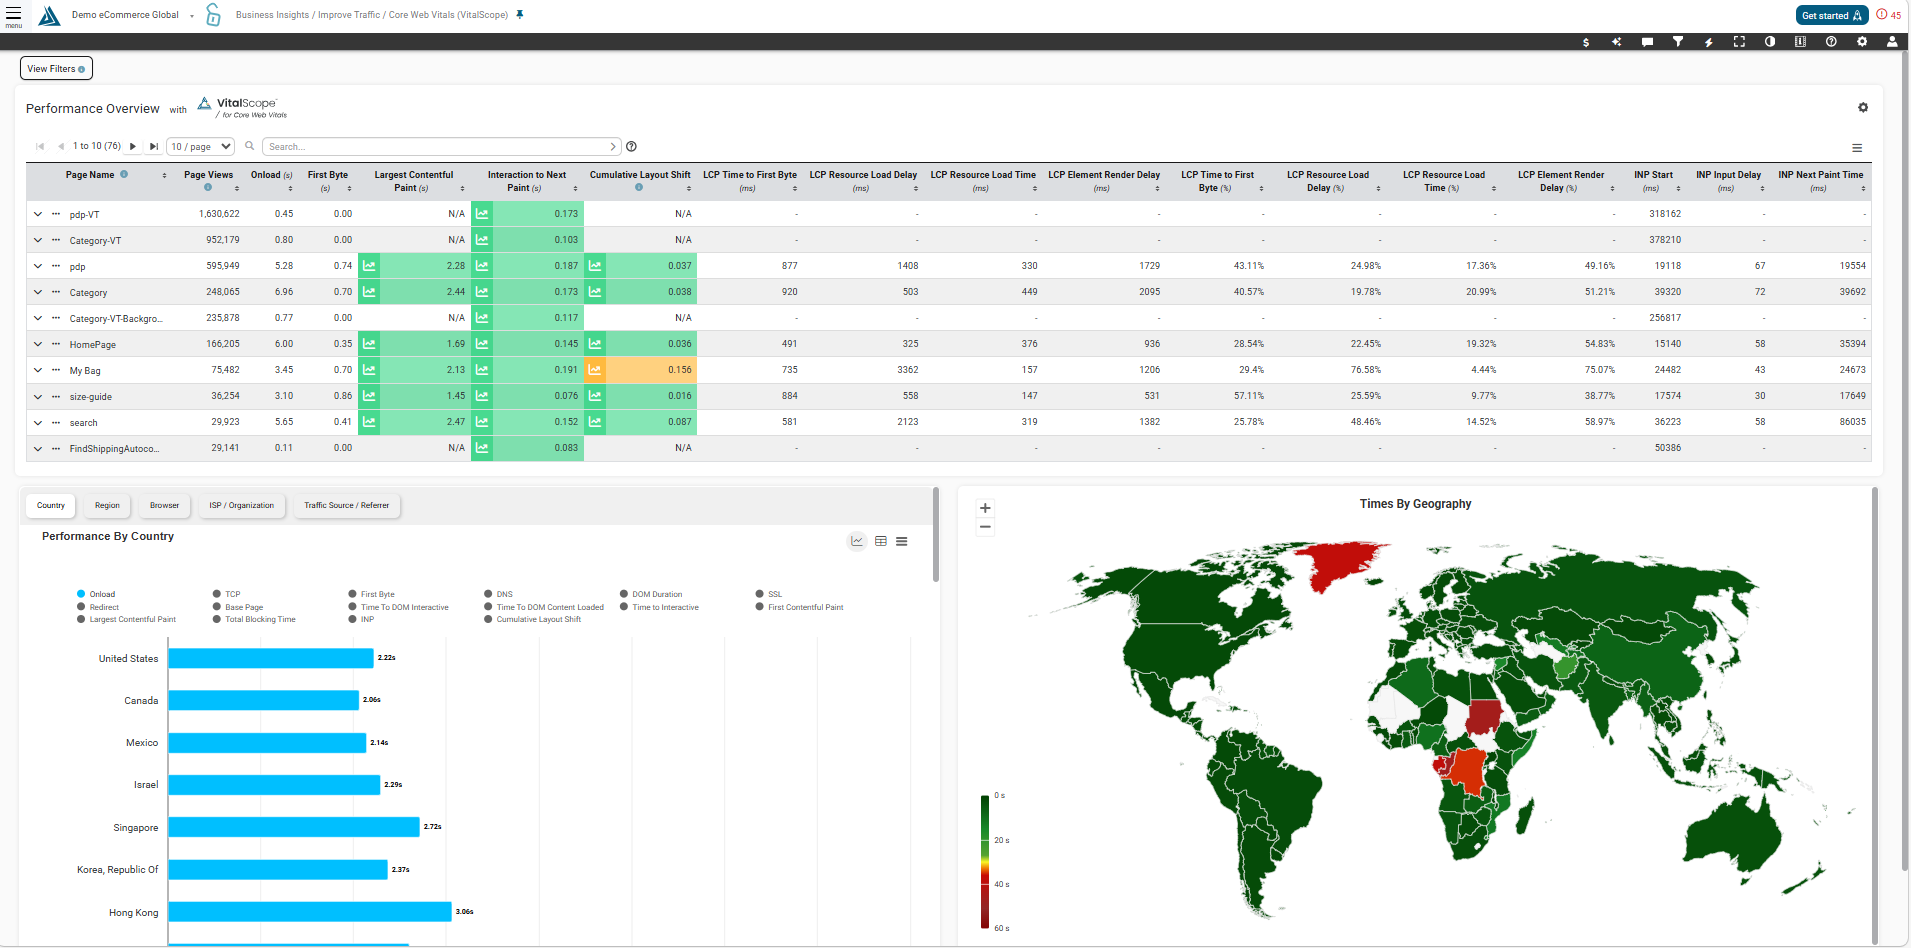
The Performance Overview page provides a high-level view of your site's performance data broken down by region, page, and more by utilizing the filtering options.
Accessing the Performance Overview Page
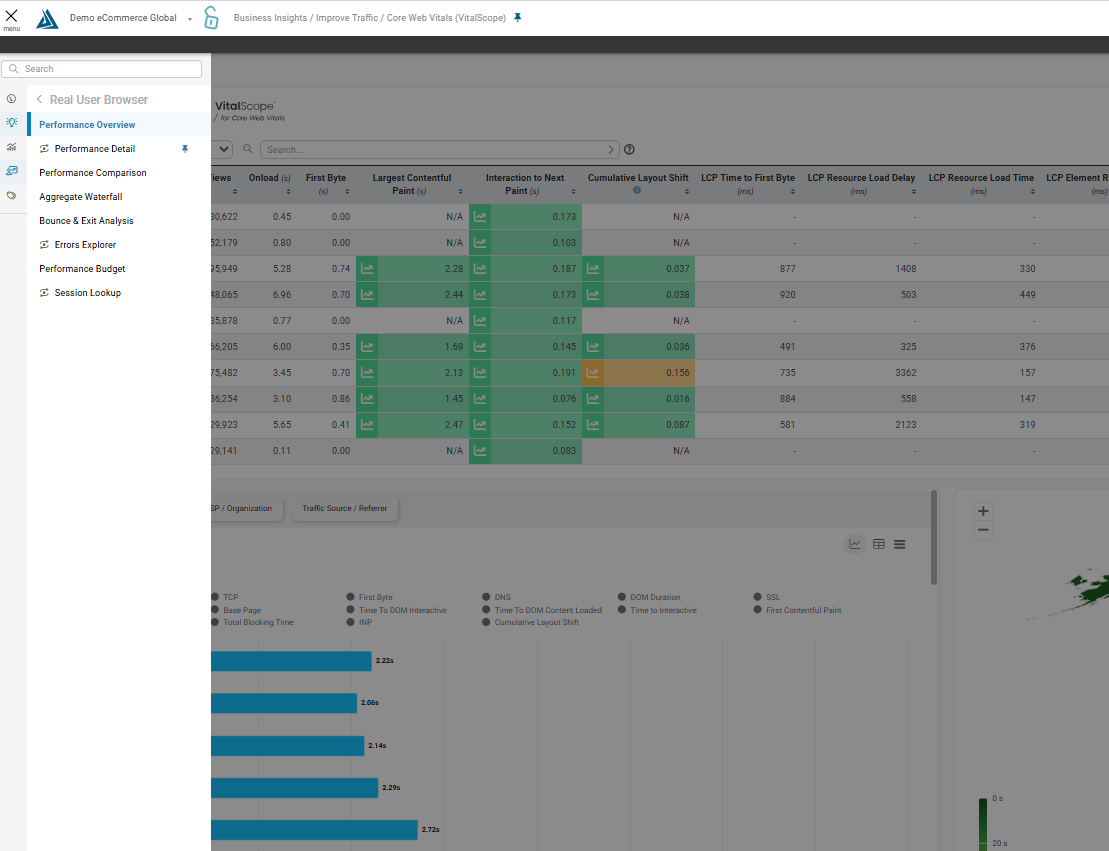
To find the Performance Overview Page, go to the main navigation menu on the top left of the BT Portal. Click on Monitoring, then Real User Browser, then Performance Overview
The Global Performance Heat Map
Filling up the bottom right of the page you will see a global heat map of performance. From the legend in the lower left we can see the darkest green is optimal performance and the darker red is the worst performance.
Click into a region to expand the graph and view the performance for the sub-regions. To go back to the full graph click Back to World Map in the top right corner of the page.
Performance Overview Table
First there is the Performance Overview table which breaks down the high-level metrics by page name.
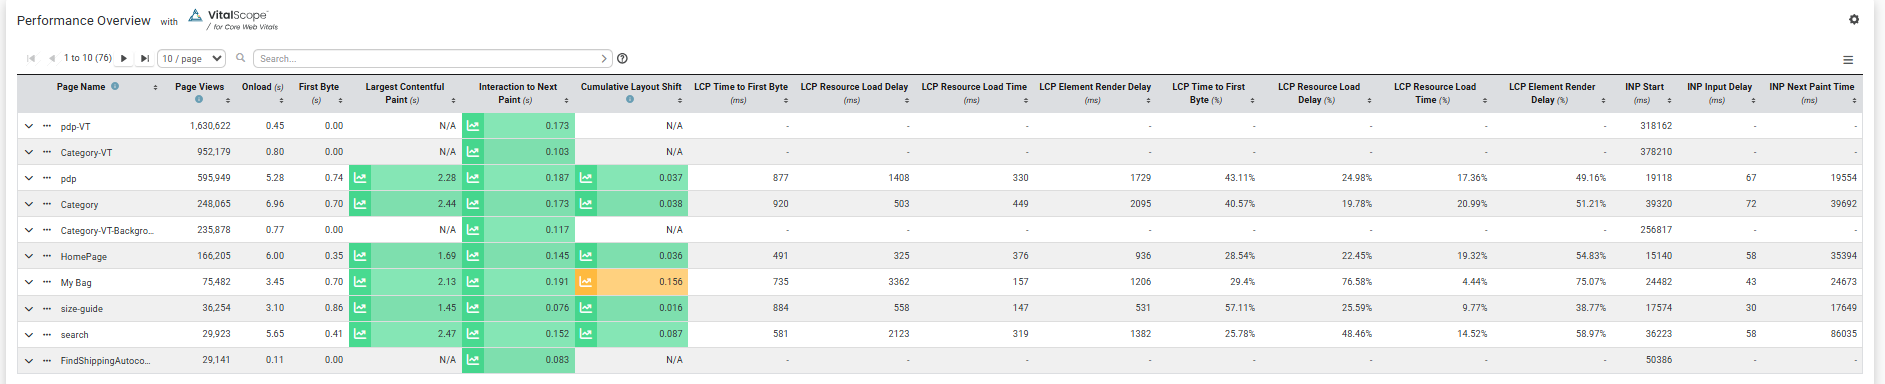
You can export this graph using the button in the top right of the table.
Performance Graph
You can view the data in a graph or table by clicking the graph and table icons in the top right. Click the tabs above the graph to switch between Country, Region, Browser, ISP, and Traffic Source.
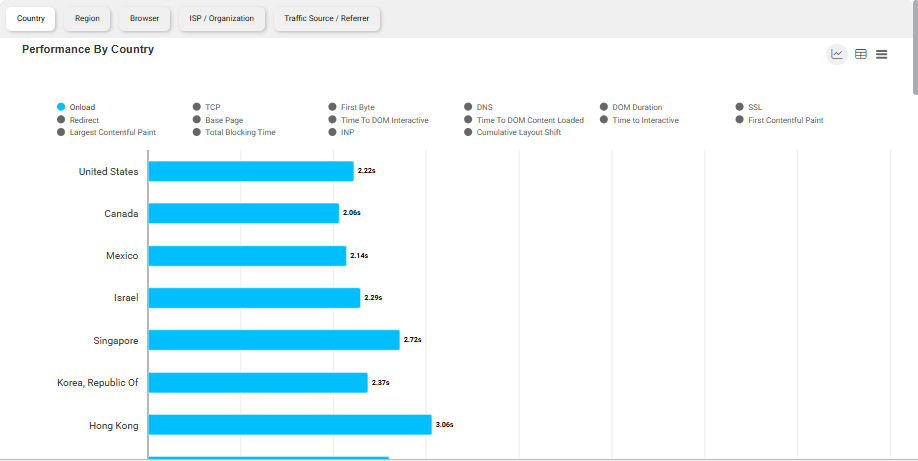
In each graph, you can click the legend items to hide and show different metrics in the graph.
Filters
To change the time period and filters you can use the selections at the top, or click the filter icon in the toolbar at the top of the page to view the full list of filters options.