

Summary
Tracking your JS errors allows you to prioritize and fix issues impacting your digital performance and experience. JS error tracking is available for both Real User Monitoring and Synthetic Monitoring. In this guide, learn:
-
How to identify and track your JS errors in Real User Monitoring
-
Where to find JS error reporting in dashboards
-
Error Event Listener Code Snippet
-
How we collect Data on Errors
Note: To have the most complete JavaScript Error data collection in Real User Monitoring, the script at the bottom of this article must be added to the top of the <head> tag on your site. Check it out >>
Identify and track your JS Errors for Real User Monitoring
-
Through the left-side navigation menu, go to 'Real User Monitoring' and select 'Errors Explorer'. For more information about this page, please checkout our Guide How to Use the Errors Explorer page.
-
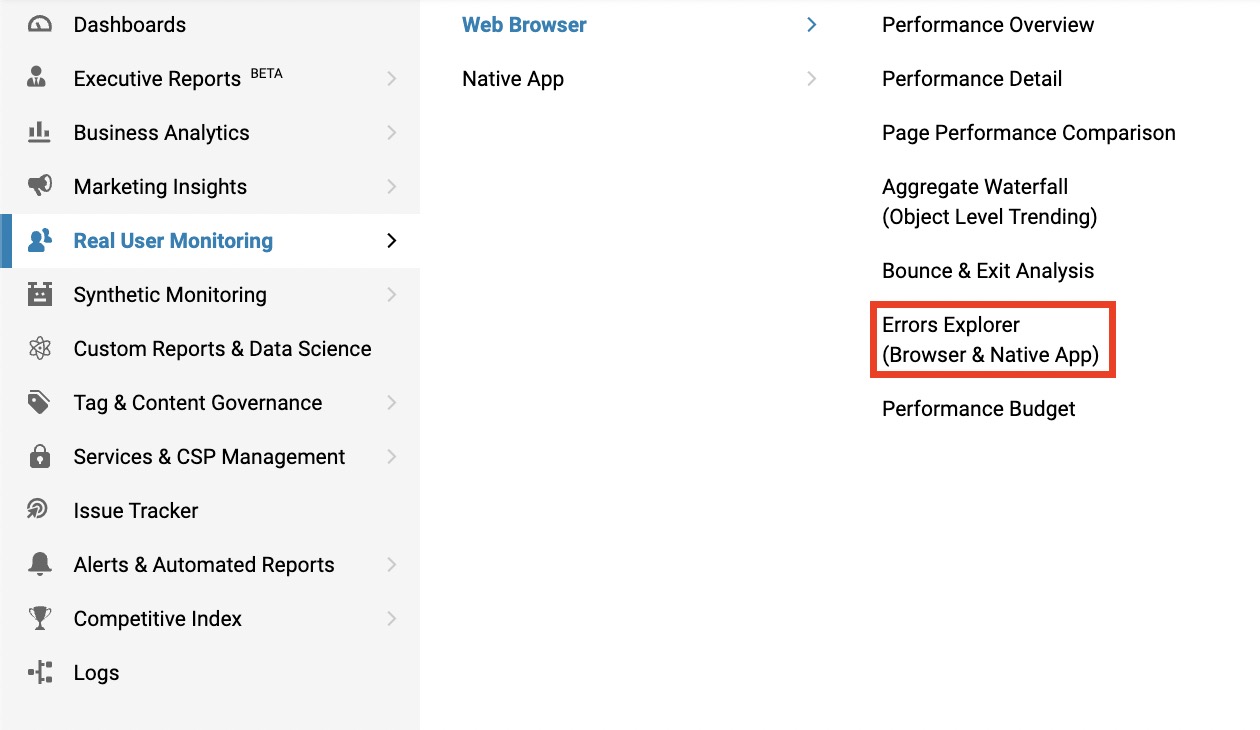
Where to find JS error reporting in dashboards
You will also find information about your JS errors in the Site Overview and Synthetic Site Health dashboards, which you can find on the Dashboards Page.
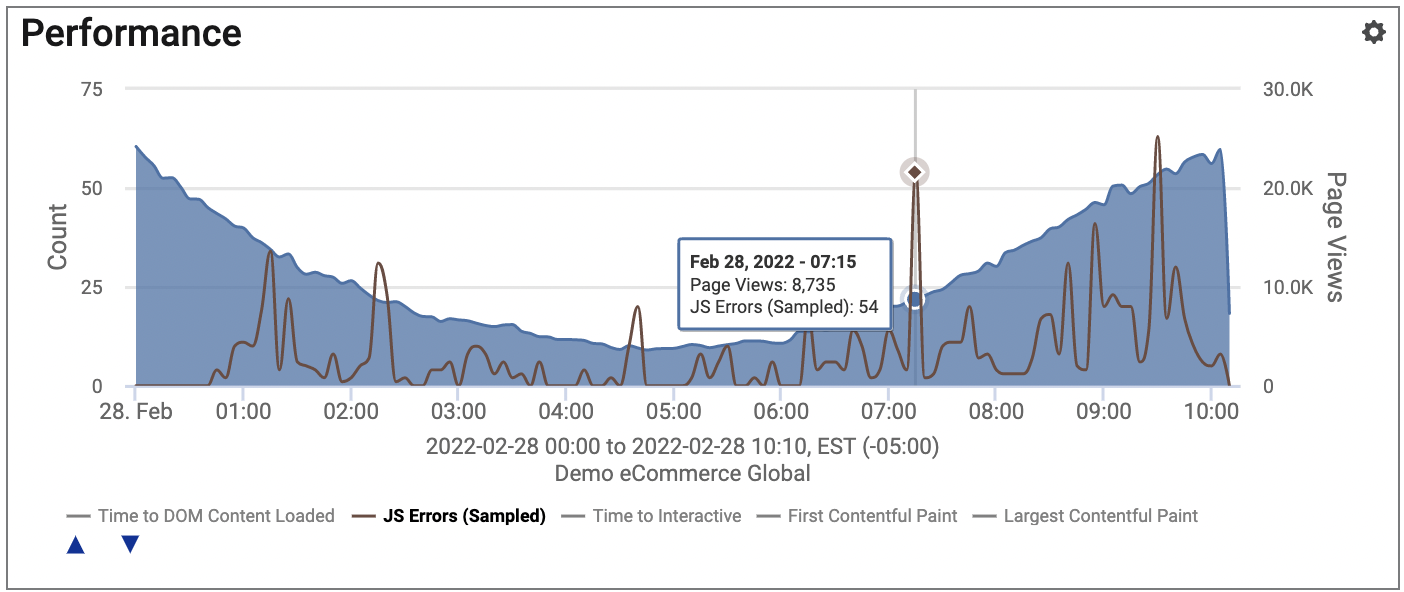
Site Overview (for Real User Monitoring)
This data can be found in the top left Performance Widget on your site's Site Overview dashboard. In this example we have toggled off all other data for this graph leaving only Page Views and JS errors. Hover over any point in this graph to view a detailed overview of this plot point.
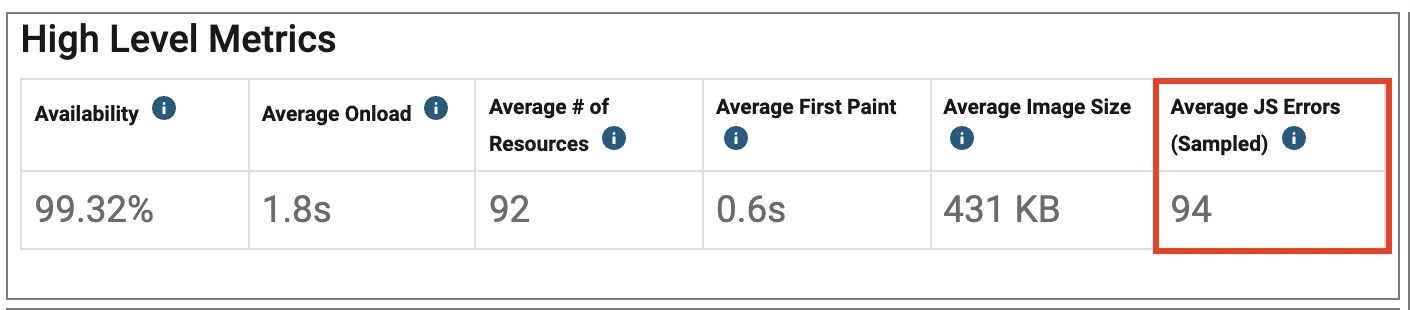
Synthetic Site Health (for Synthetic Monitoring)
This data is displayed in the High Level Metrics widget available on your site's Synthetic Site Health Dashboard.
Error Event Listener Code Snippet
Depending on the placement and loading order you have chosen for the btt.js, there may be JavaScript errors occurring before the tag loads on the page. This means our JavaScript Error data collection will be limited to only the errors occurring after our tag loads.
In order for Blue Triangle to collect additional JavaScript Errors occurring on your website, we encourage you to add the following snippet to the top of the <head> section of the page. This code snippet can also be found in the CSP manager:
<script>
try{window.performance.setResourceTimingBufferSize(400)}catch(e){}
  try{var _bttErrorListener=_bttErrorListener||function(b,c)
    {var d=[],e=[];b.addEventListener&&b.addEventListener("error",function(a){
      "undefined"==typeof _bttErr?d.push(a):_bttErr.capture(
        a.message,a.filename,a.lineno,a.colno,a.error
        )
      });c.addEventListener&&c.addEventListener(
        "securitypolicyviolation",function(a){"undefined"==typeof _bttErr?e.push(
          [a.blockedURI,a.lineNumber,+new Date,a.sourceFile,a.disposition]
          ):_bttErr.captSec(
            a.blockedURI,a.lineNumber,+new Date,a.sourceFile,a.disposition
            )
          }
        );return{get:function(a){
          return"a"==a?d:e}
          }
      }(window,document)}catch(b){_bttErrorListener=void 0};
</script>
This code is used by Blue Triangle to collect JavaScript Errors and CSP Violations prior to the btt.js being added to the page. It simply saves the JavaScript errors that happen before the btt.js loads in order for it to use when the btt.js is added to the page.
This snippet also expands the browser's Resource Timings buffer size from the 150 default to 400, which allows us to collect much more of your real user resource timing data. The btt.js tag naturally does this when it loads on the page, but in some cases it may not be early enough to collect the data from the beginning of the page load. Adding this snippet to the <head> will max out the buffer size from the outset, allowing us to collect as much resource timing data as possible. This is another great reason we encourage you to put this snippet on your web pages.
We do not recommend adding the btt.js to top of the <head> section, only the code snippet above.
How We Collect Data on Errors
RUM Error Collection Methods
-
JS Errors: The Blue Triangle RUM Tag collects basic JavaScript errors through the global “onerror” event listener. Information on this can be found at https://developer.mozilla.org/en-US/docs/Web/API/GlobalEventHandlers/onerror.
-
CSP Violations: The CSP errors are collected through SecurityPolicyViolationEvent (https://developer.mozilla.org/en-US/docs/Web/API/SecurityPolicyViolationEvent). Any time a CSP error occurs, that event is triggered.
-
XHR and Fetch Errors: The XHR/fetch errors are collected whenever our XHR/fetch wrappers detect anything greater than a 400 HTTP status code and reports them back to Blue Triangle’s error collection system in the cloud.