

Overview
The Performance Budgets page allows you to see how your key performance and content metrics are doing compared to your defined budgets.
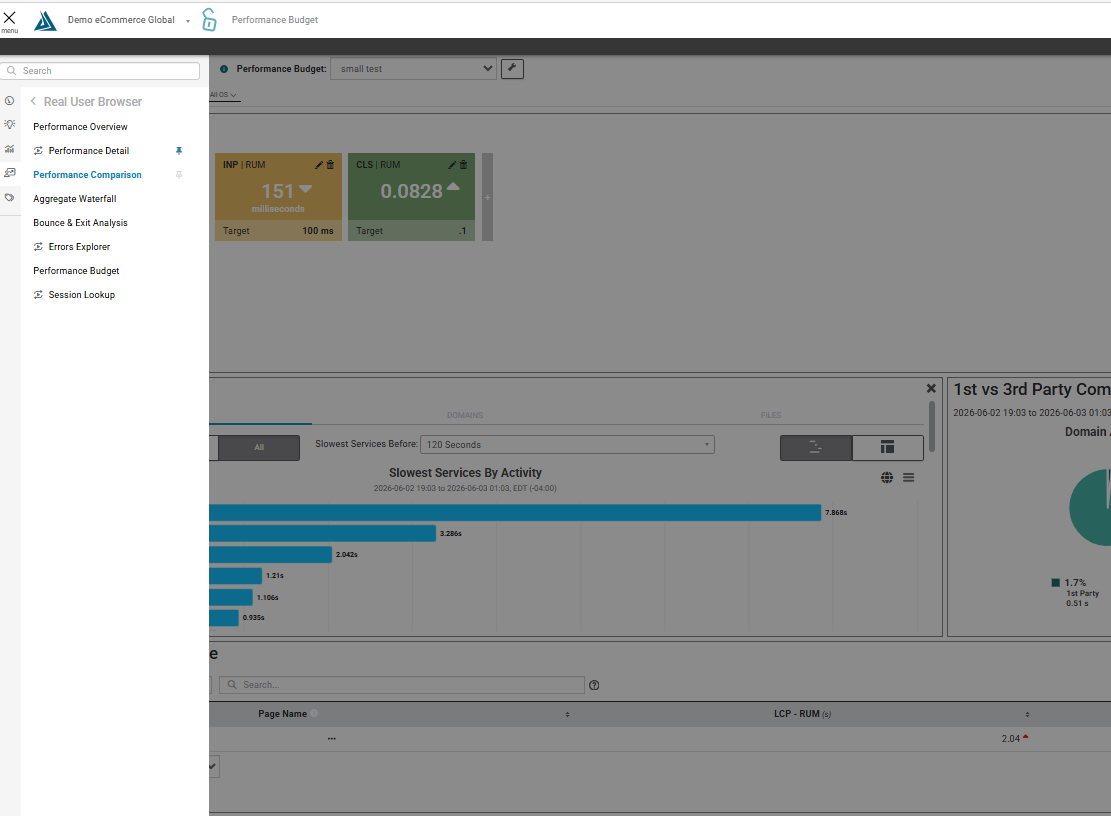
How to Find the Performance Budgets Page
The Performance Budgets page is located on the left side navigation menu under both Monitoring, then Real User Browser
RUM:
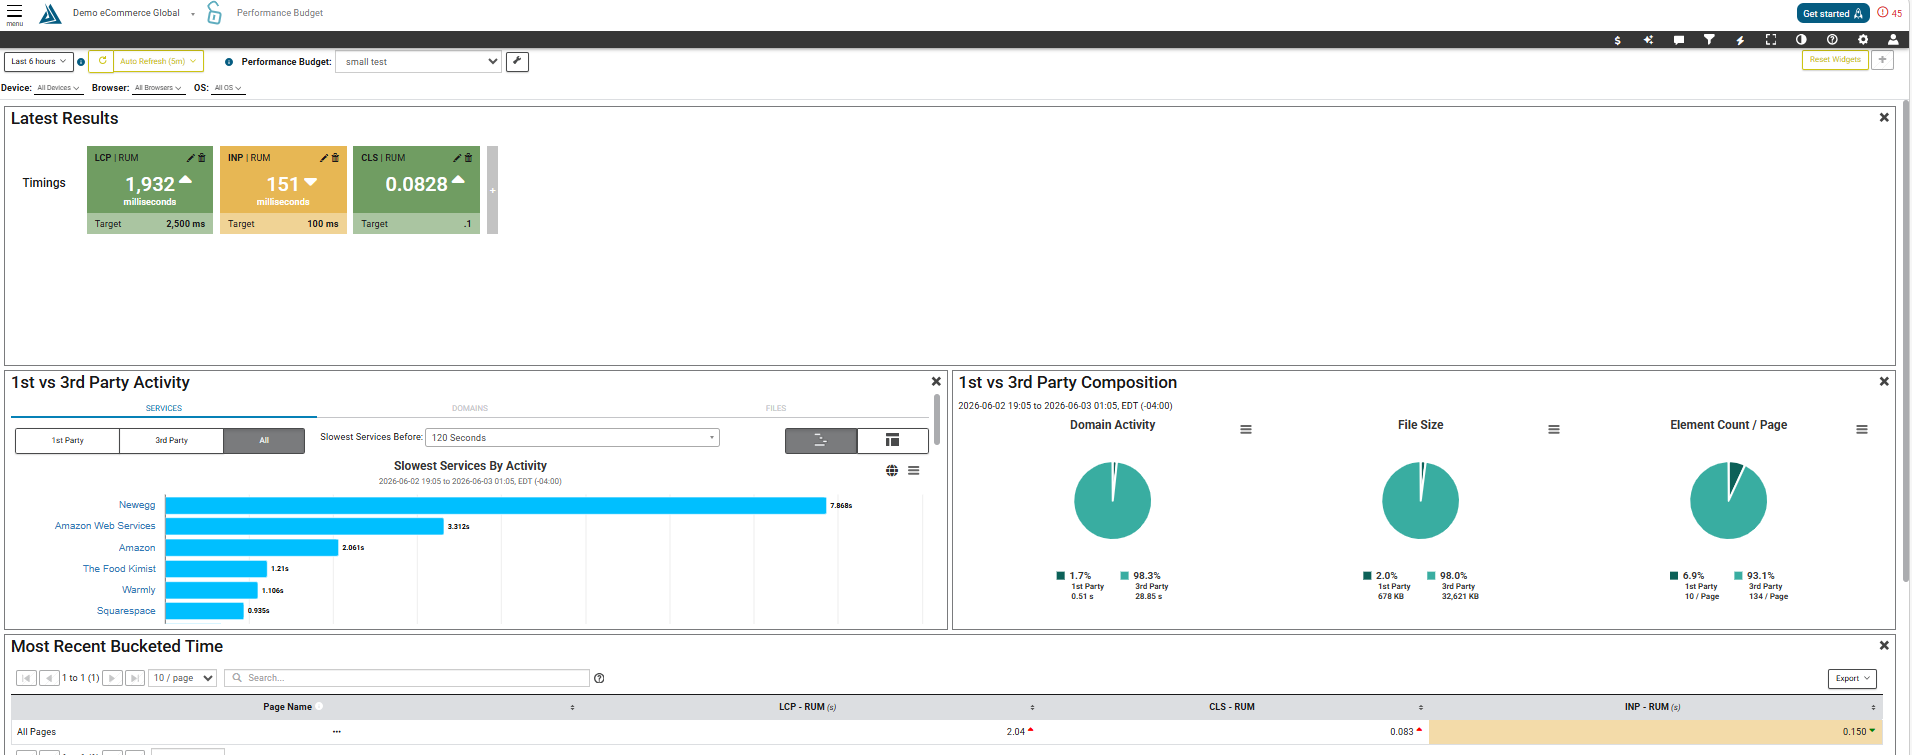
How to Navigate the Performance Budgets Page
This page allows you to utilize all filter options and metrics to track them in a dashboard in the Blue Triangle portal. The Performance Budget is entirely customizable to fit the specific metrics that you want to be able to track. You can view the data either across the entire site or page by page for the specified lookback period.
Latest Results
These cards, pictured below, change color to indicate how your site or page is doing in relation to Google's recommended threshold for each of these metrics by default, however, these thresholds are customizable. Use the buttons at the top right of each card to edit or delete an individual card.
To add a card, click the plus icon next to each row of cards.
Please not that once this page is refreshed, all filters are reset to default.
1st vs 3rd Party Activity
In this widget you can view the Slowest Services by Activity by duration in seconds as a bar graph. You can toggle between first party, third party, and all services. In this example, we are viewing Real User data over the last six hours.
1st vs 3rd Party Composition
This widget organizes the data for 1st and 3rd party content over the selected time period into a pie graph. The pie graphs separate this data into three categories: Domain Activity, File Size, and Element Count/Page. Each of these graphs can be saved individually as a JPEG, PNG, PDF, or SVG file.
Most Recent Bucketed Time
In this widget, the data for the selected metrics and assets is displayed for the most recent bucketed time separated by page. Bucket size can be either daily or hourly. You can edit which pages you are specifically viewing in the right-side filtering menu. Otherwise, the widget will show the data for all pages by default.
Timings
This widget organizes the timing of each selected metric into a line graph and includes lines indicating the target value and thresholds for each metric.
Assets
In this widget, the timing of each asset is organized into a line graph including lines for the red and amber thresholds, as well as the target value for the load time of the asset (JS, CSS, and images).