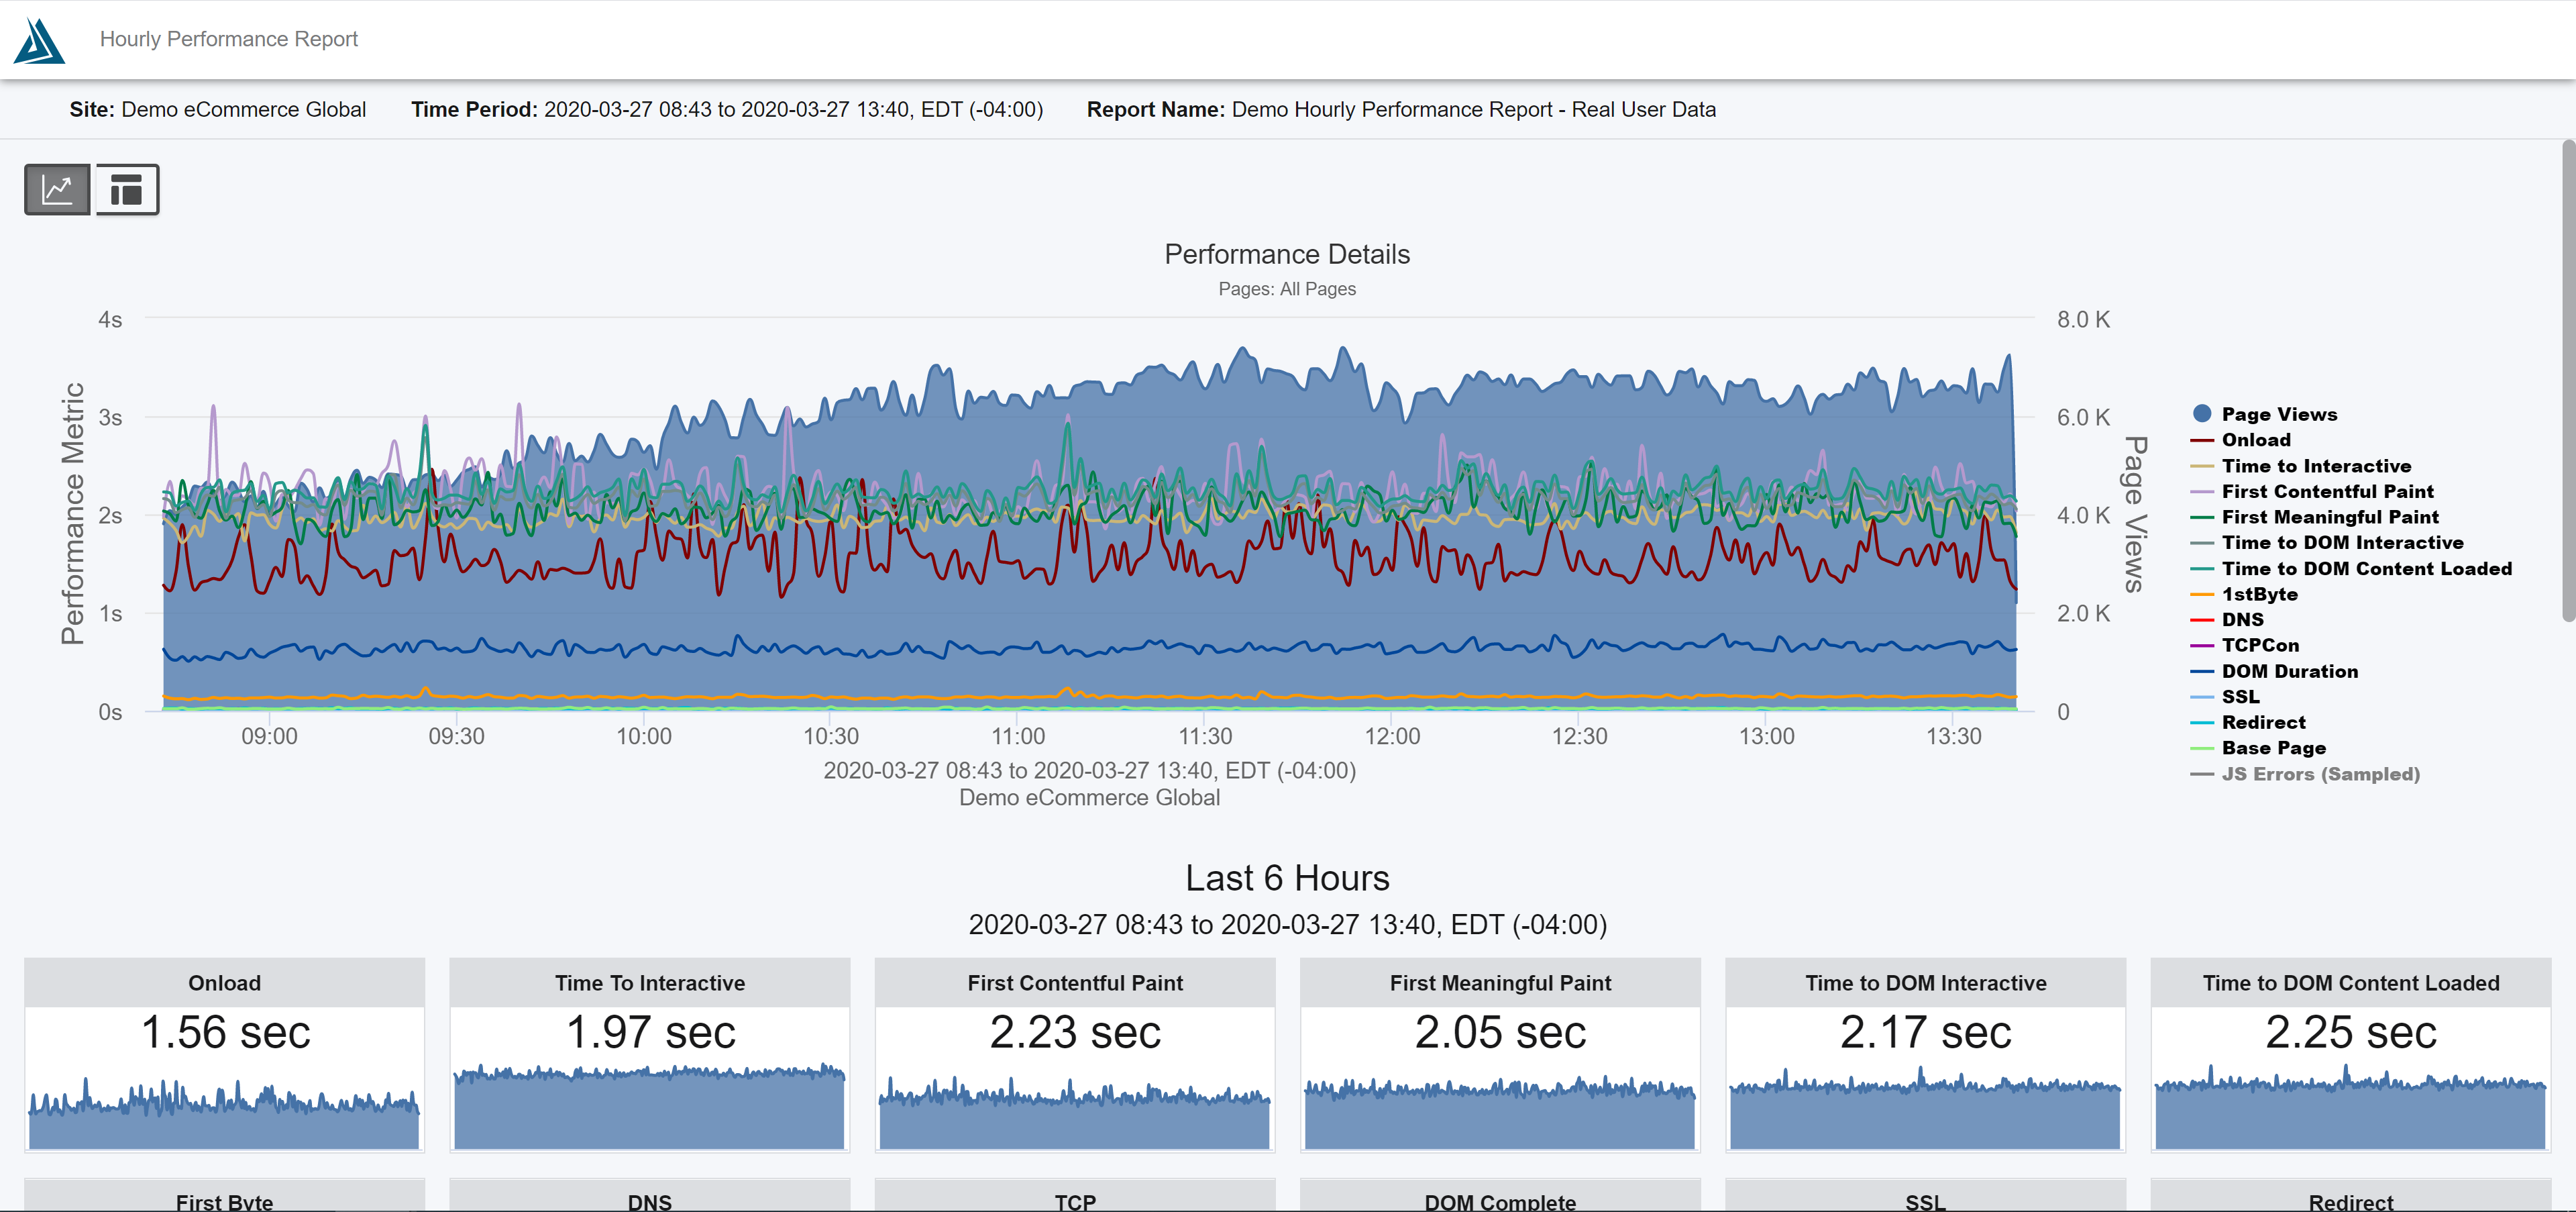
Preview:
Summary:
The Hourly Performance Report allows you to see site performance for the last few hours along with the performance for the last 30 days. First, we'll discuss how to configure this report and after that we'll go through each of it's components.
How to Configure an Hourly Performance Report
The Hourly Performance Report is available for both Real User and Synthetic data. After choosing it in the report creation wizard, you'll notice it will be set to send every 4 hours. Currently this is a static number, but if you're interested in seeing more options feel free to post a feature request in our community.
The next thing you can do is set your filters. Here you can slice and dice the data by traffic segment, page name, device, country, region and more.
For general instructions on setting up and configuring a report, checkout our guide on How to Create and Manage Automated Reports.
Performance Trend Graph

The performance graph shows all of the metrics for your real user or synthetic data over the last 6 hours. The shaded blue area represents the number of page views over time. The rest of the lines are the available performance metrics including Onload, DomComplete, Time to DOM Content Loaded, etc.
Last 6 Hours

As you can see the Last 6 Hours section shows you the trend for each available metric over the last 6 hours. You can mouse over the graph to see a tool-tip reading of each data point. This section will show data minute-by-minute.
Last 30 Days

This section shows you the trend for each available metric over the last 30 days. You can mouse over the graph to see a tool-tip reading of each data point. This section will show data day-by-day.


Comments
0 comments
Please sign in to leave a comment.