Preview:

Summary:
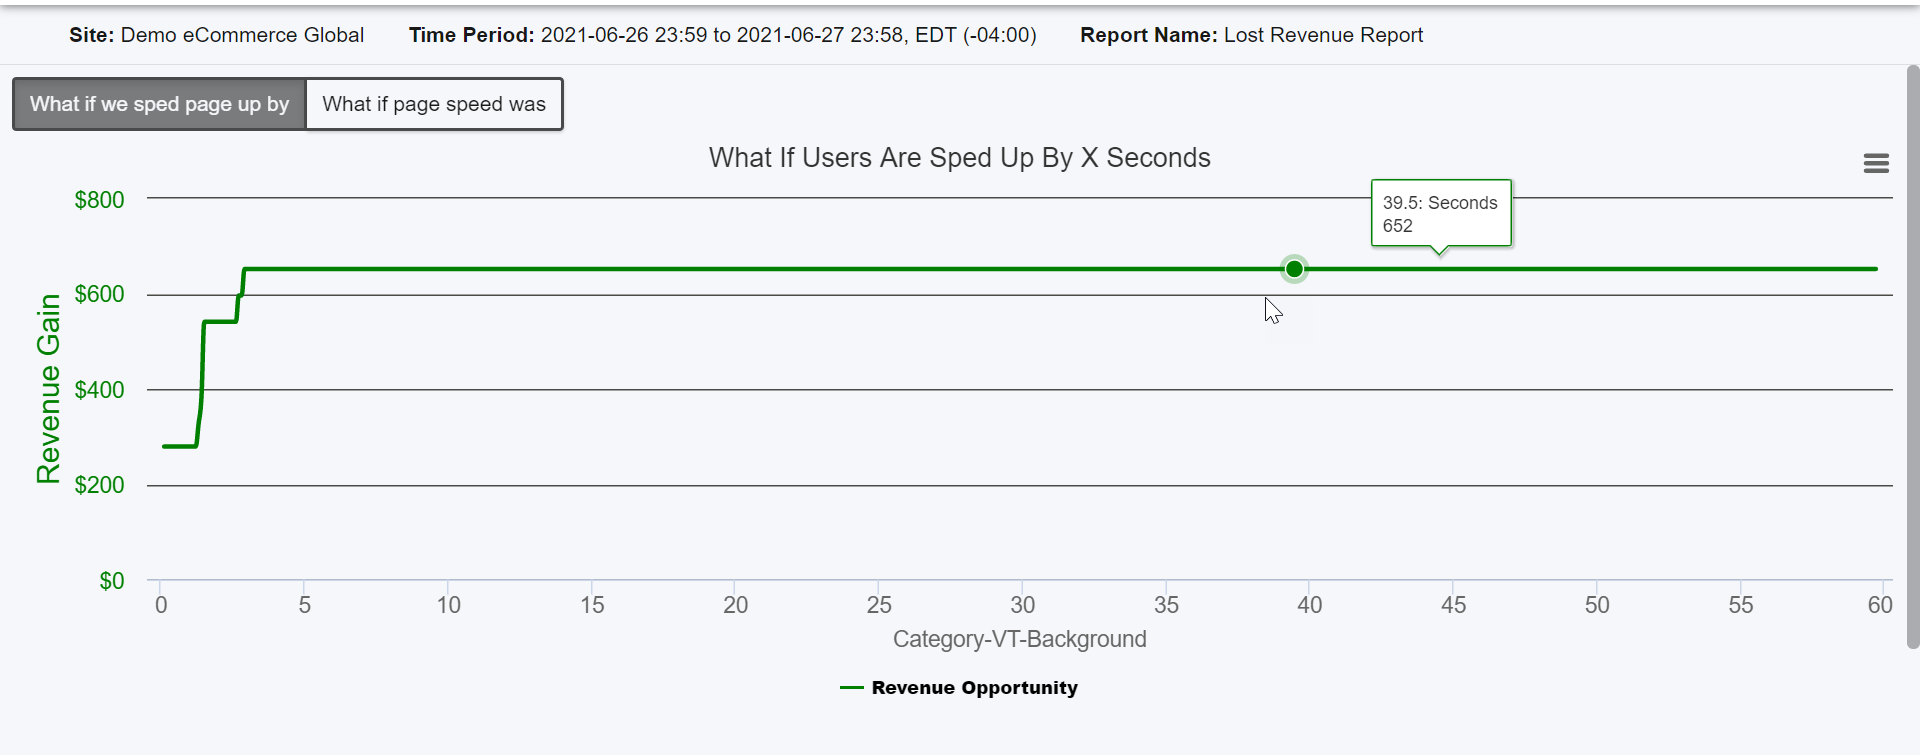
The Lost Revenue Report shows you the revenue opportunity lost due to page speed, and it calculates how much money you would have made if you improved site speed.
How to Configure a Revenue Opportunity Report
Configuring a Revenue Opportunity Report is quite simple - follow along with the configuration wizard and choose your filter options at the end.
The only difference in the options between this report and others is the Conversion Type. For most of you, this will be revenue. But if your site doesn't do monetary transactions, you can instead use "Brand" which can be configured by your Customer Success Manager.
How to Analyze the Revenue Opportunity Report
This report shows you the additional revenue gain you could have made if page speed was x, and this is all in the context of the given time period.
Additionally, notice the drop-down selector under the graph to the left. By selecting this you can toggle between 2 different views for the graph. One shows the analysis for "what if page speed was [x seconds]" and the other shows "what if we speed page up by [x seconds]."
You'll see the time period listed in the graph subtitle above the legend, and below the graph to the left you can find the selected filter options - including site, traffic segment and more.
The table at the bottom of the page shows you the data in the graph in a tabular view. You can see the numbers for page speed in seconds and the revenue gain potential next to that.

Comments
0 comments
Please sign in to leave a comment.