
Table of Contents
- Overview
- What information does this report provide?
- How to Configure a 30-Day Domain Report
- Run the report now
- About the Average Load Time by Domain section
Overview
The 30-Day Domain Report is a great tool for analyzing the content on your site from a high-level glance to individual domain performance.
What information does this report provide?
The 30-Day Domain Report looks at one page and:
- gives the average duration of all resources on a domain over the past seven days,
- compares the daily values to the 30-day average for that domain,
- trends performance on the page for all page views,
- trends performance on the page for all views with resource timings collected (only certain browsers collect web content detail data), and
- shows domain- and object-level aggregate waterfalls for the past seven days.
How to Configure a 30-Day Domain Report
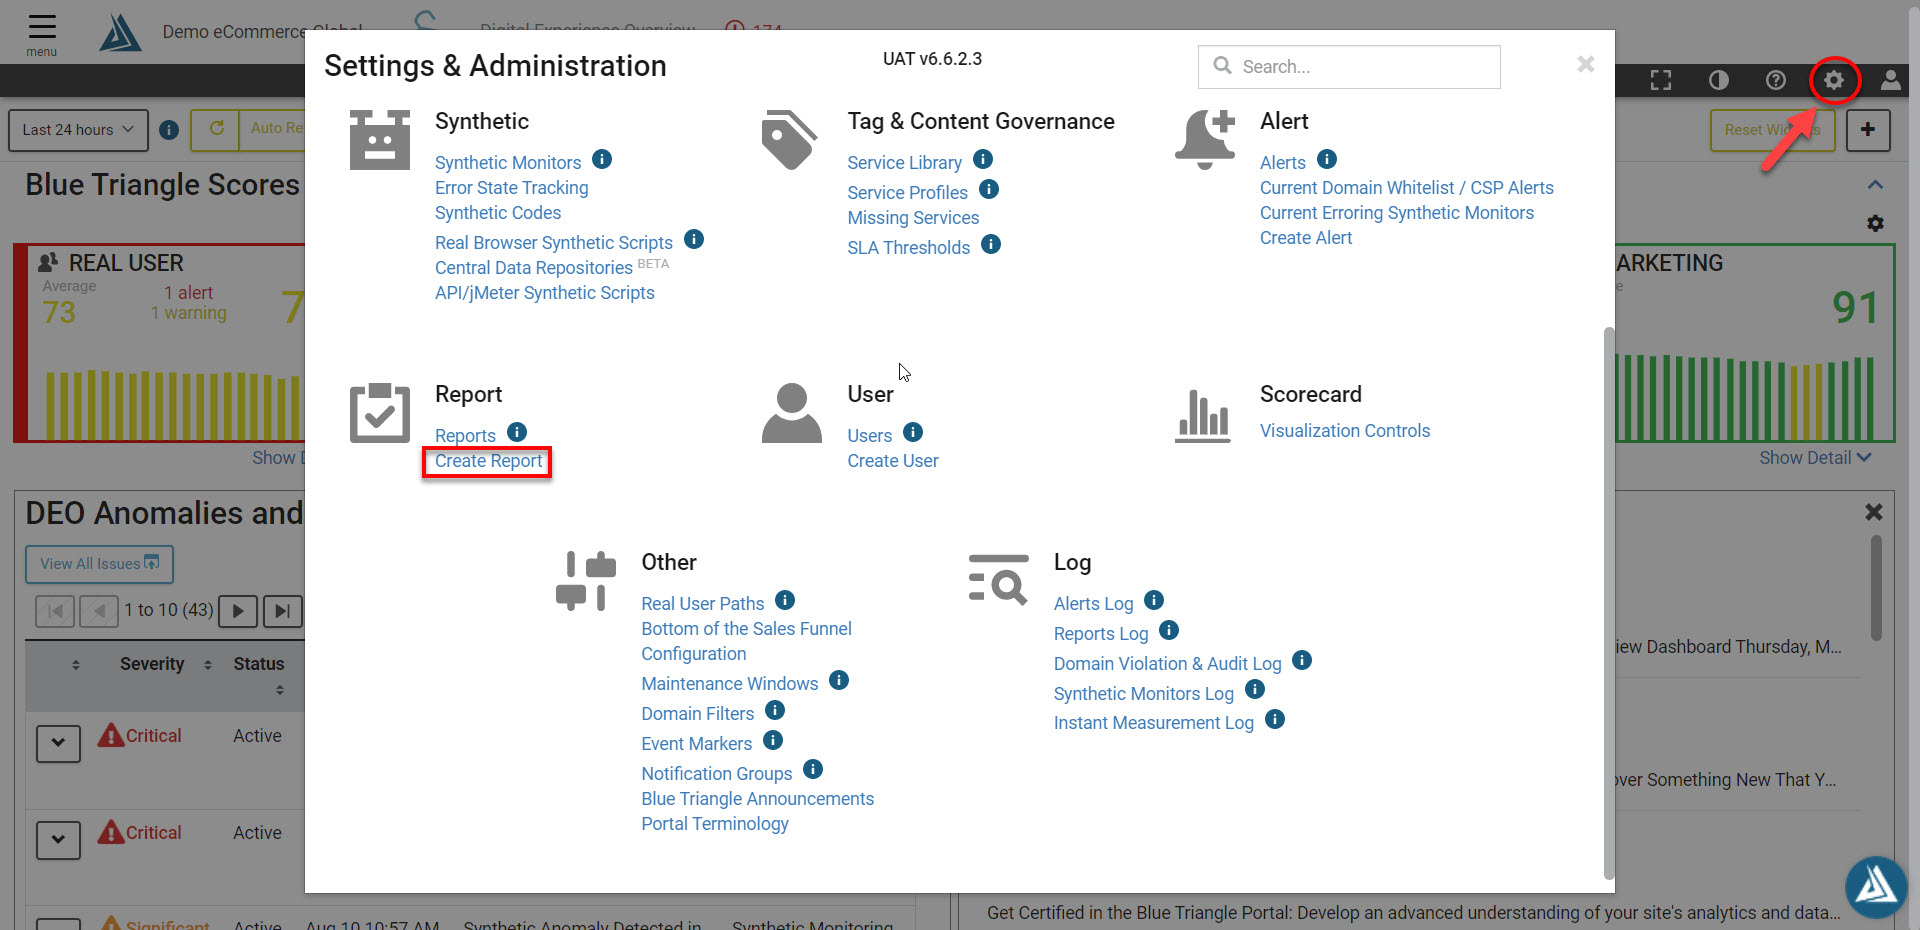
To begin, click on Settings icon shaped like a gear in the toolbar at the top of the page.
Go to Report and click Create Report
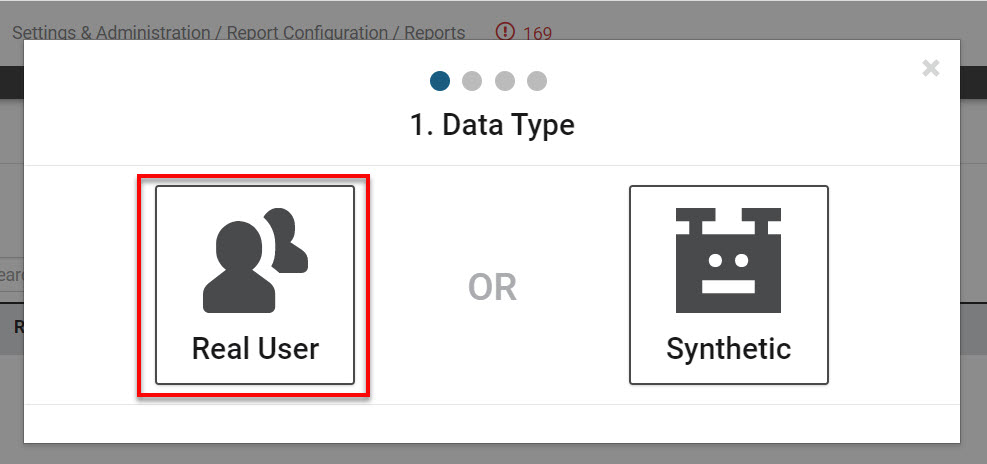
This should pull up a Create Report window that will first ask for the Data Type. To configure a 30-Day Domain Report, click Real User.
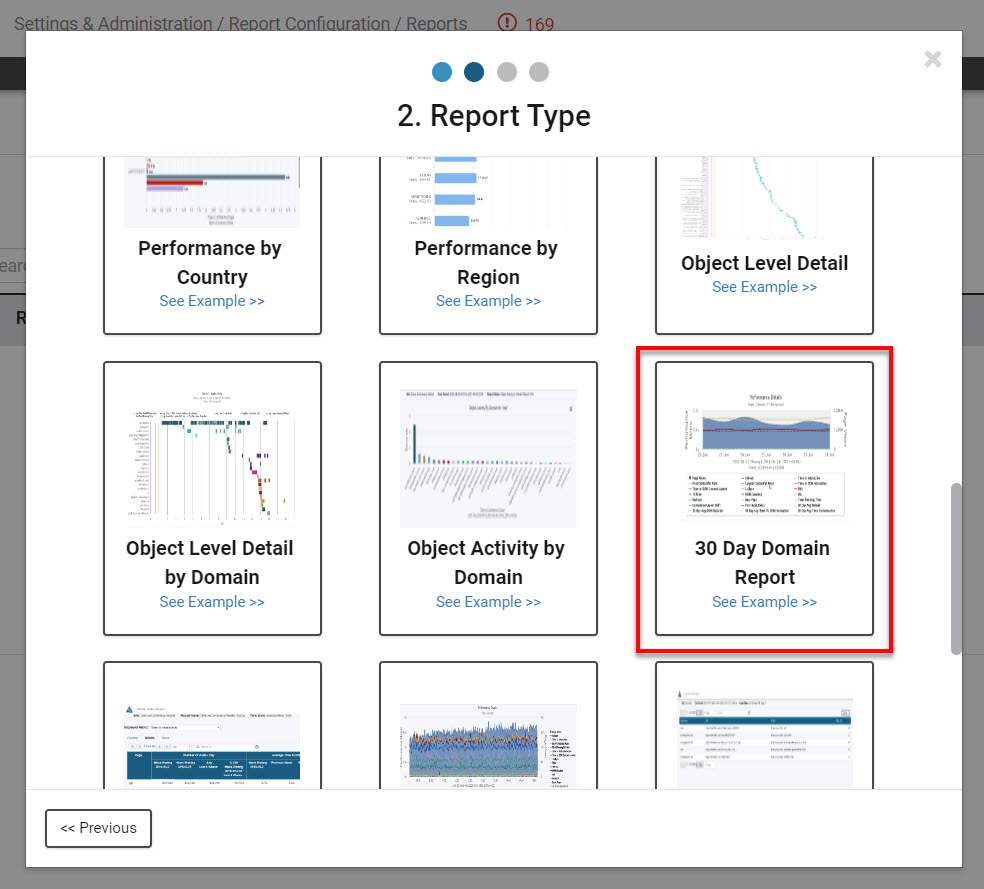
This will then lead to a window asking for Report Type. Scroll until you see 30 Day Domain Report under the Performance heading.
To configure data for the report, you must first set the Report Settings.
- Report Time Period cannot be changed to any other option than one week. It is a rolling look-back period of the past seven days.
- E-mail Frequency changes how often the report is run and e-mailed, ranging from a daily e-mail to an e-mail every seven days.
- Report Name allows the report to be given a unique identifier. Best practices here are to include the site name and the page name, along with any other specific traffic or sorting configurations, since report configuration is not given when looking at a list of reports.
- Use Custom Subject Line allows the e-mail being sent to have a specific subject line, which can be changed for easy identification, or for e-mail filtering.
- E-mail Address has to include at least one valid e-mail address. Multiple addresses can be separated by comma.
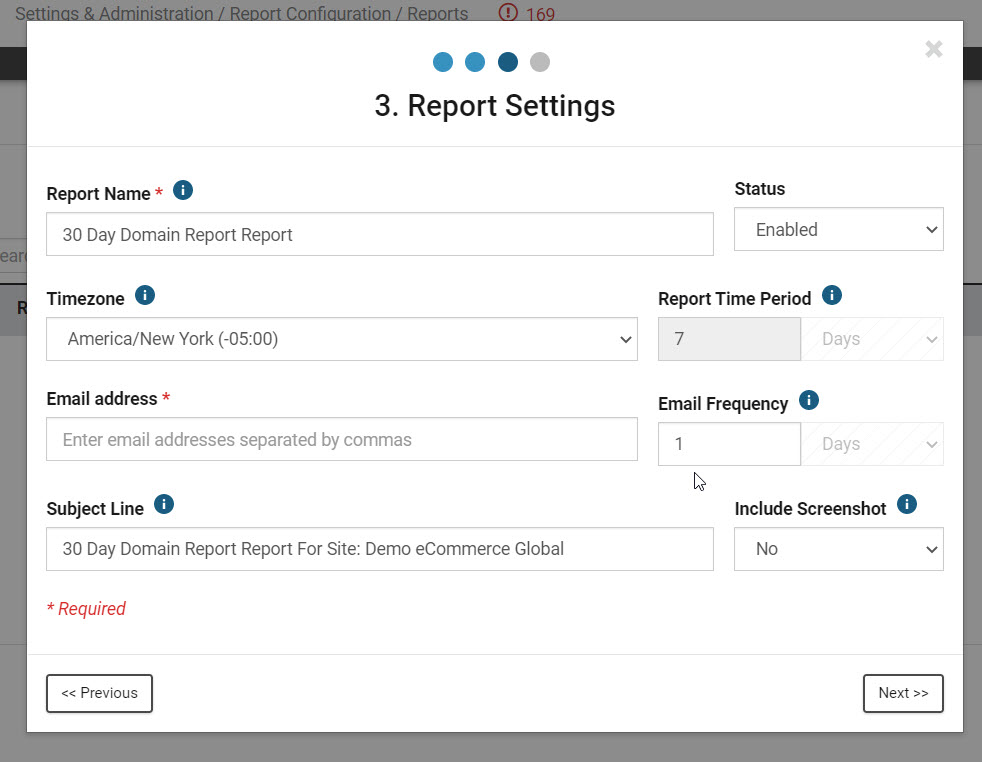
Once the Report Settings have been configured click Next at the bottom of the window.
This will lead you to the Report Filters.
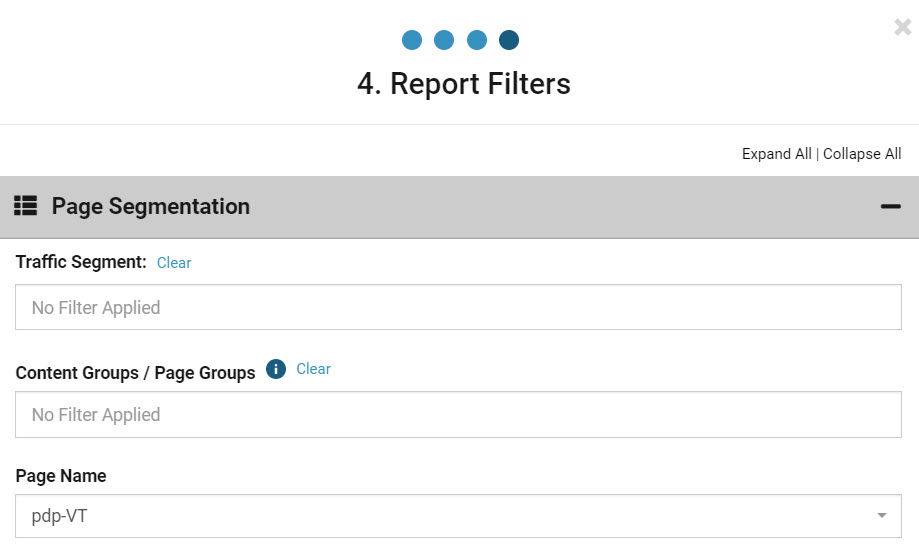
Page Segmentation
- The traffic settings change which page views are used for data aggregation. Note that only one page of the site can be used in the report, chosen under Page Name.
- Content Group enables grouping of pages into categories based on page relationality
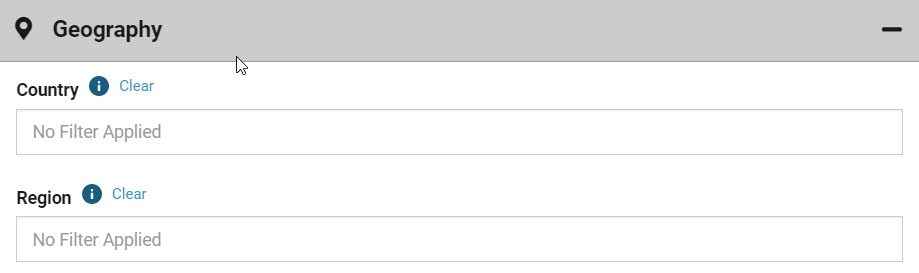
Geography
- Country specifies where site traffic from real users originates by country.
- Region specifies where site traffic from real users originates by state, province, or other geographic area within a country.
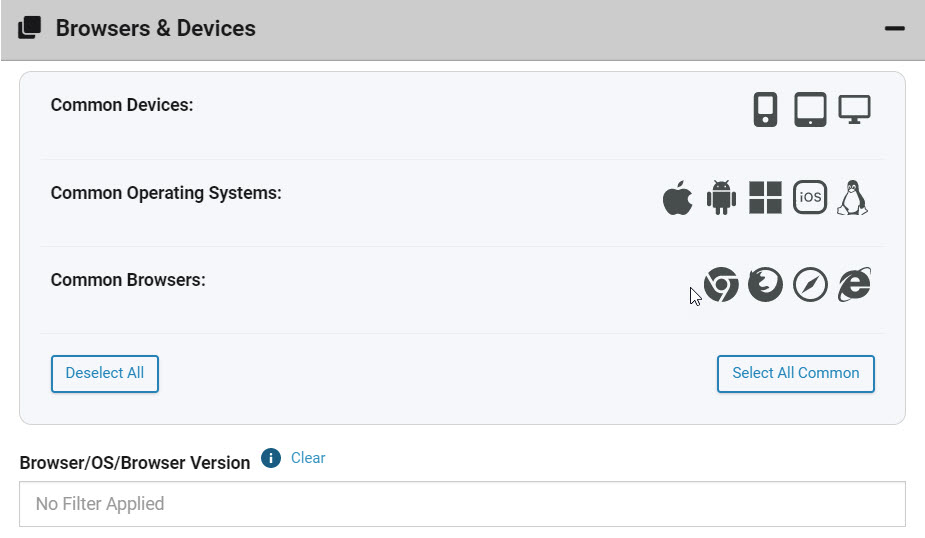
Browsers and Devices
- Common Devices allows for filtering based on device type, either mobile, tablet, or desktop.
- Common Operating Systems allows for filtering based on popular software brands.
- Common Browsers allows for filtering based on a user's chosen browser, either Chrome, Firefox, Safari, or Edge.
Advanced
- Number of Objects is the number of resources found on a page. Filtering this affects the number of objects that will show on a graph or table.
- The Sort By filter configures which objects are aggregated in the look-back period of the report. Sorting by File Count usually gives the most relevant information.
- Minimum Sample Size
- Changing the Bucket Size impacts the way the Performance Details trendlines display in the report.
- Net Speed allows for filtering of the speed of traffic from a particular network, such as a cellular network.
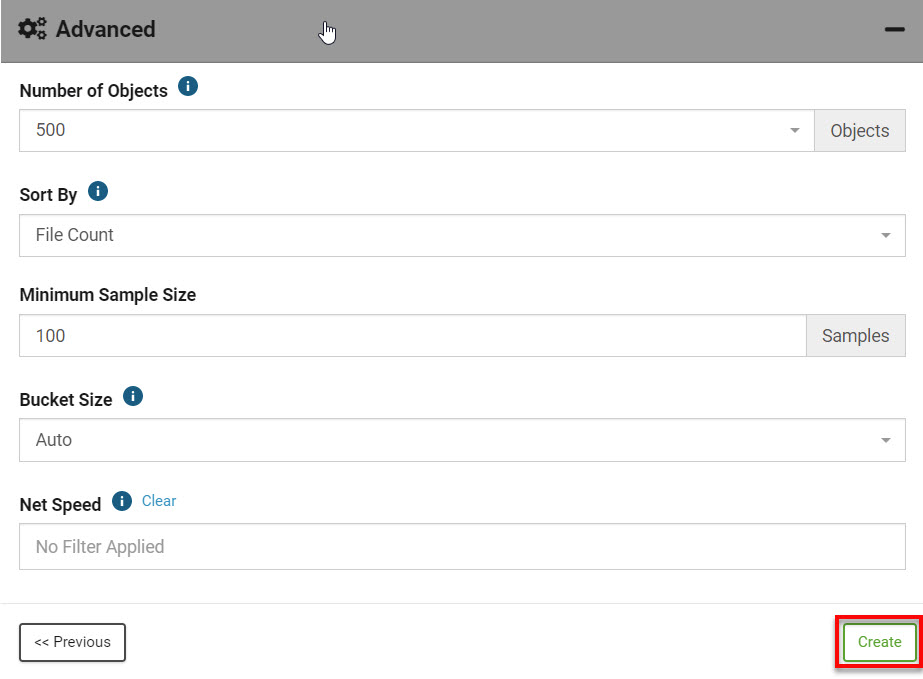
Once the report is configured, click Create at the bottom of the window.
You will see the report appear in the table.
Run the report now
To run the report immediately, click the Generate Report button to the far right beside the report. The report will run and the results will be e-mailed in about twenty minutes.

About the Average Load Time by Domain section
Once the report appears, open it and go to the Average Load Time By Domain section, which is the second section of the report. In this table, every domain that makes calls on the selected page is listed in a table with:
- the average load time (duration) for each domain over the past seven days,
- the 30-day average load time for the domain,
- the average percentage of elements (also called objects, resources, and files) the domain loads on the page, and
- the average number of elements the domain loads each page visit, which can be less than one when a domain calls a small number of objects on a limited number of pages with the same page name

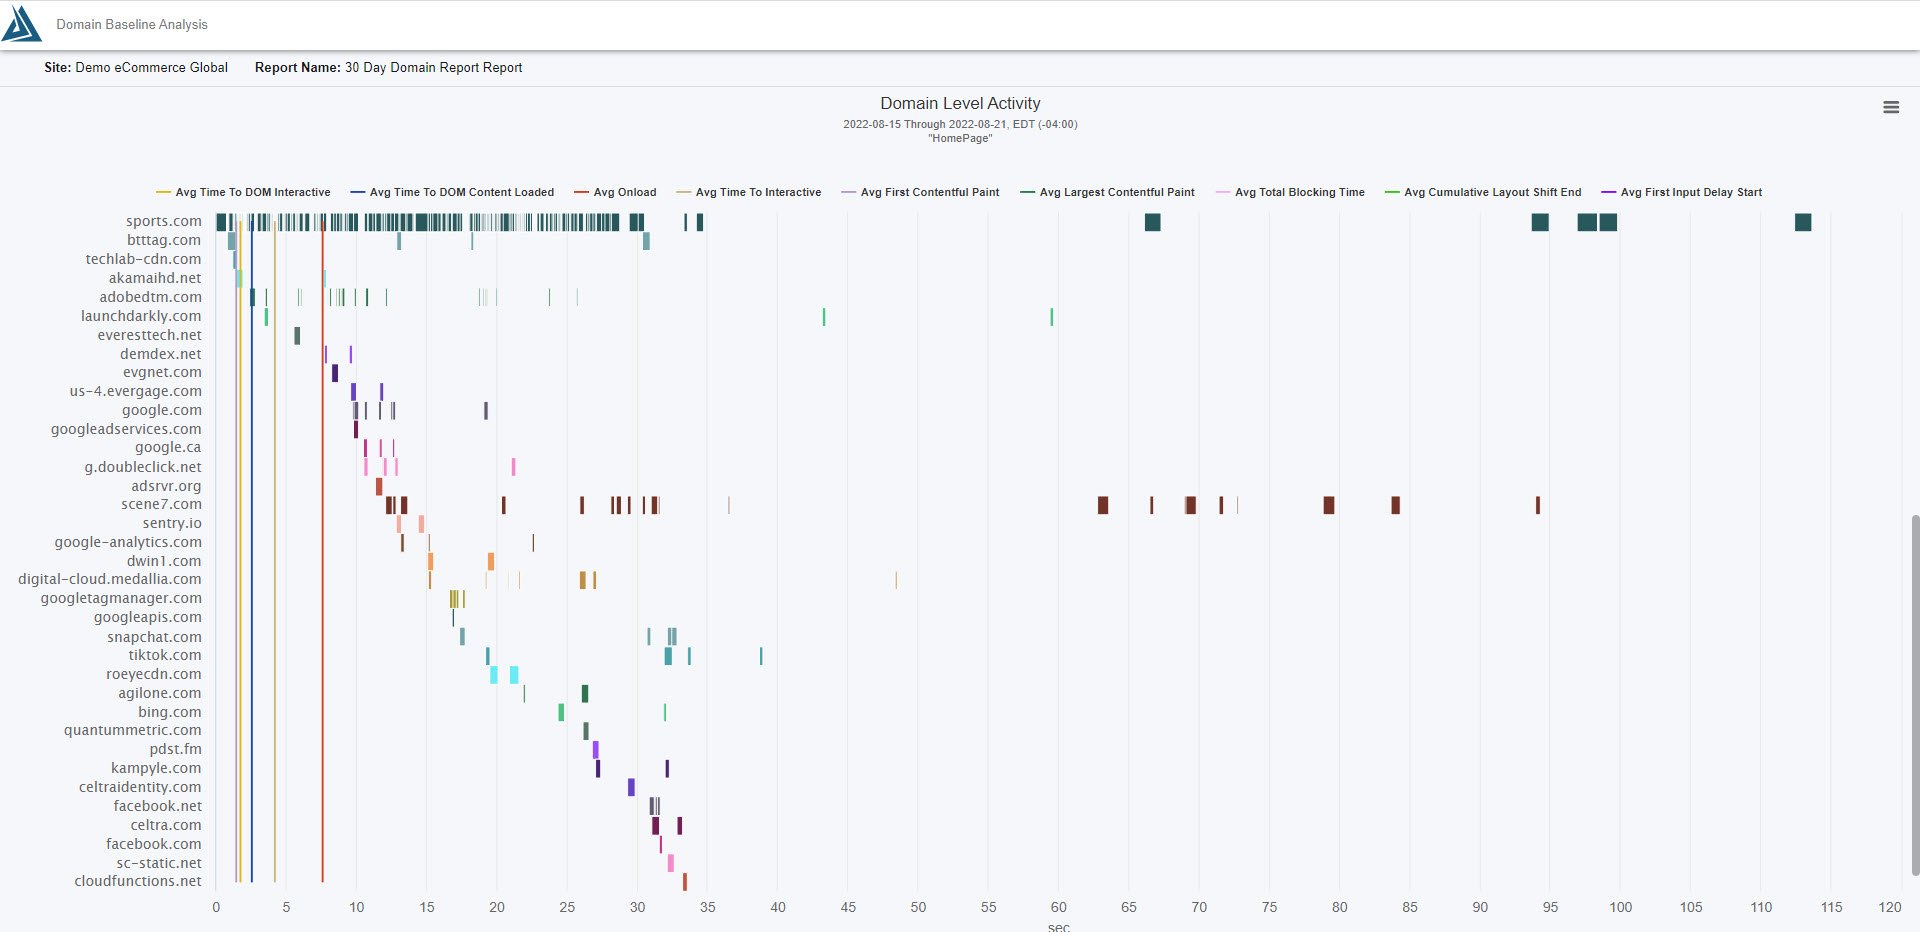
Table cells with averages for each of the past seven days may be highlighted either red or green: Red cells have a daily duration average significantly worse than the 30-day average. Green cells have a daily duration average significantly better than the 30-day average.
Click twice on the column header for any duration period to sort the table from the slowest- to the fastest-loading domains in that period.
The report also includes a Domain Level Activity waterfall and a Performance Details graph.
Comments
0 comments
Please sign in to leave a comment.