

Overview
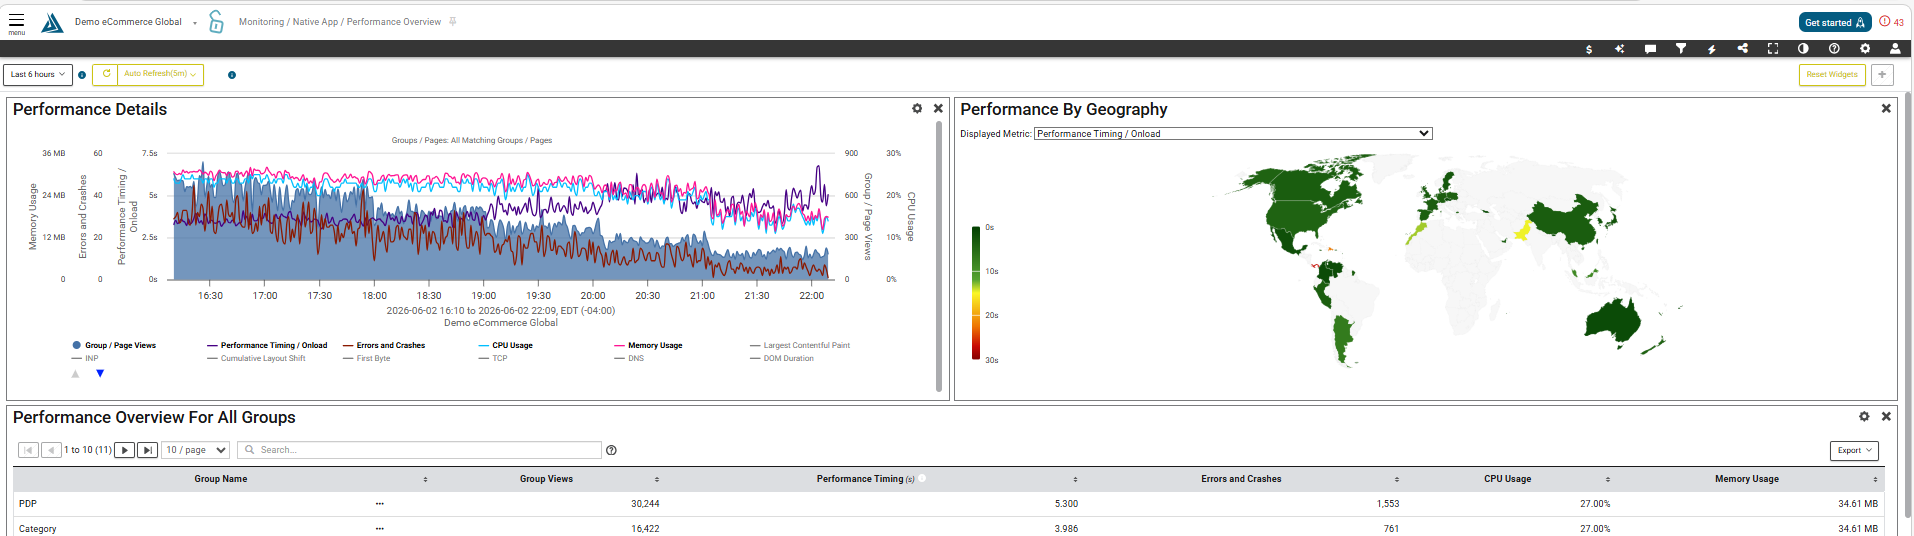
The Performance Overview page by default will be showing your data for the past 24 hours. This page has the same features and functionality as the RUM Performance Overview page.
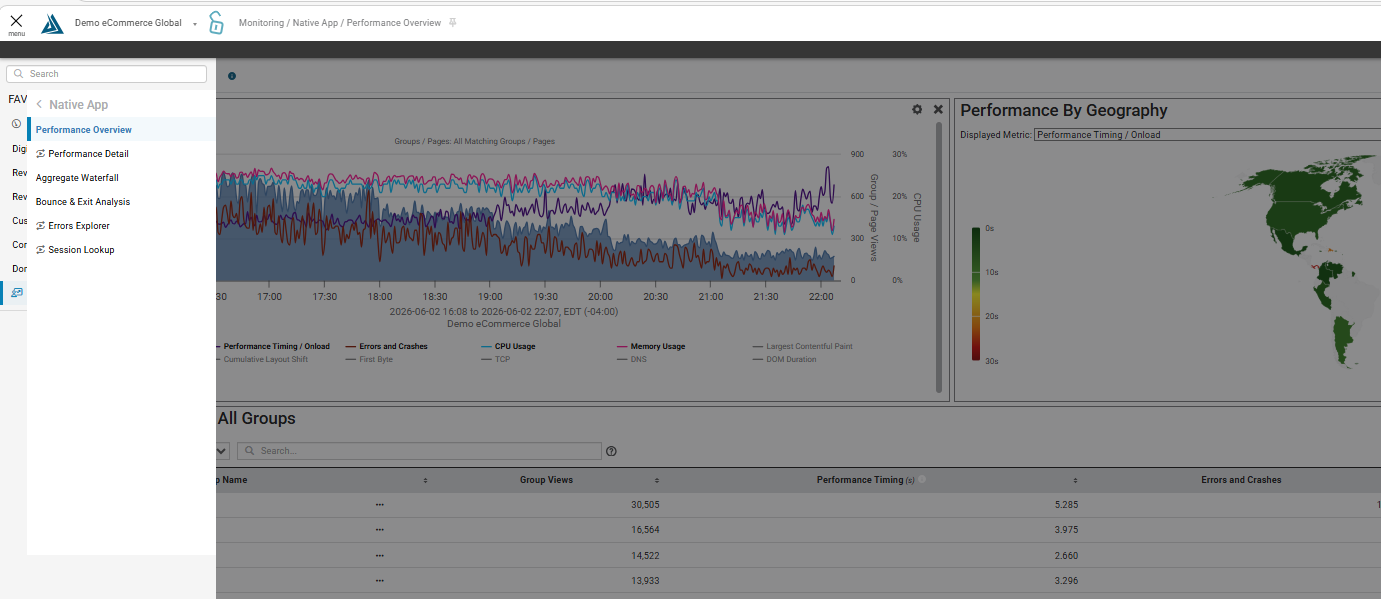
Where to Find the Native App Performance Overview Page
To find the Native App Performance Overview page, go to the main navigation menu on the top left of the BT Portal. Click on Monitoring, then Native App, then Performance Overview.
Widgets
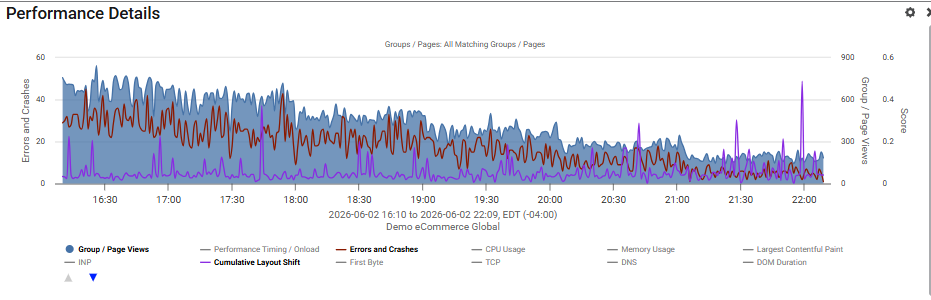
Performance Details
Customize the viewable metrics by clicking the metric name in the legend at the bottom.
Performance by Geography
This is the Performance by Geography widget. From the legend in the lower left, we can see the darkest green is optimal performance and the darker red indicates the worst performance. Click into a region to expand the graph and view the performance for the sub-regions.
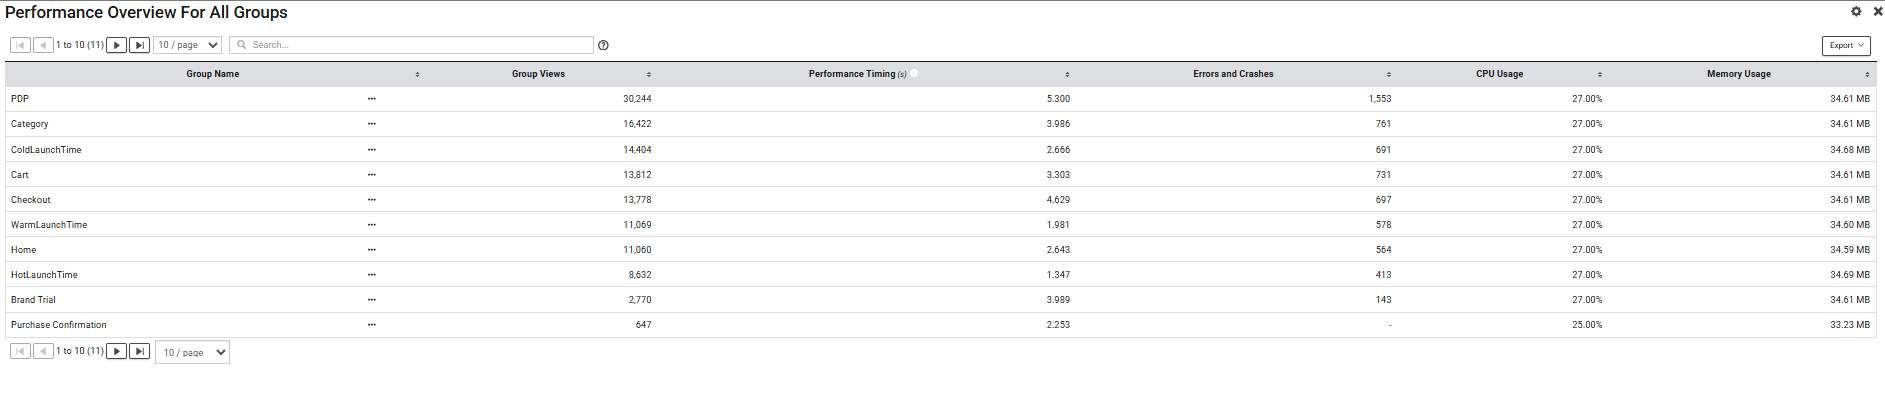
Performance Overview for All Groups
The overview table showing metric data for each page. Click the three dots next to a page and you’ll have options to link to other areas of the portal with that page selected for analysis.
Performance Breakdown
You can view the data in a graph or table by clicking the graph and table icons in the top right. Click the tabs above the graph to switch between Country, Region, Browser, ISP, APP and OS Version, Device Model, and Network Protocol.
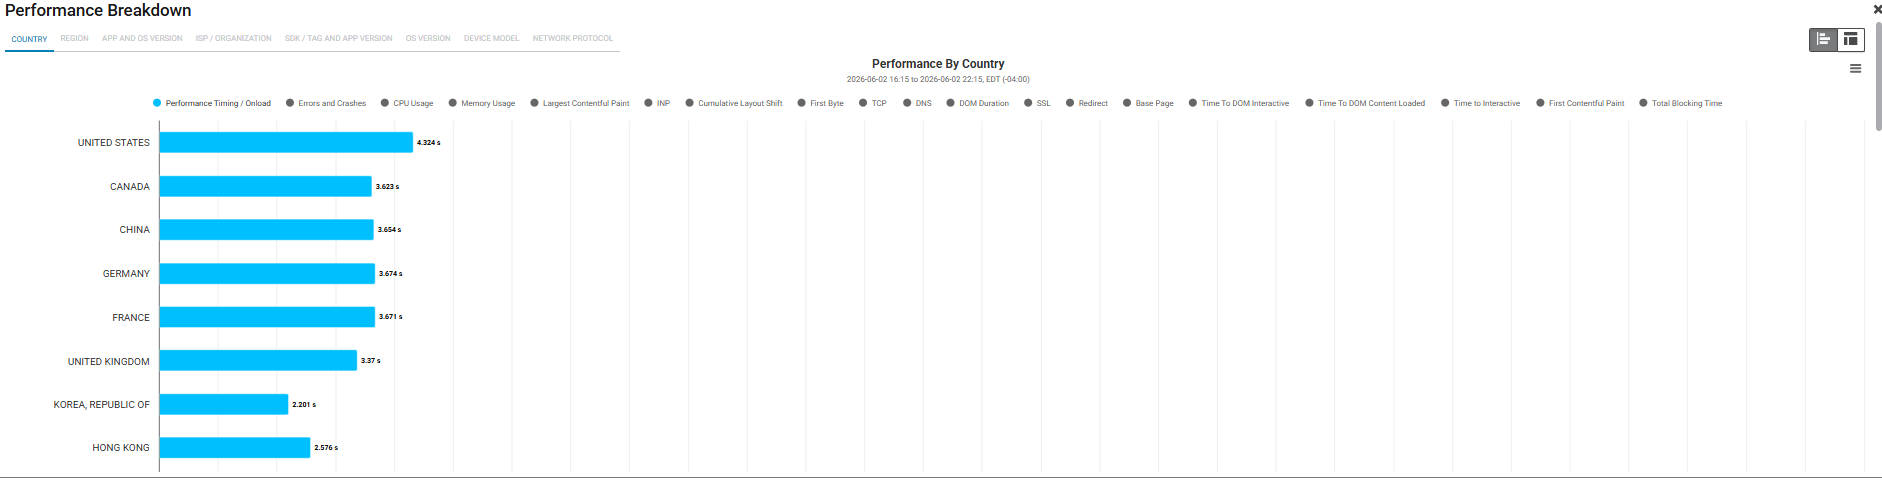
In each graph, you can click the legend items to hide and show different metrics in the graph.
Filters
To change the time period and filters you can use the selections at the top, or click the filter icon in the toolbar at the top of the page to view the full list of filters options.