Overview
The RUM Native App Performance Detail page shows how real-life users are experiencing your app in real time. The Performance Detail page gives in-depth insights into key performance metrics for different pages, as well as page-view-by-page-view and session-by-session analysis.
Where to Find the Native App Performance Detail Page
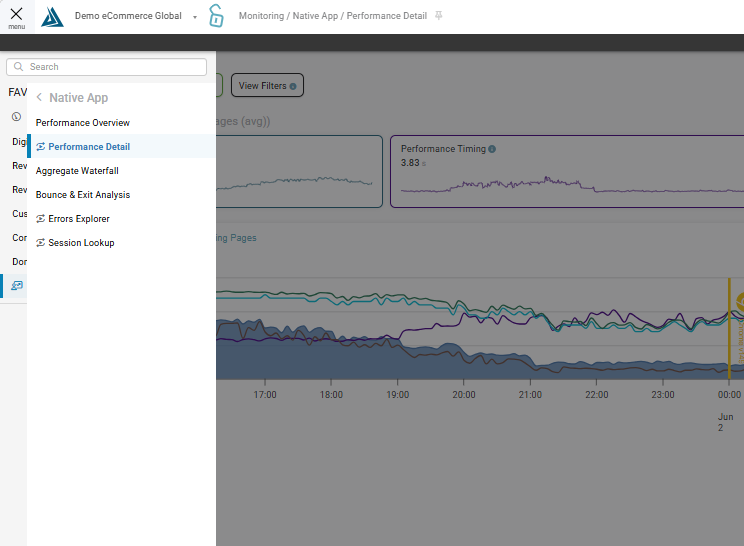
This page is available through the left-side navigation menu under Monitoring, then, Native App, then Performance Detail.
Widgets
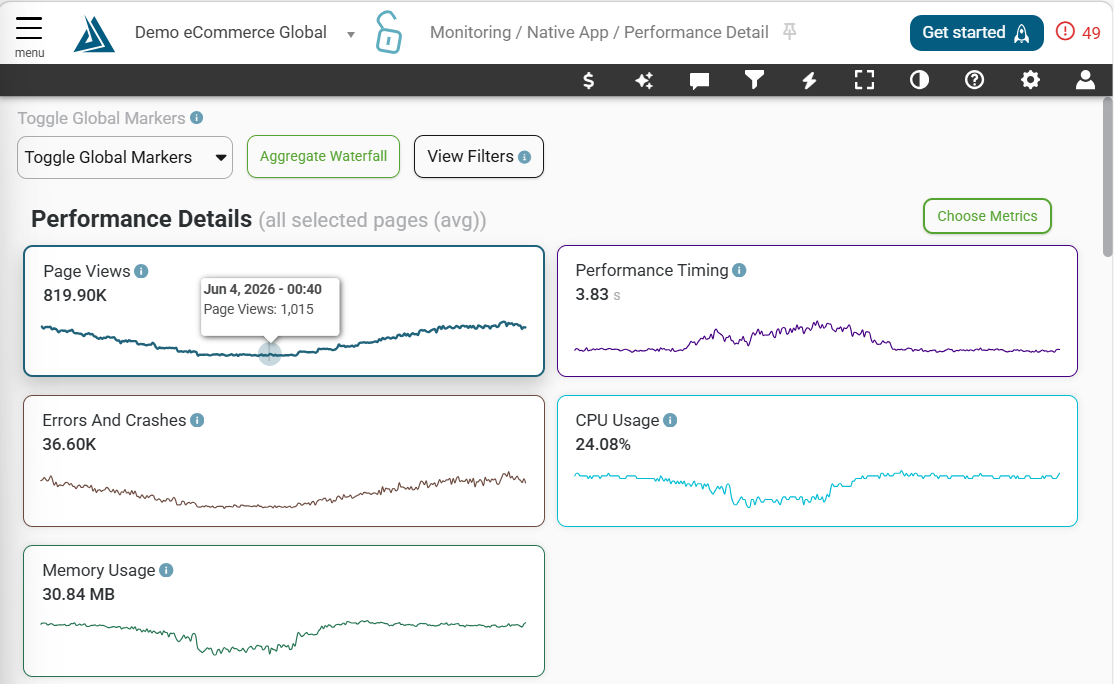
Performance Details
This widget displays different statistics for the metrics you select for your site. Hover over the graph in the cards to get more details about that metric.
Choose Metrics Button
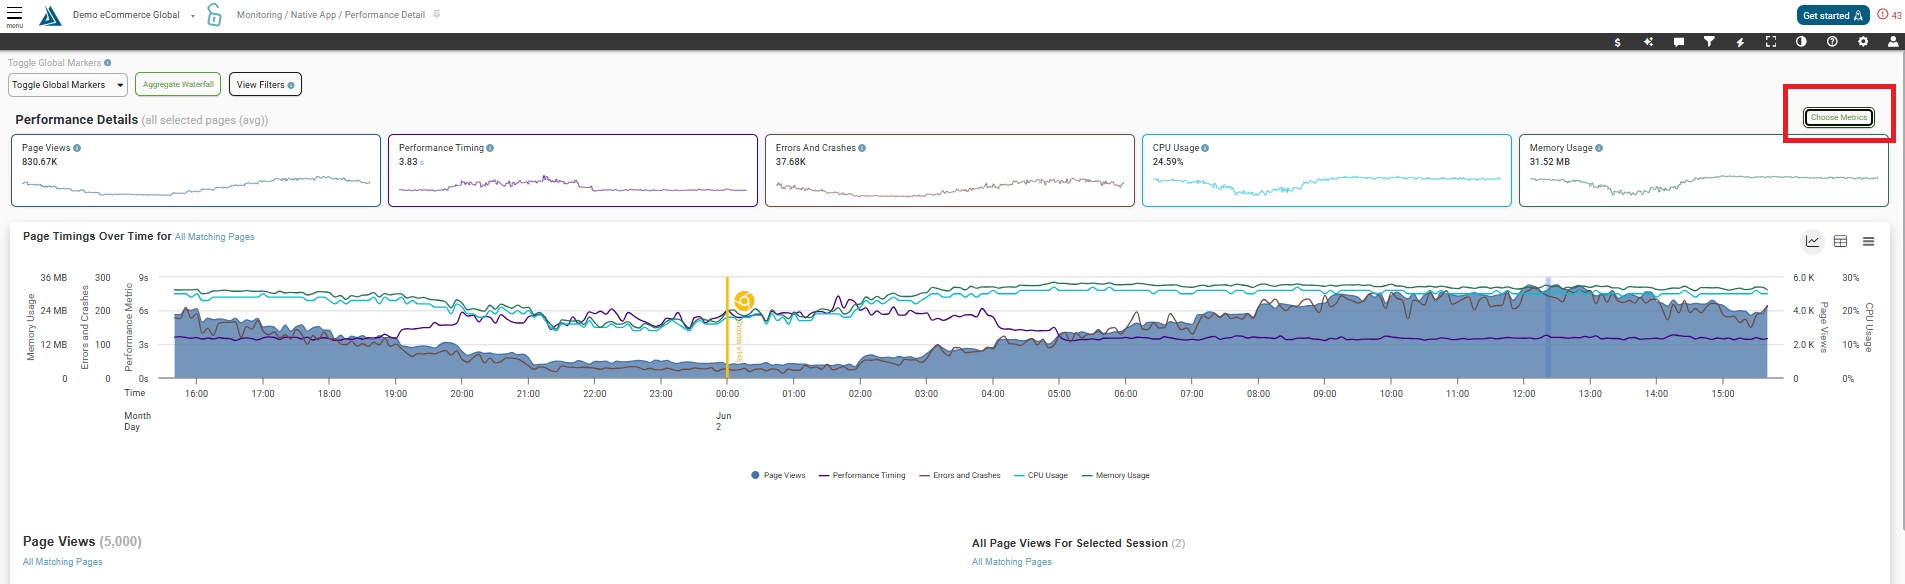
The Choose Metrics button is located in the upper right hand corner of the Performance Details page.
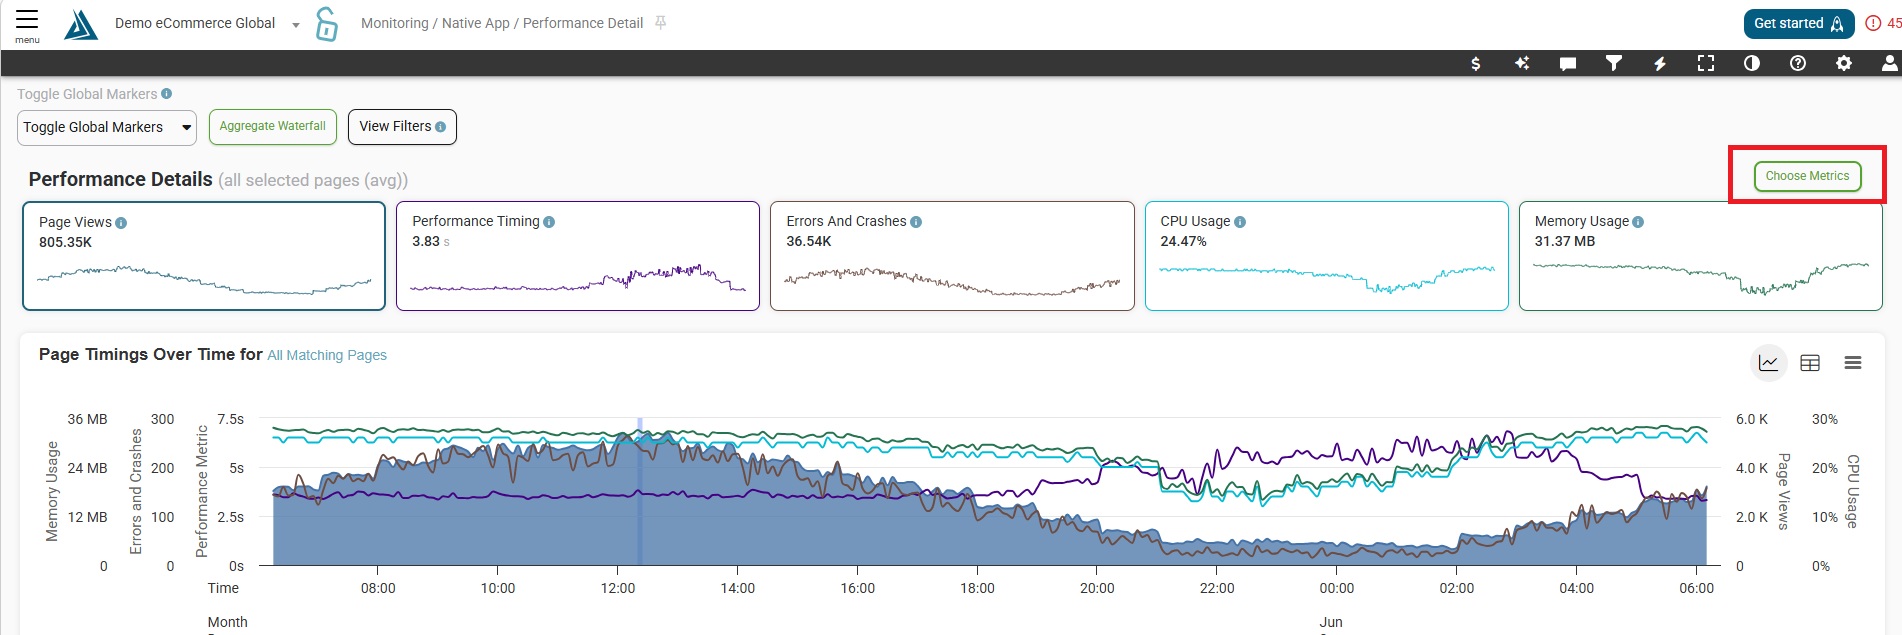
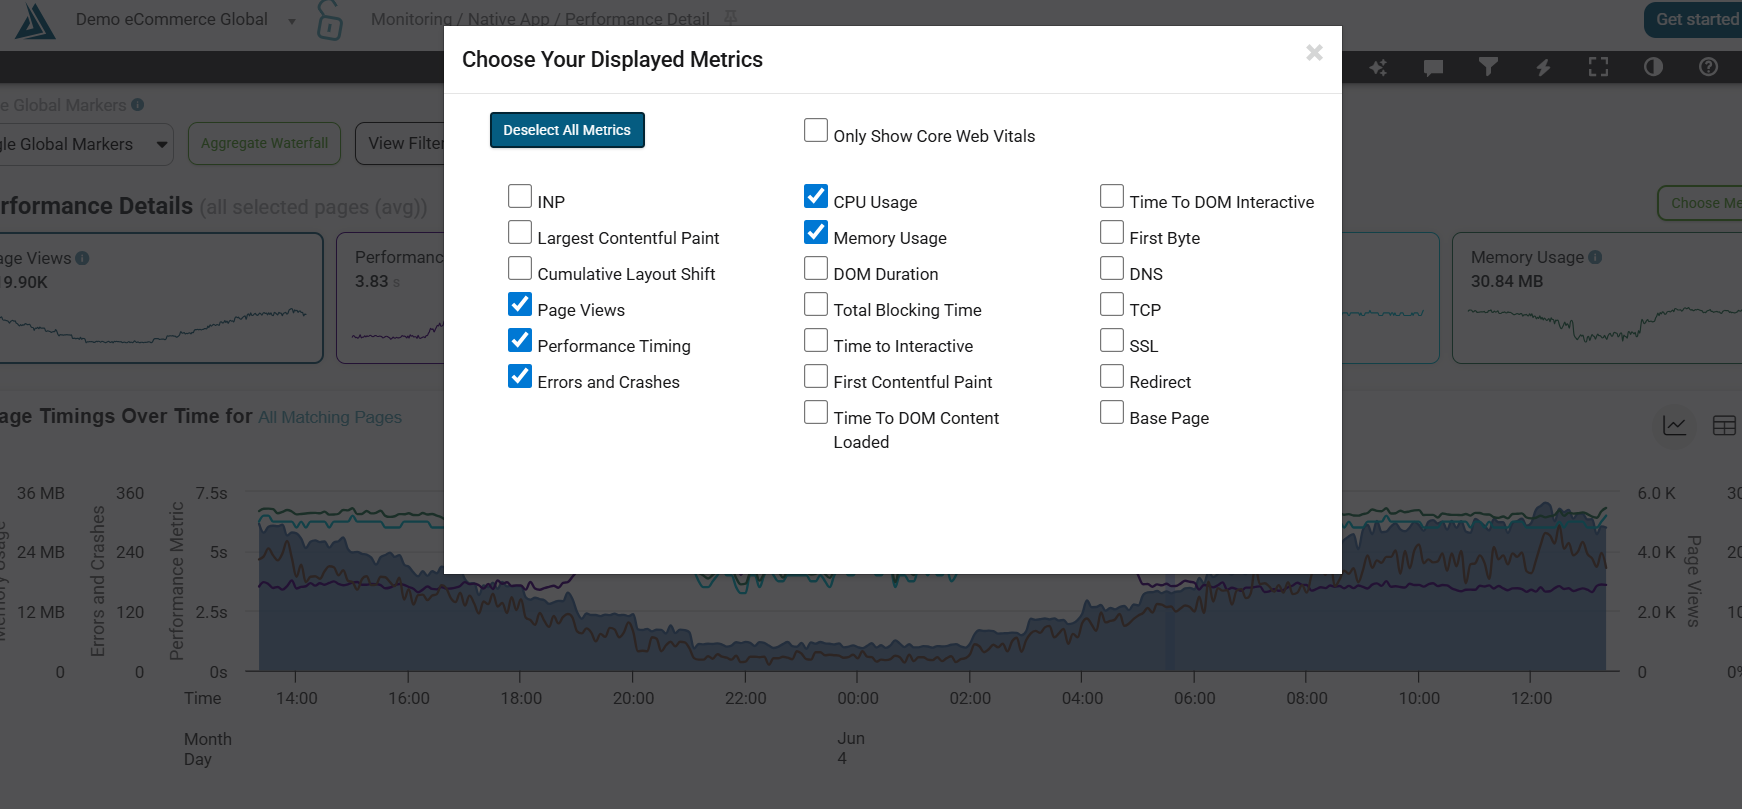
The Choose Metrics button allows selection of what metrics are actively displayed on the Dashboard.
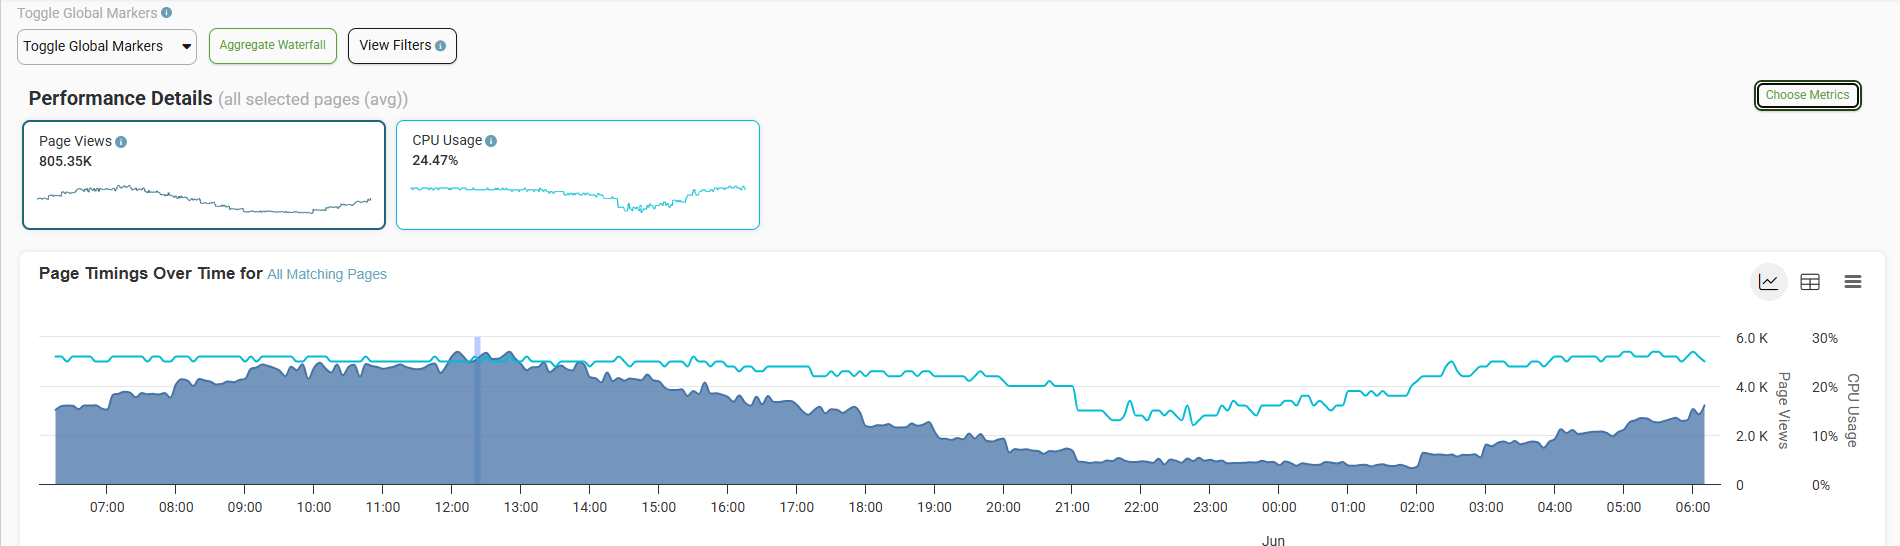
Now, the Dashboard displays only the selected metrics.
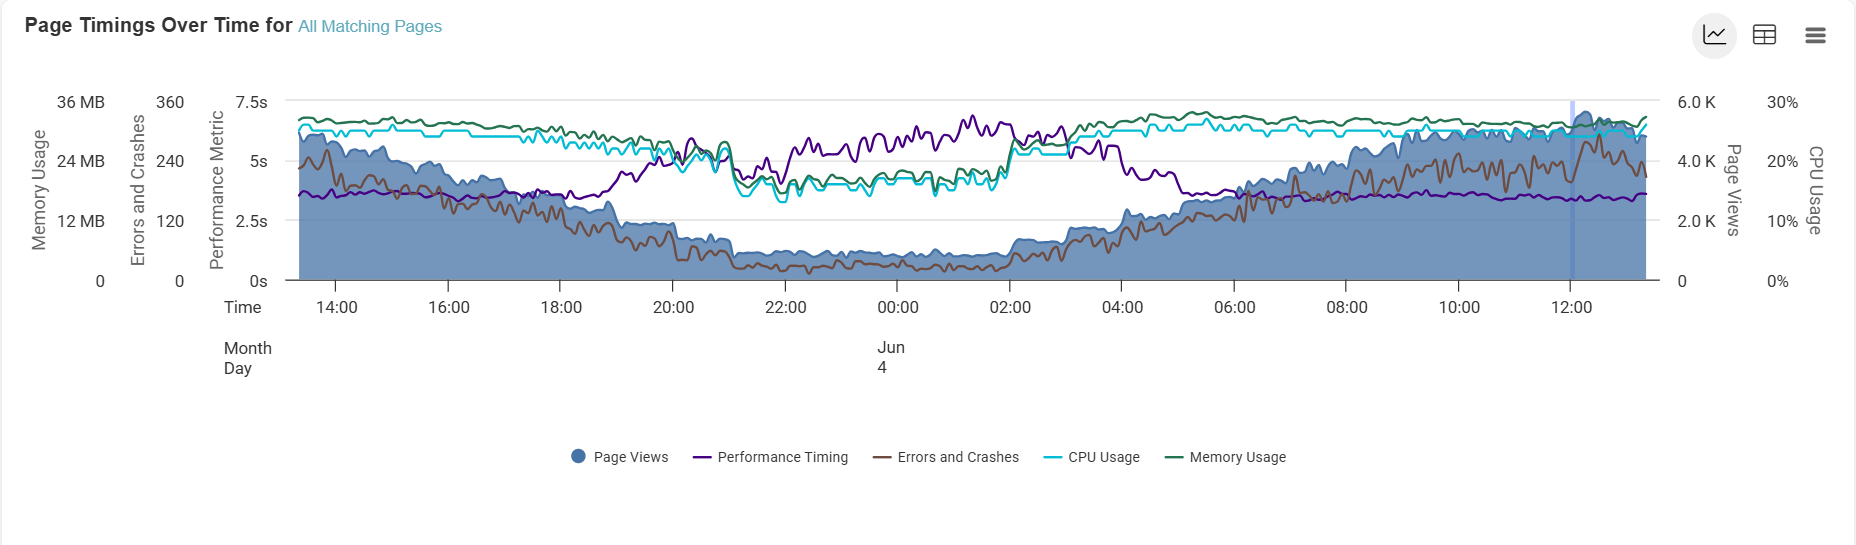
Page Timings Over Time
This widget displays the same data as the Perfprmance Details widget above as a line graph. Control the metrics you are viewing by clicking the metric name in the legend. To view this data as table, toggle the button in the right side of the graph.
Scatterplots
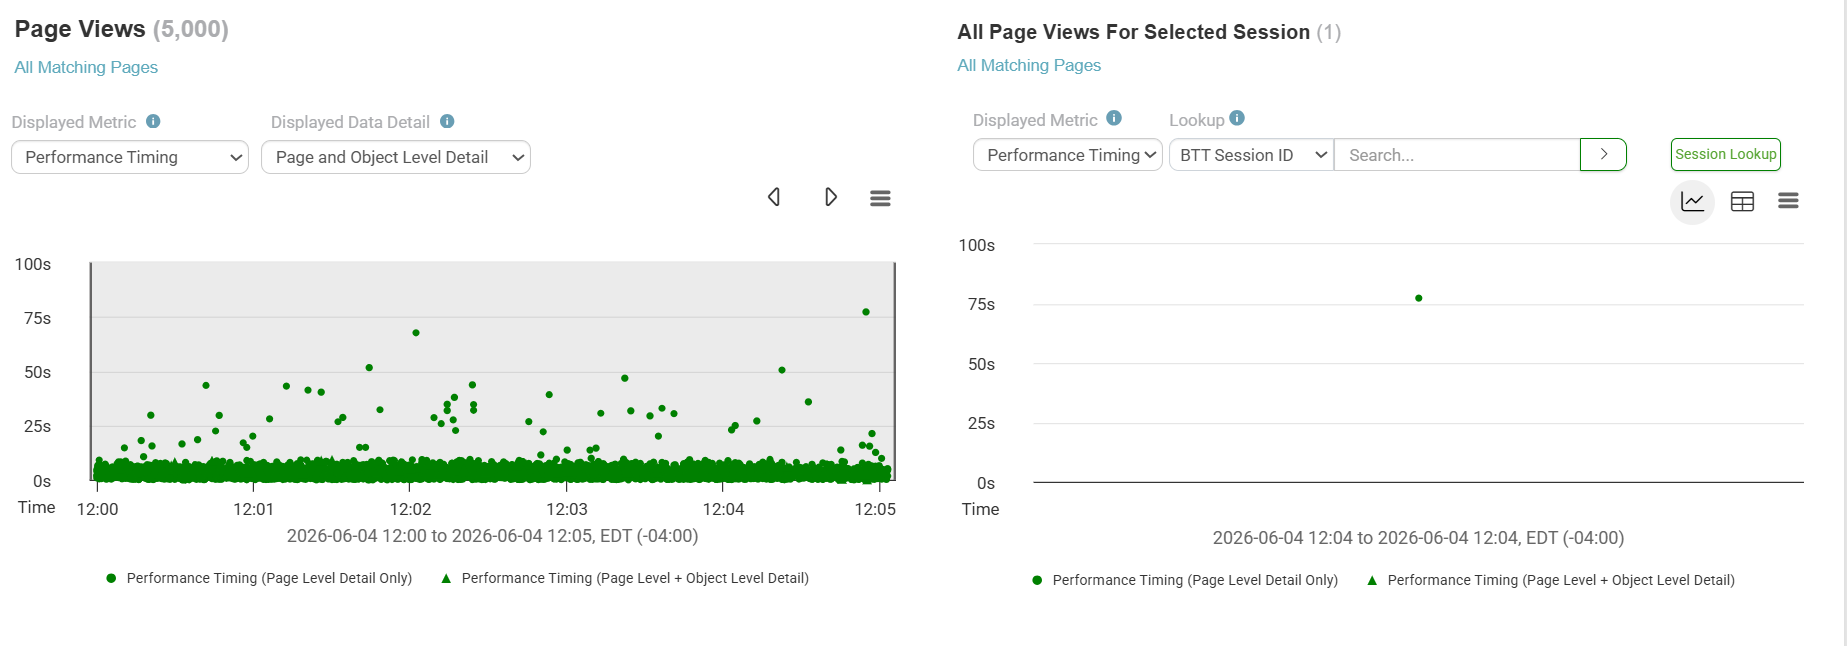
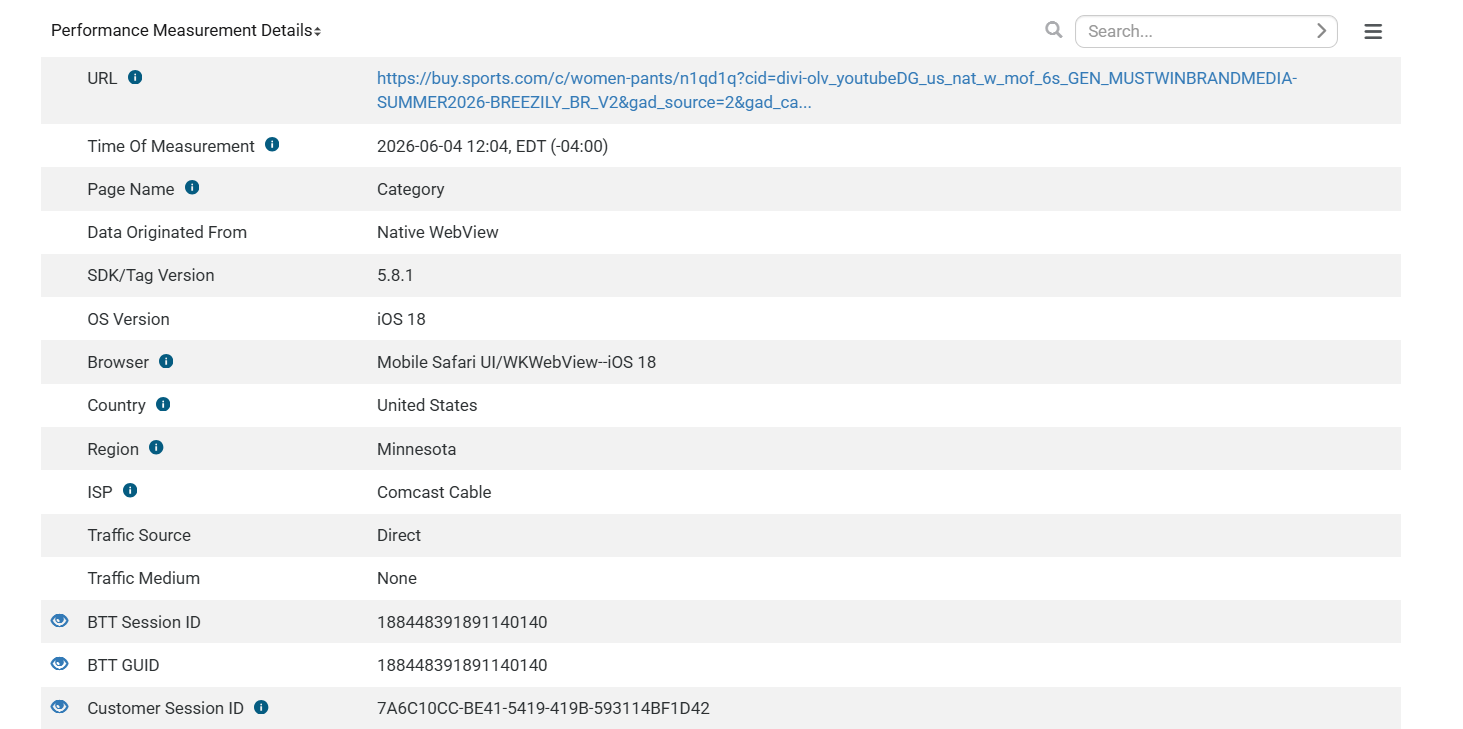
Use these widgets for page-view-by-page-view and session-by-session analysis. Select a session on the left-side graph to update the graph on the right. You are also able to search by BTT Session ID, BTT GUID, User Agent String, IP Address, or Customer Session ID. Selecting a point on the scatterplot will update the Performance Metric Details table below. To change the time period, move the highlighted blue area in the Page Timings Over Time graph above by clicking the desired point in the graph. You can also use the 'Previous' and 'Next' buttons located in the Page View scatterplot.
Filters
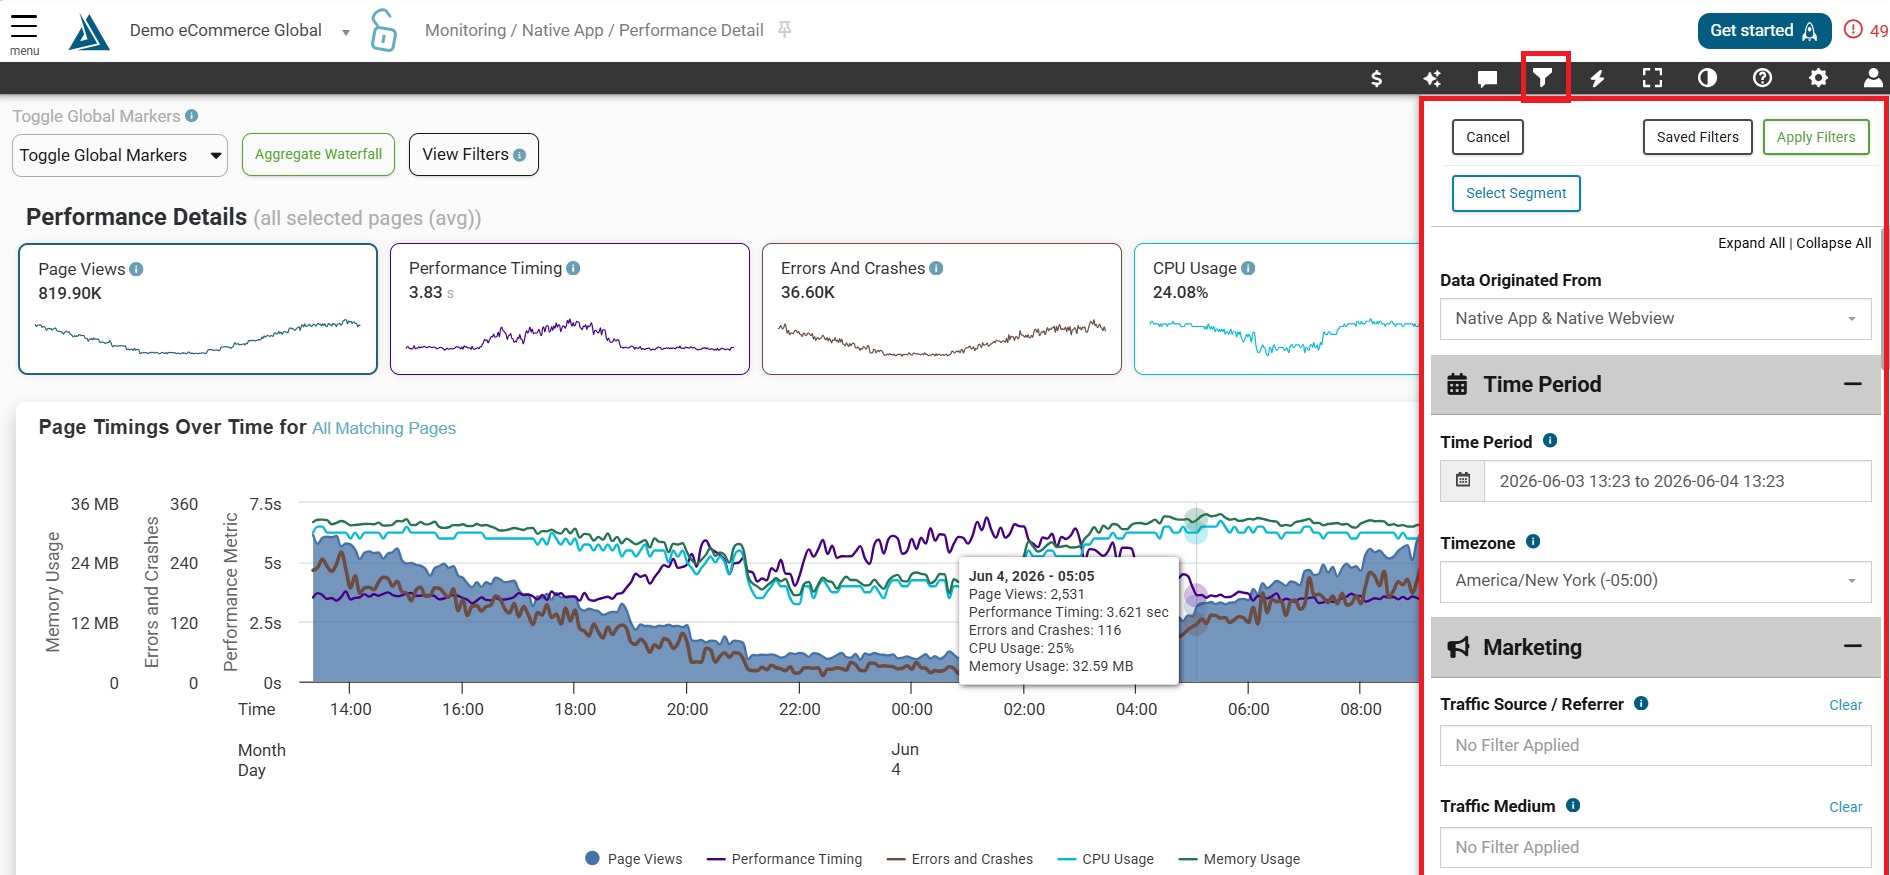
Click the filter icon to open the filtering menu. This page functions just like the Real Browser RUM Performance Detail page.