

Overview
Native App session lookup allows you to view the performance metric details of a specific Native App session. It is available on the RUM Session Lookup Page which features widgets presenting the data for the Displayed Metric selected from the dropdown menu as a graph.
Please note that this does not include information regarding Native Webview. Please see our help center article here about RUM Browser Session Lookup for more information here.
Accessing Native App Session Lookup
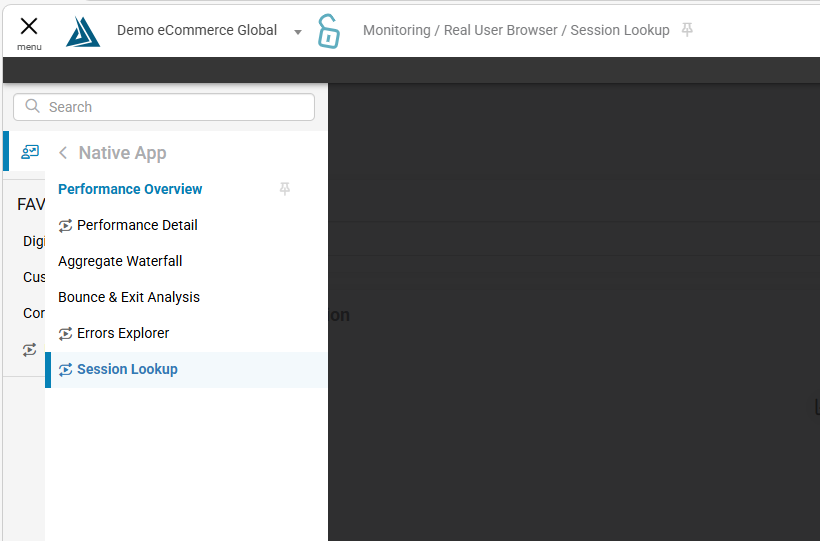
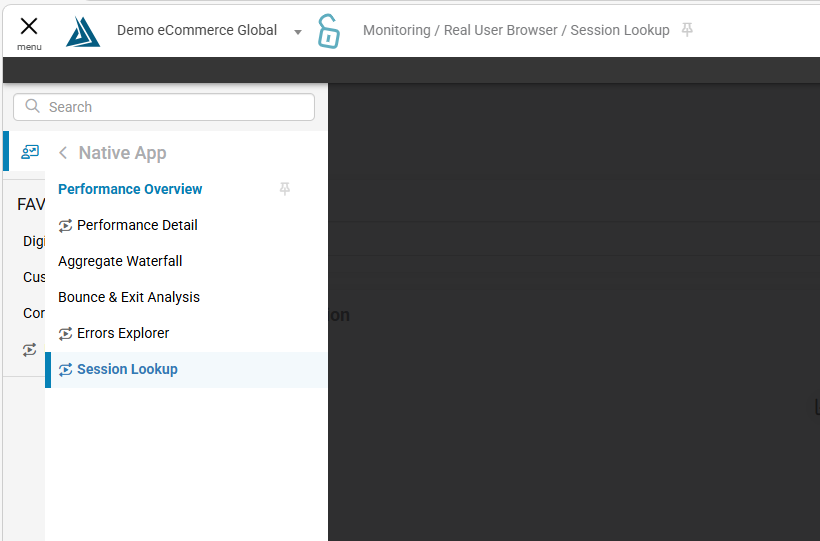
To access Native App Session Lookup, navigate to the RUM Session Lookup Page. This page is available by going to Monitoring-> Native App ->Session Lookup. From the Performance Detail page, there are three options for viewing session lookup data.
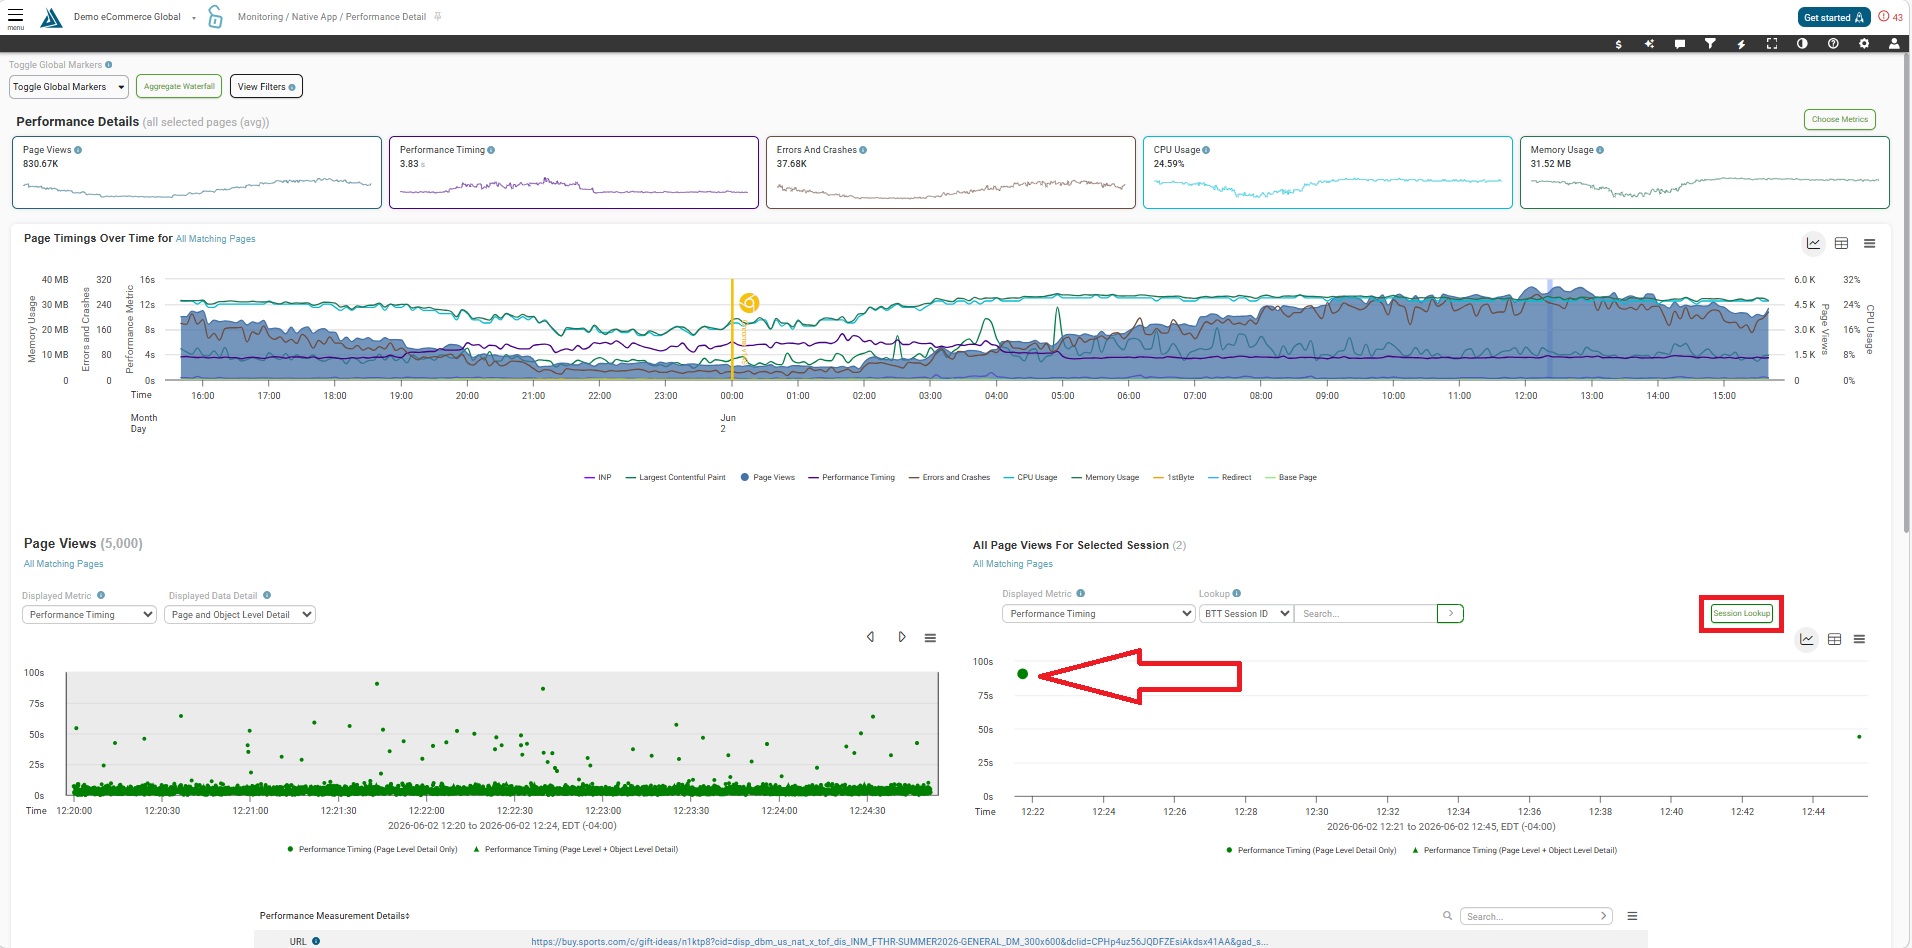
First, if you select one of the points in either of the scatterplots on this page, it will pull up a table of performance metric details for the selected point. Second, you can also search by BTT Session ID, BTT GUID, IP Address, Customer Session ID, URL, or User Agent String in the lookup widget to view the data for the selected performance metric. Third, you can click on the eyeball icon next to the BTT Session ID or BTT GUID in the Performance Metrics Detail Table.
The full functionality of the Session Lookup page is available through the 'Session Lookup Page' link located on the top right of the Lookup Widget.
Functionality
Session Lookup Graph
Session Lookup allows you to search by a variety of categories including BTT Session ID, BTT GUID, IP Address, Customer Session ID, URL, or User Agent String to view the matching data for the selected performance metric.
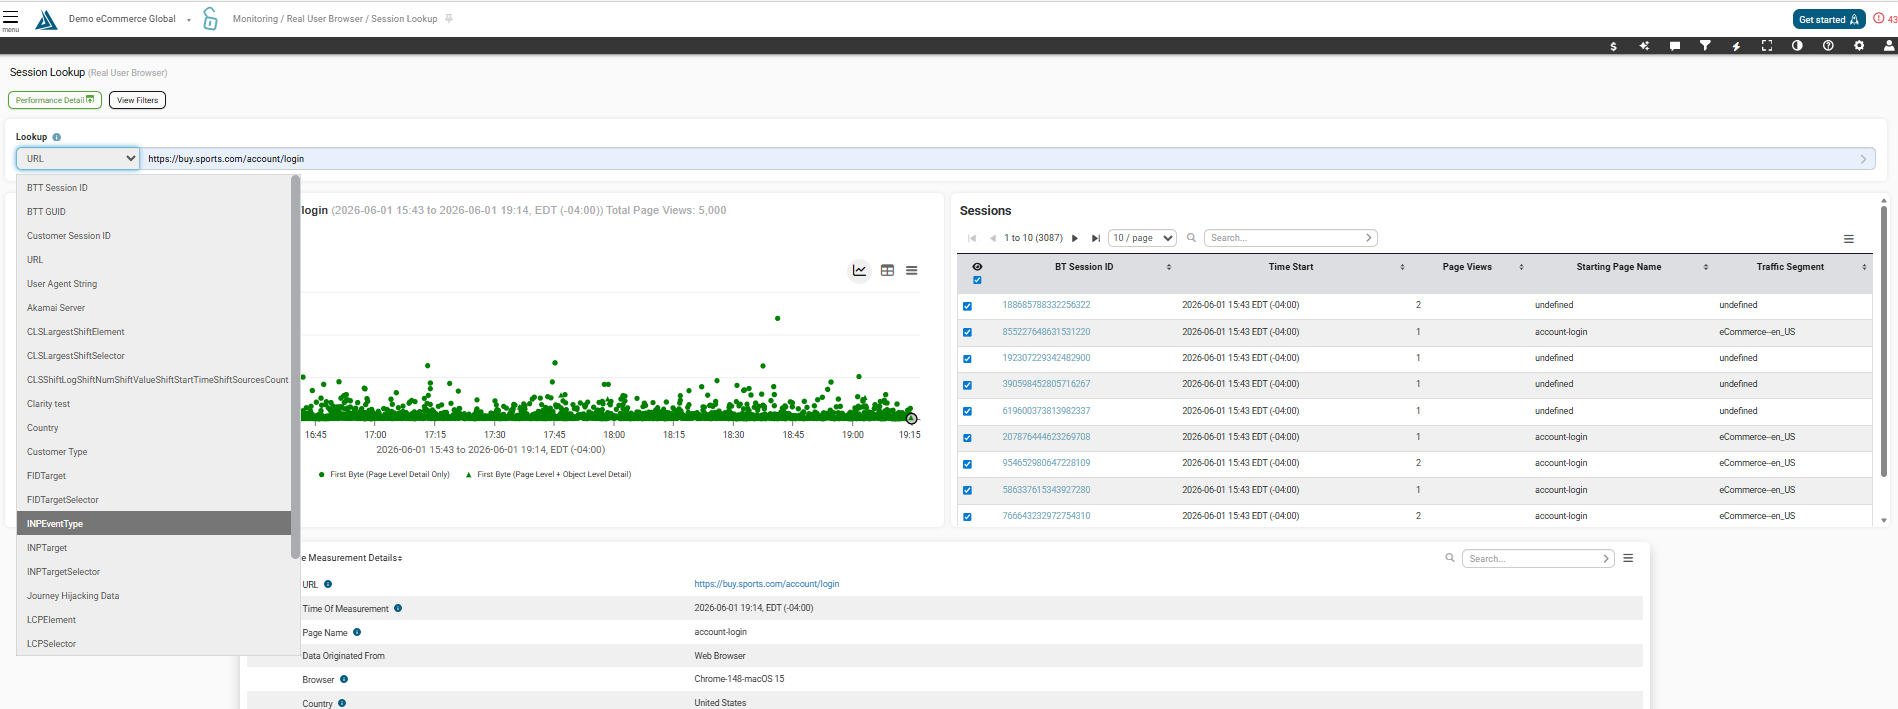
Example All Page Views for selected session:
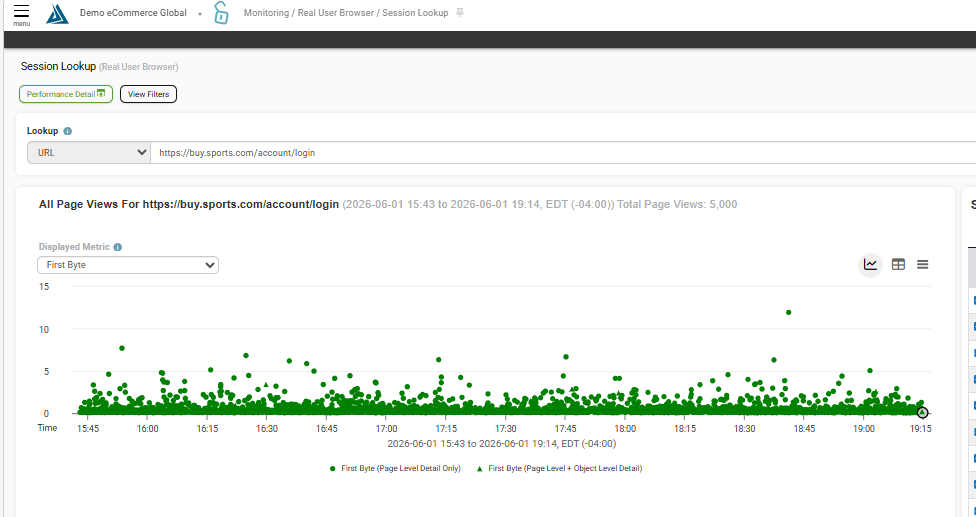
You can choose which metric you want displayed by clicking on the dropdown menu under "Displayed Metric". When looking at a session that is exclusively Native App, only metrics relevant to Native App will be available for selection.
Performance Metrics Detail Table
Sessions Table
In this table you can toggle which specific session you want to see in your session lookup. It displays the data for Time Start, Page View, Starting Page Name, and Traffic Segment organized by BT Session ID.