

Overview
The RUM Native App Errors Explorer breaks down the errors real users are experiencing on your app broken down by where they're coming from and who's impacted by them.
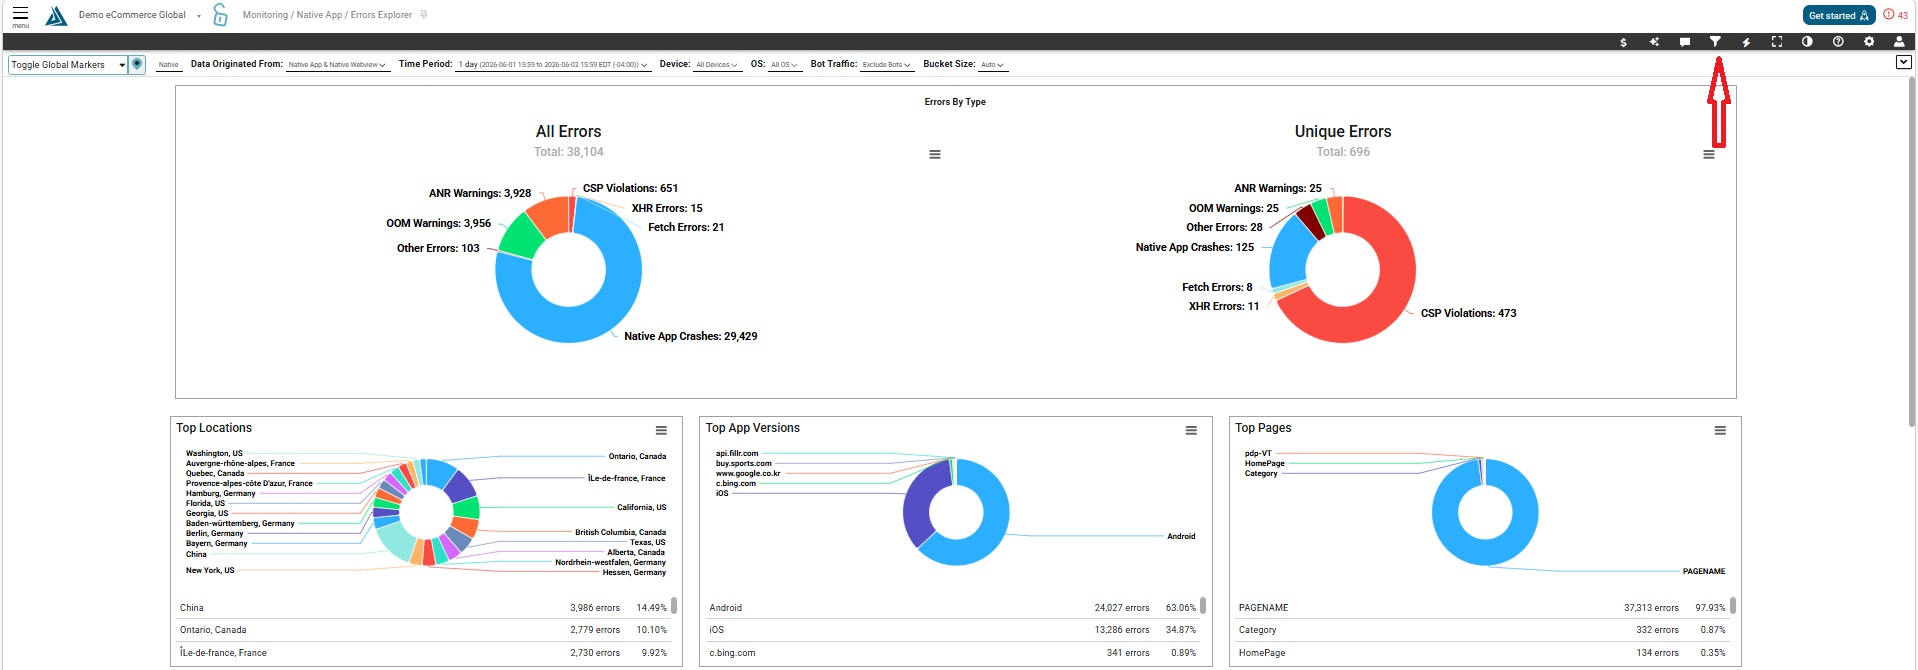
Note: You are able to filter this page as you can with all other pages in this module. These filters options are found in the right side filter icon at the top of the page.
Where to Find the Native App Errors Explorer Page
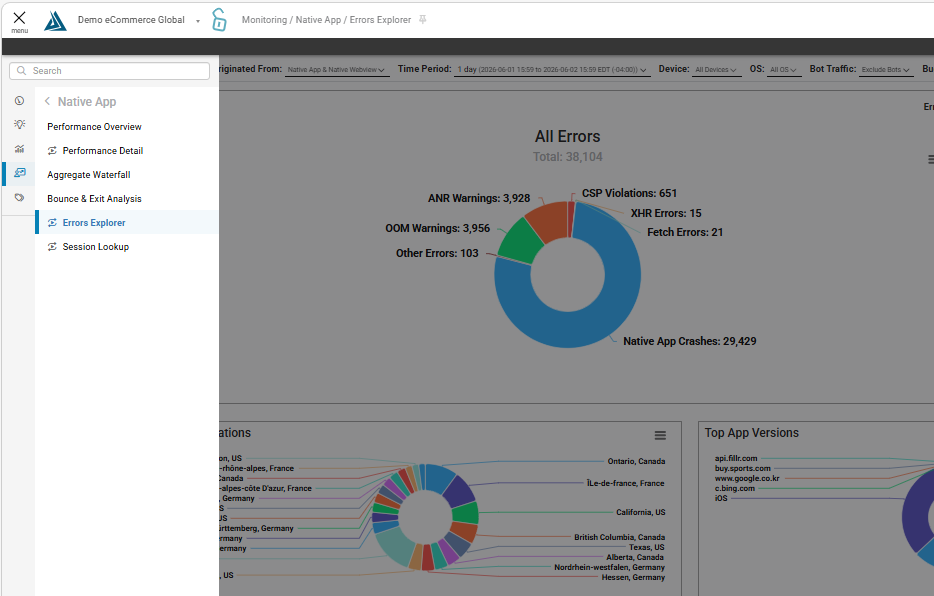
Access the RUM Native App Errors Explorer Page through the left side hamburger menu under the Monitoring module, then Native App, then Errors Explorer.
Widgets
Errors by Type
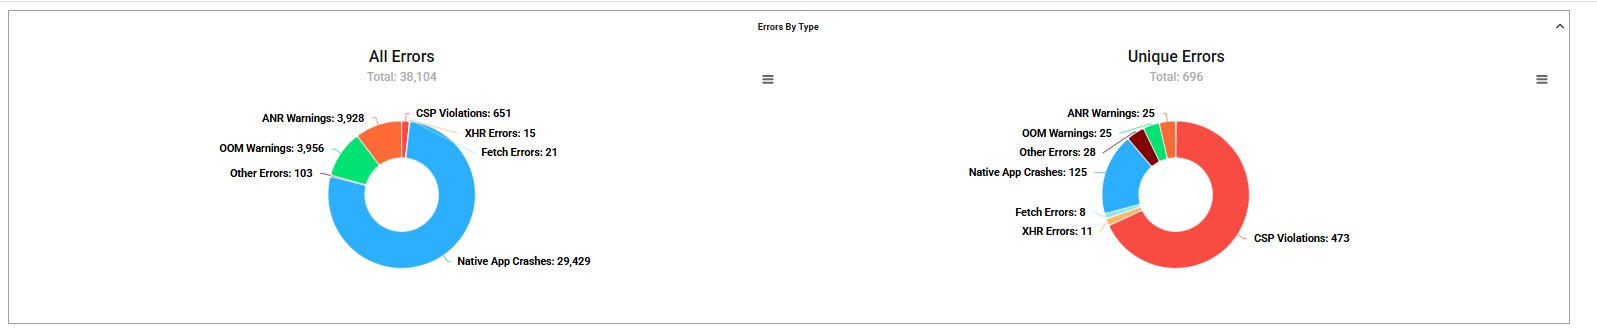
The left side (All Errors) shows the total number of observed errors. The right side (Unique Errors) shows the number of those errors that were unique, meaning these errors are not appearing multiple times.
Top Charts
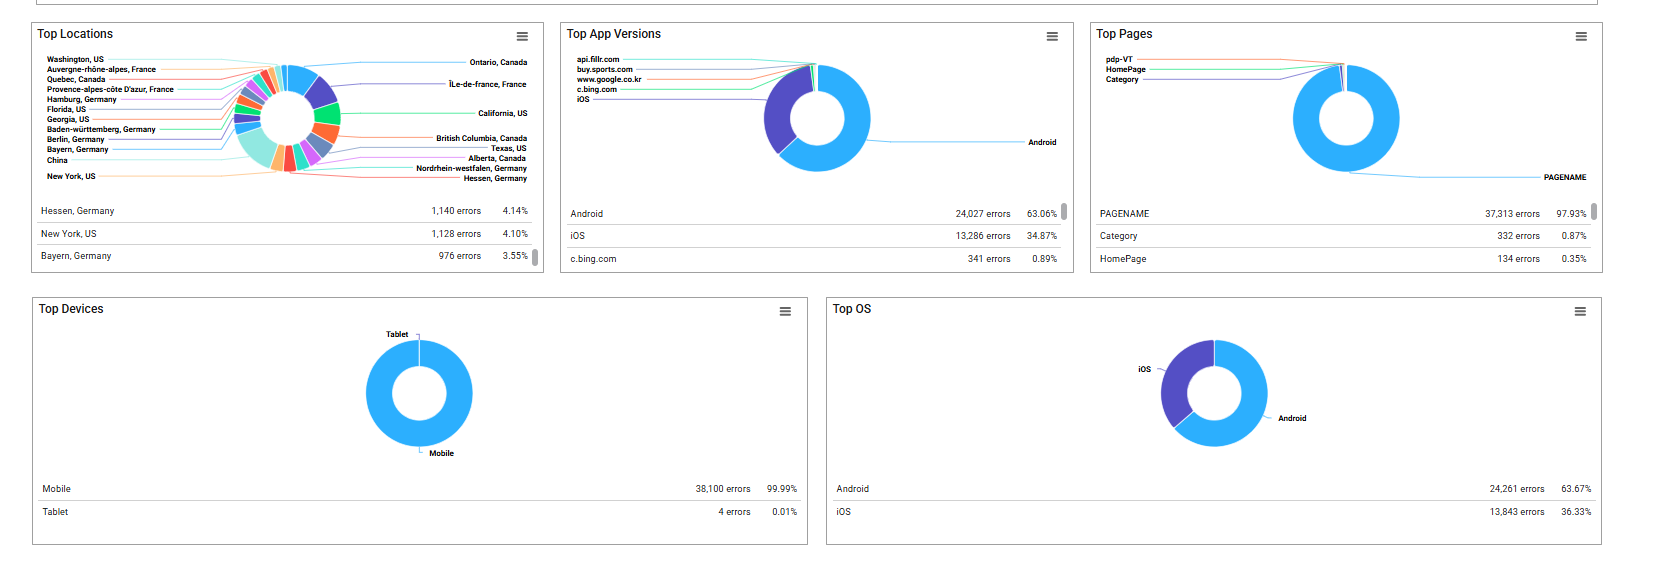
This section shows all the top Locations, Pages, Devices, OS, and App Versions that are experiencing errors. Utilize these charts to know where the problem areas are. Clicking in the table below each graph will add that filter option to the Errors Over Time widget below so you are able to view this data as a histogram and the exact errors that are occurring (does not apply for Top App Versions).
Errors Over Time
This histogram compiles what kind of errors are happening over time and when they are happening in a simple view. For example, when you see spikes in this graph, that is something that might need to be investigated.

Errors Table
This table breaks down each error and shows you all the details such as: error type (CSP violation, XHRError, TypeError, etc.), file name, error message, number of errors, percentage of total errors, and session impacted (how many users experienced the error). Clicking a row in this table to open the RUM Error Drill-down page.
Native App Error Drill-down Page
If you want more information on a specific error, click a row on the Errors Table to open the Drill-down page. This page is only accessible through the RUM Native App Errors Explorer page.
This page has nearly all of the data from the original page, but is for the specific error selected. The error message is displayed at the top, the file name and contextual details are on the left, and to the right and below are the Top Error breakdown pie charts that this error is occurring for.
Errors Over Time
This graph shows how many times this specific error occurred over time to better diagnosis when/why users are experiencing this error.
Pages with Errors
This scatter plot graph displays the individual errors detected from the above line graph. Clicking a point in this plot will update the Error Details below the Errors table including the File Name and the error message that occurred.
Errors Table
This is the table view of the scatterplot above. Clicking a row in this table will update the Error Details widget below.
Error Details
Click a point in the Pages with Errors scatterplot or a row in the Errors table above to see the error details in this widget.