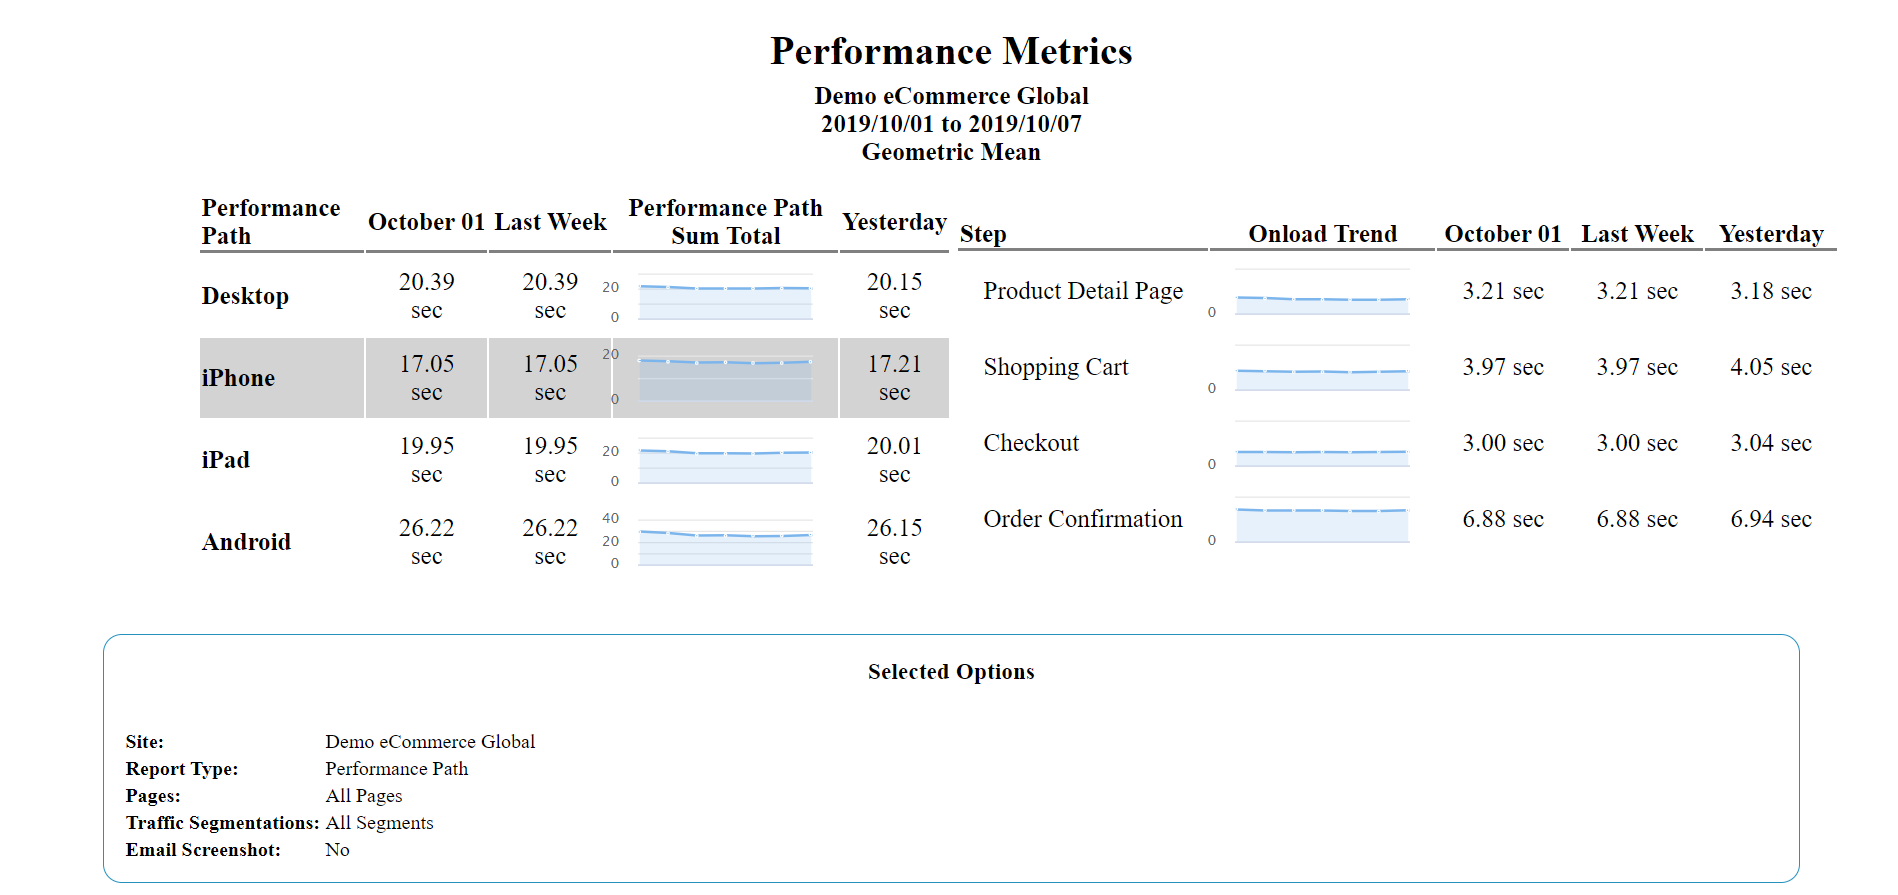
Preview:

Summary:
The Performance Path Report gives you a breakdown of your critical customer journey or real user path's performance by device. In this article we'll walk through the details of configuring and analyzing the report.
Configuring a Performance Path Report
To configure a Performance Path Report, select Real-User data and then choose the Performance Path report option. After you give the report a name and configure the report settings you will arrive on the 4th step. This is where you can apply filter criteria to the report and most importantly this is where you will choose your real user path. If you haven't set up a real user path, first visit the Real User Paths page to configure one.
Analyzing the Performance Path Report
The report has two sections. The section to the left shows the performance breakdown of the total response time of the path, and the section to the right shows the performance breakdown for each step in the path for the selected device. Note you can click the different devices to change the data in the section to the right.
Each section has a performance number for the following columns:
- First day of the week
- Average for last week
- Spark line trend over the report time period
- Yesterday
Also, note you can hover over the spark line to get a tool tip reading for each data point.
Lastly, the selected filter options will appear in the section below. This is where you'll see the site, traffic segment and other filter criteria applied to the report.

Comments
0 comments
Please sign in to leave a comment.