

Overview
The Digital Experience Overview (DEO) is the highest-level dashboard in Blue Triangle, and you can get there by clicking the Blue Triangle icon in the top left of the screen. In this article we'll walk through what's included in this dashboard and how each component works.
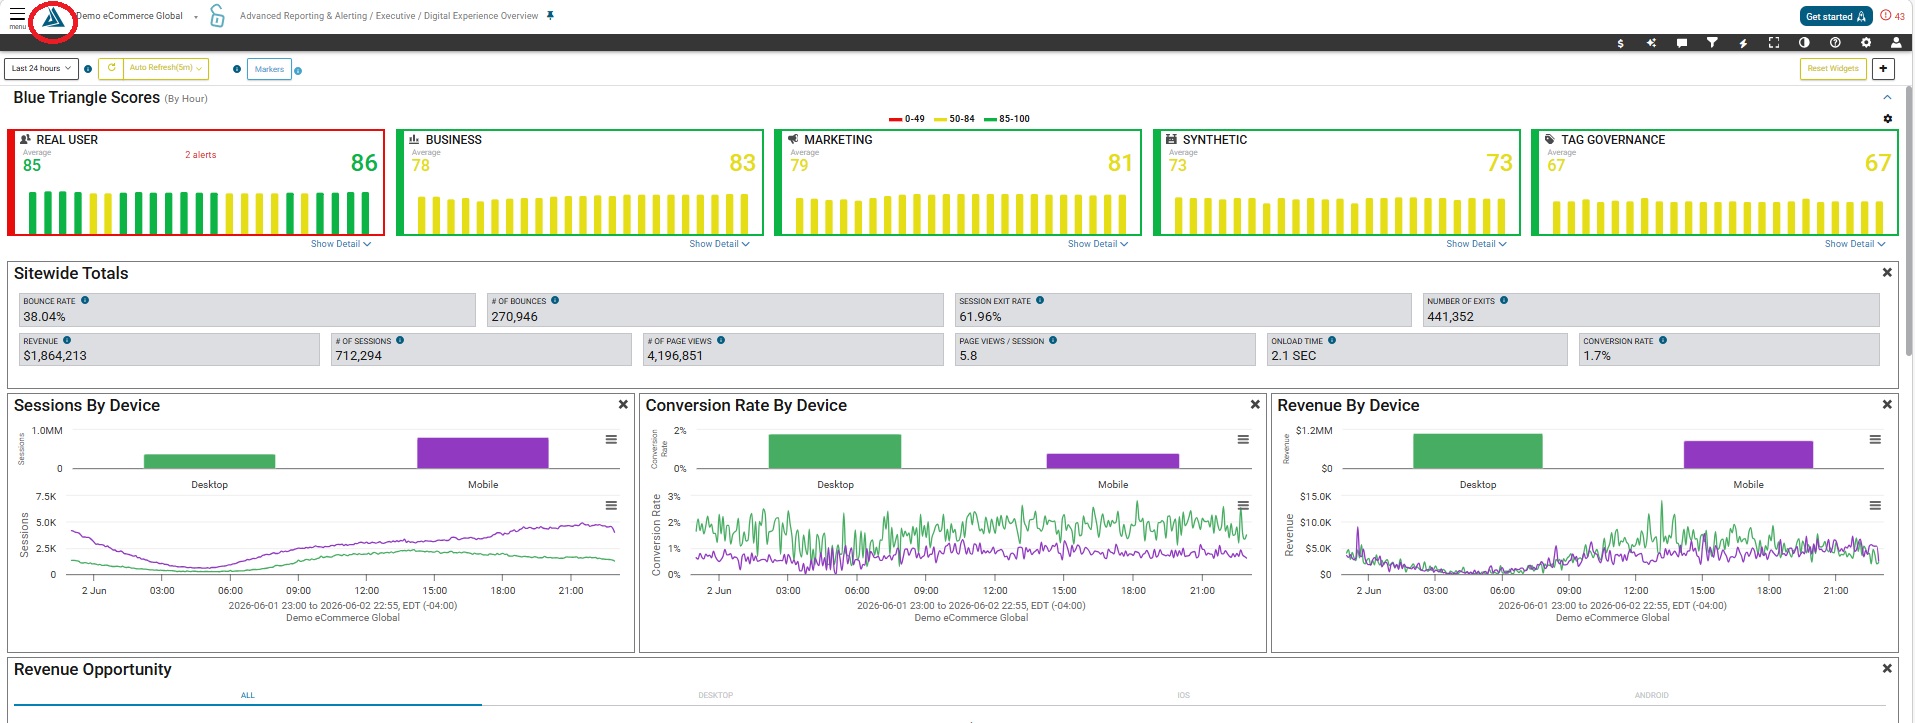
Blue Triangle Scores
We've developed a scoring system from 0-100 for each of the Blue Triangle modules: Synthetic, Real User, Business, Tag Governance, and Marketing.
The card color will indicate if there’s an issue or not. Red is bad, yellow is a warning, and green is good.
You can configure the thresholds for these colors by going into the 'Score Thresholds' found by selecting the gear icon to the right of the cards.
Once in the Score Thresholds menu, you’re able to change the account or site-level thresholds. Only Account Admins will be able to change the account threshold and only Department Admins are able to change the site threshold.
Note: Department Viewers cannot configure the scores and may only edit the size and placement of their dashboard widgets.
By selecting the gear icon, you also have the option to view and edit the "Visualization Controls." Clicking this option will bring you to a new tab for the Visualization Controls page.
The top section allows you to control the order of the cards, as well as if you wanted to hide one or more. You can also hide certain metrics. For example, if you’re in one of the selected cards, and you don’t need to see one of the metrics, you can click the eyeball icon, and hide the metric. This will set its weight to zero and change the calculation for the module’s overall score.
Heading back to DEO page, if you select "Show Detail" under any one of the scorecards, a detailed view of the data that makes up the score for the selected metric as well as their weight is displayed.
For each metric, you can see the trend for that metric as well as the trend for the individual metric’s score. Click on a metric to view this data broken down even further.
Editing the DEO Page
Change Lookback period: To change what time period the page displays, use the lookback selector in the top left. When you’re looking at an hour, the scores will show minute by minute data. If the last 12 hours is selected, it'll show data in 5 minute buckets. At 24 hours, the data will be displayed by hour. If set to 30 days, the data will be displayed by day.
The Blue Triangle Score Cards show an Average score, Current score (most recent), and Difference, where the difference is the change between the two most recent data points.
For example, in the above image- the Marketing module's average is 87, the Current is 89, and the difference between the two most recent data points is 2.
Hiding and Resetting widgets: You can hide any widget by clicking the X button in the top right. Feel free to click and drag the widgets around to customize your view. The only widgets that are stationary are the 'Blue Triangle Scores' and the 'DEO Anomalies and Site Opportunities'. Lastly, you can reset the dashboard to the BT default view by clicking the Reset Widgets button in the top right.
Alerts 
The alerts indicated by the red exclamation point at the top of the page will match the alerts displayed in the cards below and correspond with active alerts in the following areas:
-
Rules based alerts (Real User, Synthetic)
-
Error State Tracking (Synthetic)
-
Missing Services (Tag Governance)
-
CSP Violations (Tag Governance)
-
Domain Whitelist Violations (Tag Governance)
DEO Anomalies and Site Opportunities
Also known as our anomaly detection, the DEO Anomalies and Site Opportunities widget is made up of machine learning that is constantly monitoring your site for issues. When it detects an issue, it will automatically move that issue to the top of the widget and prioritize it by severity: Critical, Significant, Normal, or Minor.
Additional Widgets
Listed below are the other available widgets on the DEO dashboard.
-
Announcements
-
Sitewide Totals
-
RUM Performance Overview For All Pages
-
CSP Implementation Process
-
Data Collection
-
Domain Approval Process
-
Generate and Implement a CSP
-