

Summary:
The Page Response Time Report shows you a trend for a single performance metric including a line for each selected page. This report shows the data in both a graph and table, and can show RUM or Synthetic data.
Configuring a Page Response Time Report
To configure a Page Response Time report, follow along with the configuration wizard and remember to choose your Performance Metric and any Filters you wish to apply to the data.
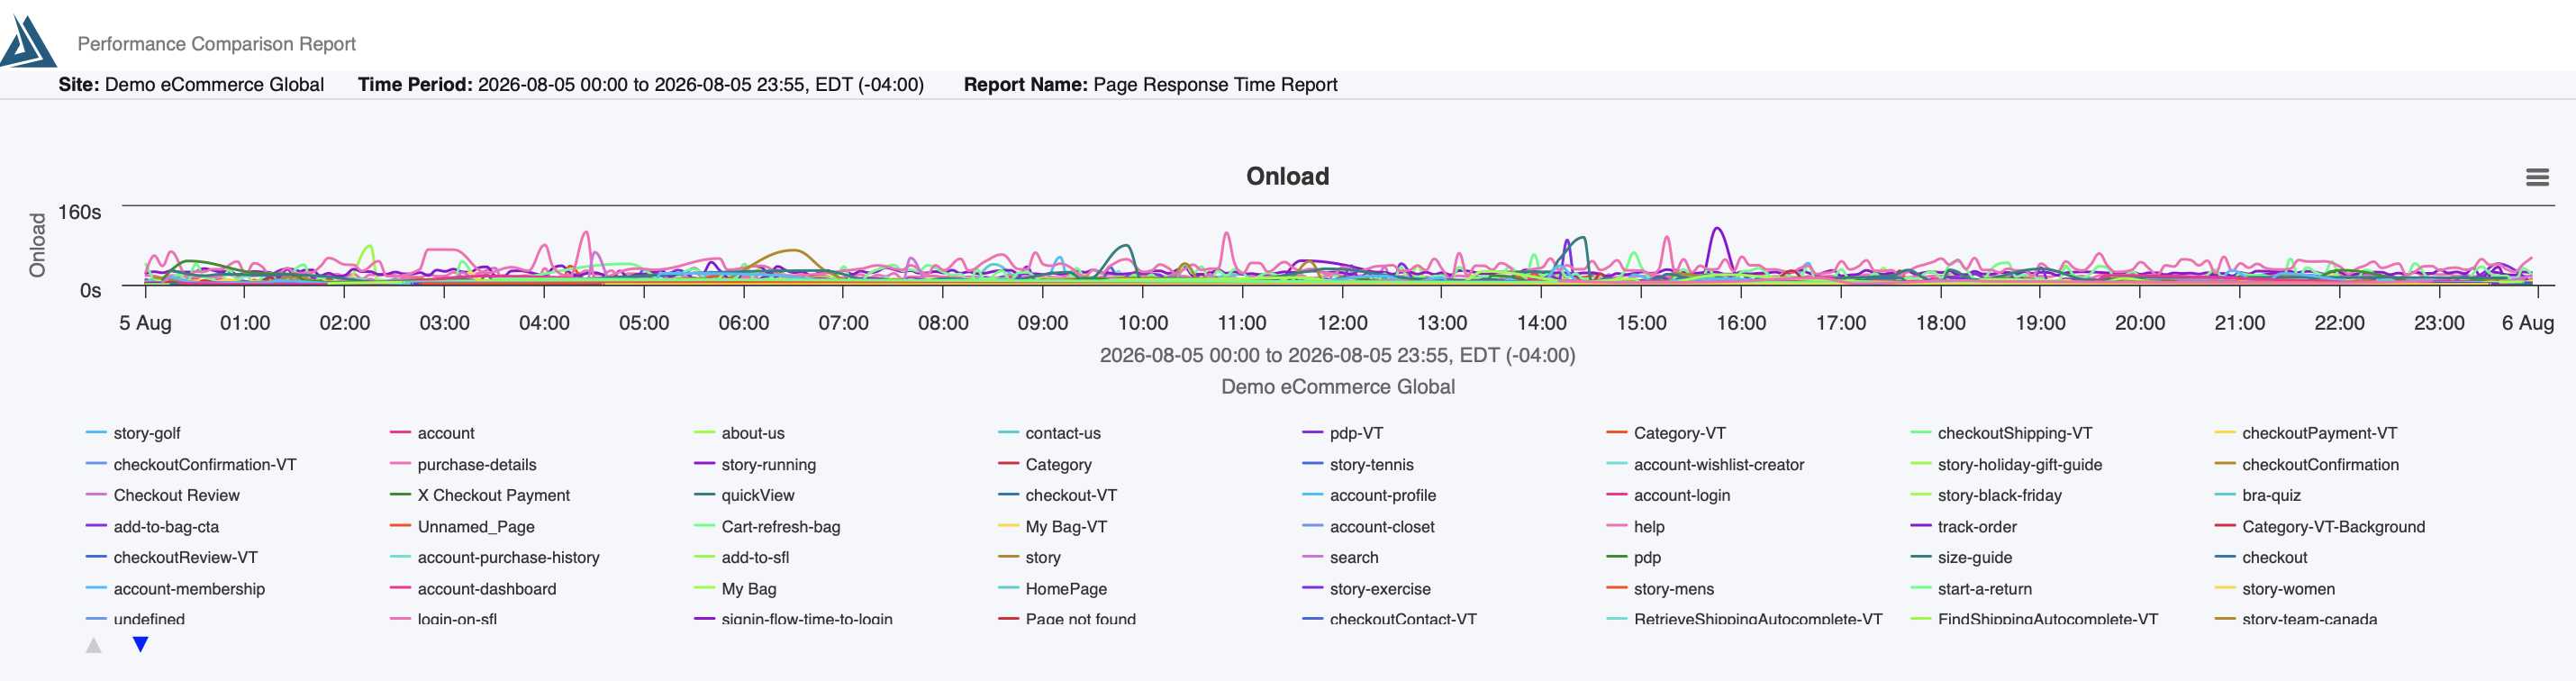
The Performance Metric you choose will be the basis for the performance data in the report. Notice the title of the graph above is "Onload" - the Onload metric was selected in this example. You can see the same thing in the table below - the rightmost column is showing the Onload for each hour in the selected time period.
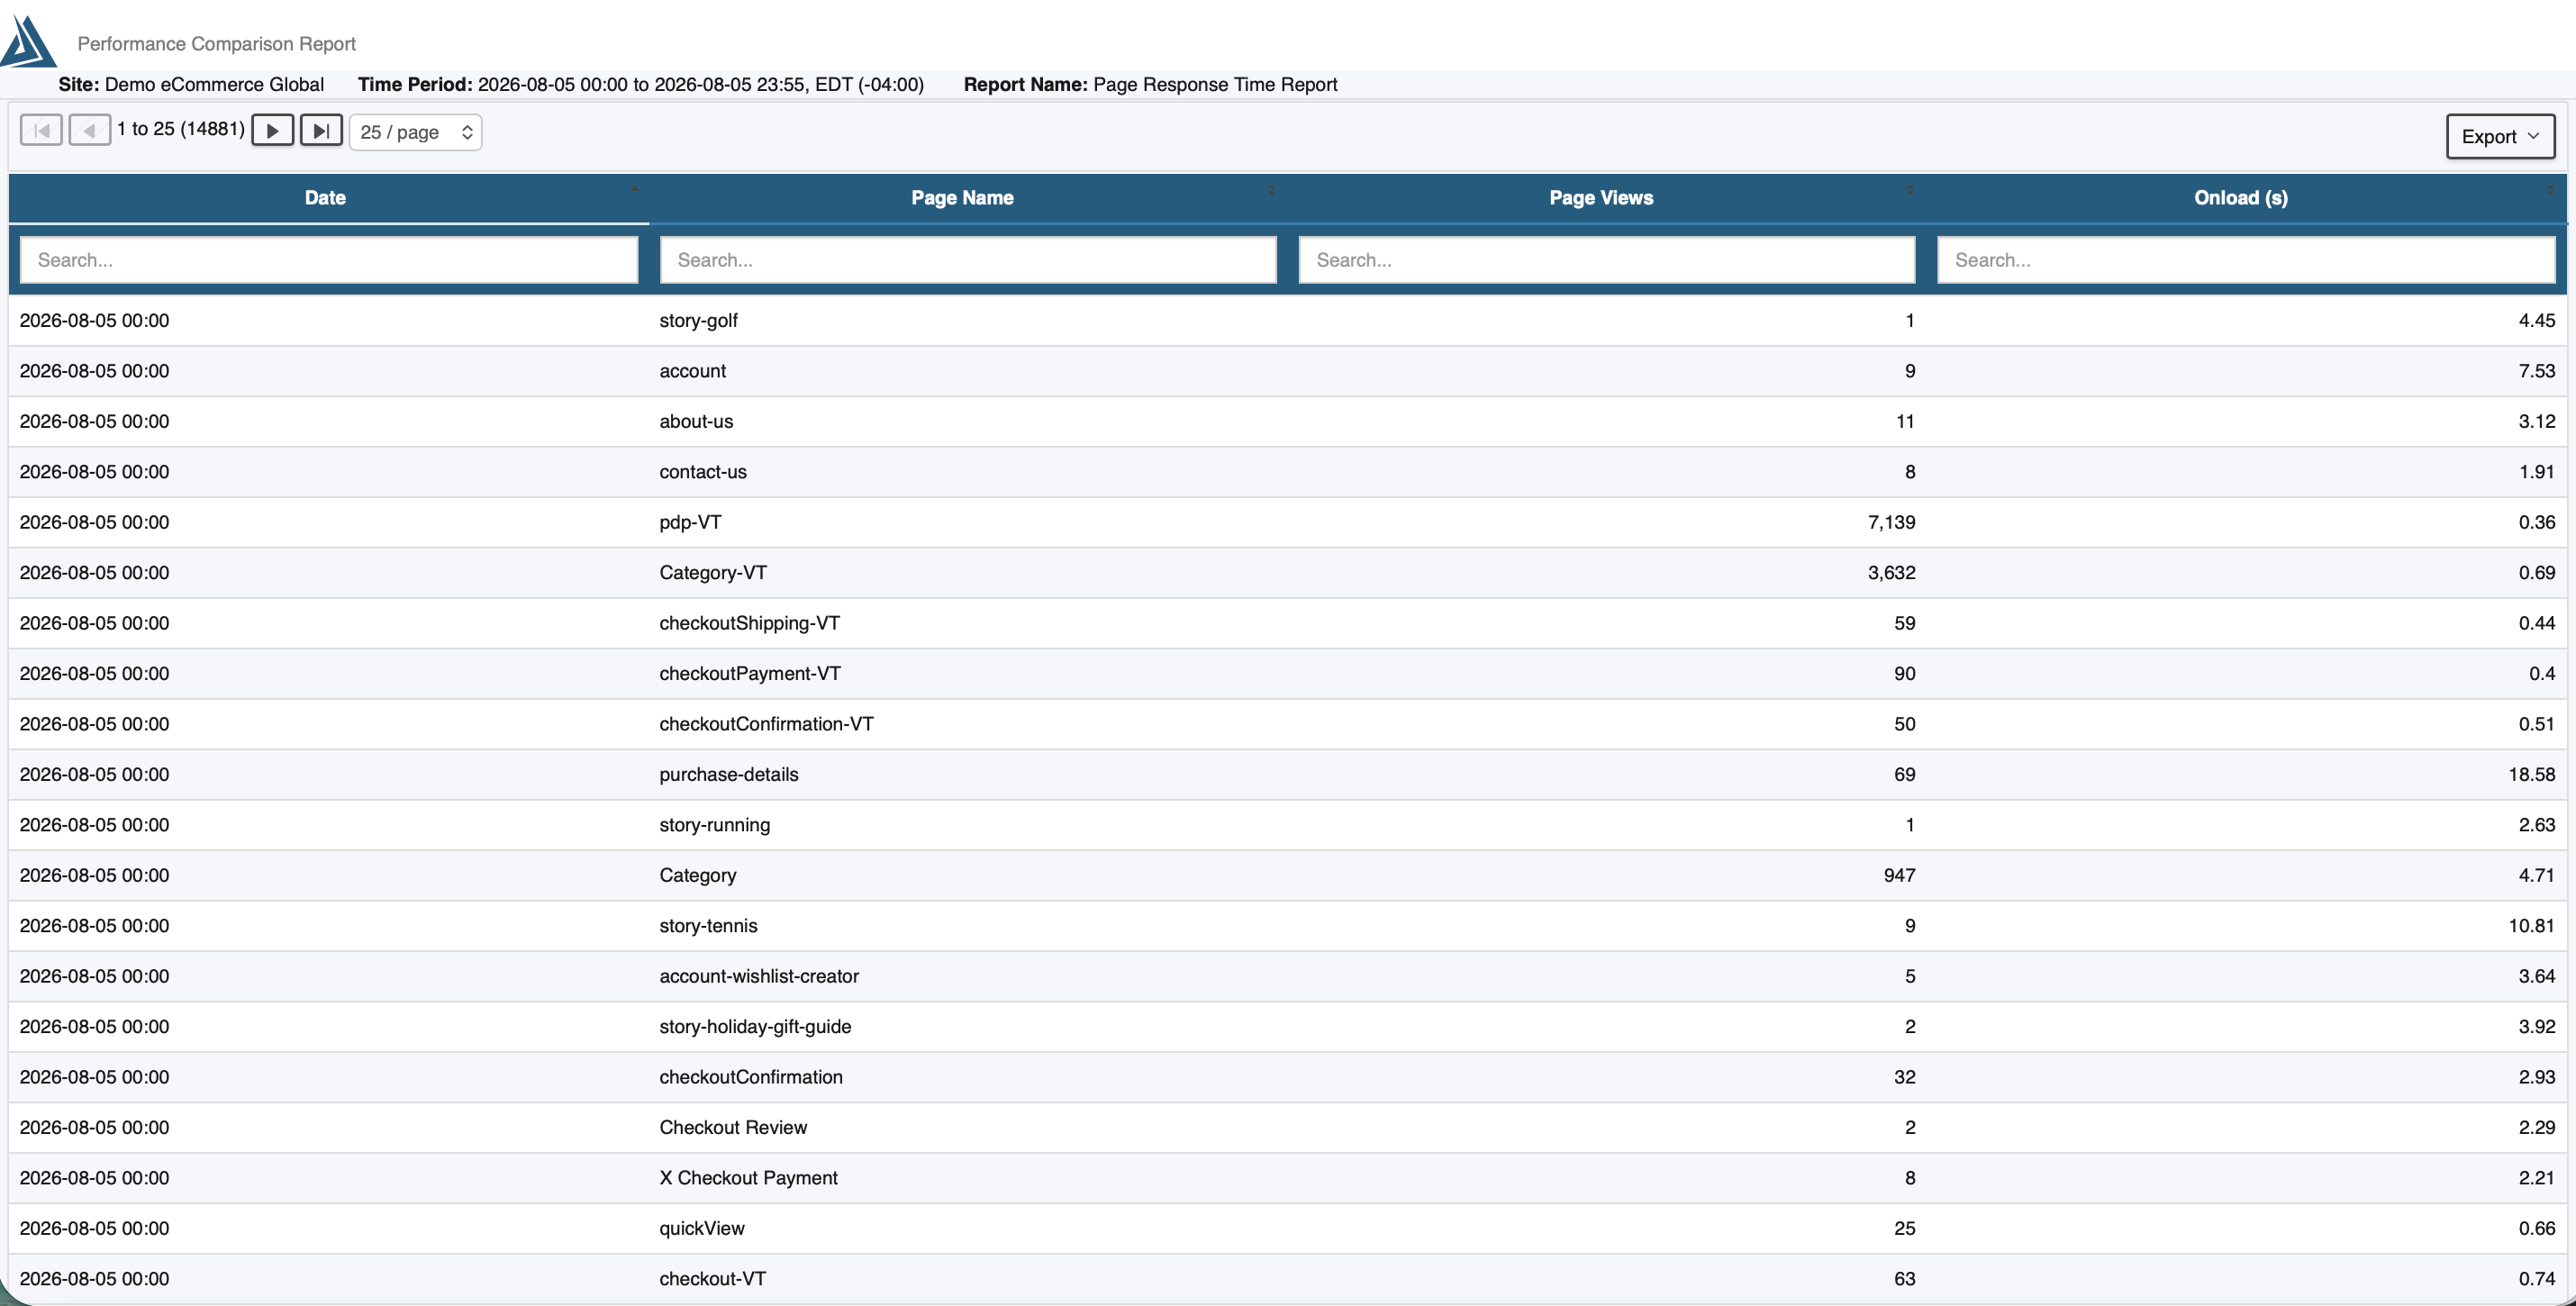
As always you can use the Filters to slice and dice the data anyway you like. If you'd like to see the performance for multiple pages, feel free to choose multiple pages in the Page Name filter - these will show as individual lines in the graph and separate rows in the table.