
Summary
Objects (also called resources, files, and elements) are specific files loaded on a website by first and third-party domains, often to increase page usability. Functionality can come at a price, in the form of slow-loading objects. Objects that are slow to load on a page can lower the quality of user experience of both a page and the website as a whole.
In this article, learn how to:
- Find the slowest-loading objects on your web page(s)
- Discover slow-loading objects in a single user session
- Find out which objects are loading slower than usual on your web page(s)
Finding the slowest-loading objects on your web page(s)
For a quick overview of objects on your web pages, go to the Real User Monitoring / Aggregate Waterfall tab in the Blue Triangle Portal.
On this page, there are:
- two waterfall charts (domain- and object-level),
- corresponding data tables for the waterfall charts (domain and object-level), and
- one table listing performance metrics for objects on your site.
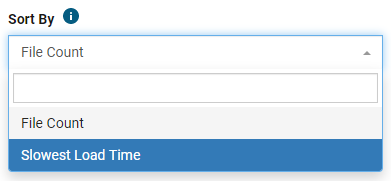
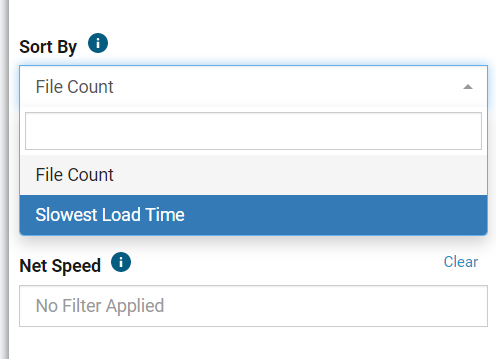
To view the most commonly loaded objects on your web page(s), go into the filter and select File Count under "Sort By." Select Slowest Load Time to view the slowest-loading objects on your web page(s), although these are typically images loading on the main web page.
To view traffic across all your web pages, make sure no Traffic Segment or Page Name is selected.
![]()
Remember to click Apply Filters when you have finished making your selections.
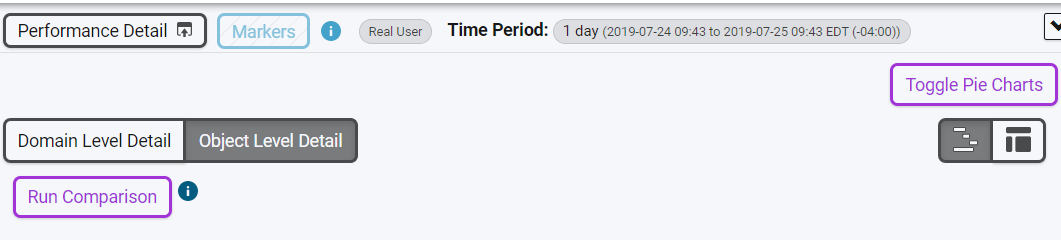
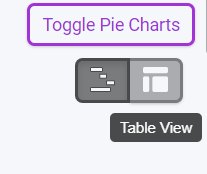
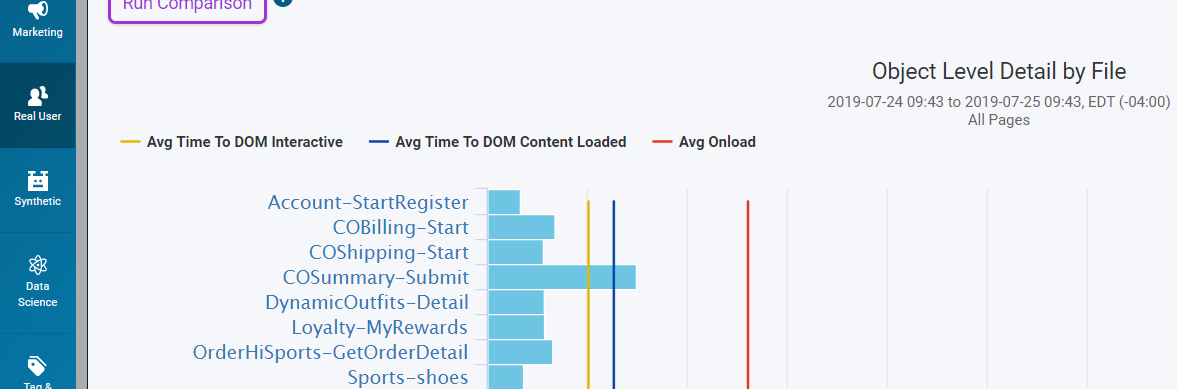
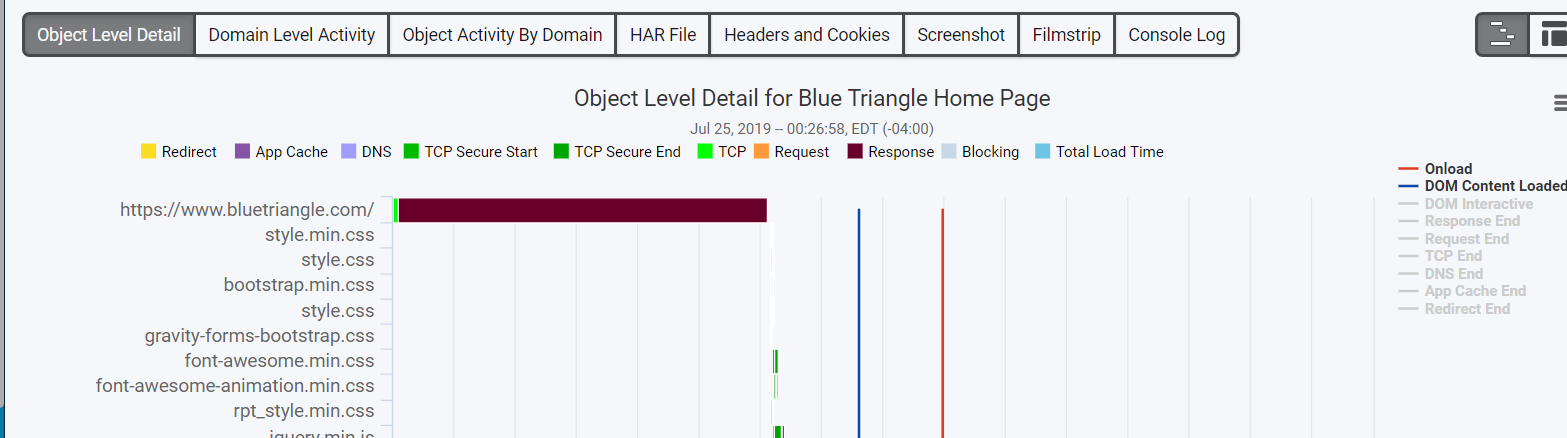
Return to the page and click Object Level Detail. You can switch between the waterfall and table format by using the buttons located on the right of the page, under the Toggle Pie Charts button.
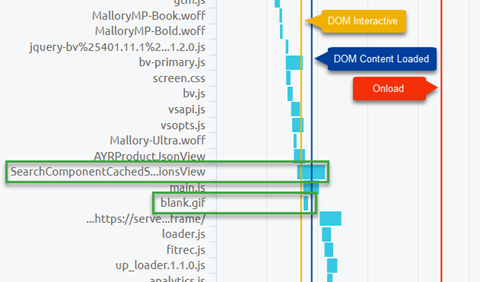
The waterfall gives a visual overview of:
- average object load times,
- the order objects load on a site,
- the interactive point on a page (DOM Interactive),
- the point where most of the page is visually complete (DOM Content Loaded), and
- the point where the page is finished loading (Onload).
In the example below, the outlined objects load at different times. The "Search Component" object begins loading before DOM Interactive and continues past the DOM Content Loaded point. The "blank.gif" object starts loading right after DOM Interactive on average, and finishes before DOM Content Loaded occurs on most pages.
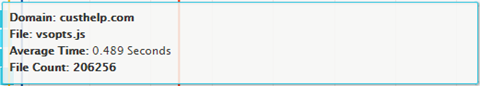
Hovering over an object gives:
- the Domain that loads the object,
- the name of the object (File),
- the Average Time it took the object to load on all pages during the selected period, and
- the number of times the object was called during that period for all page views (File Count).
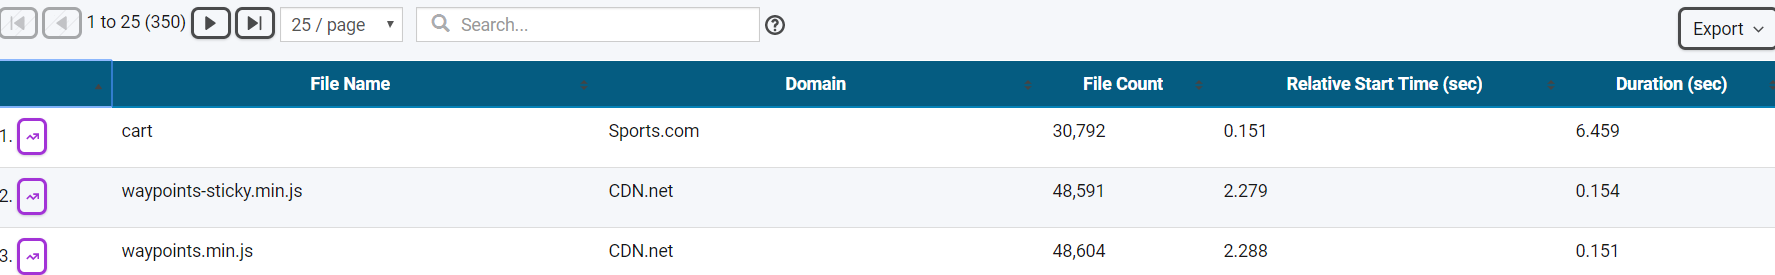
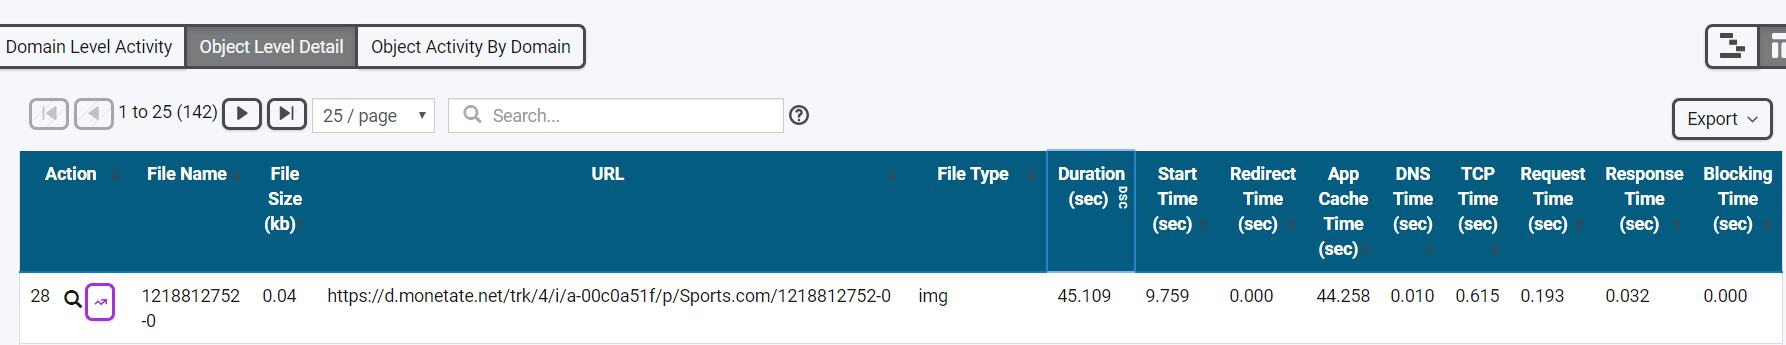
Switching to the Object Level Detail table allows objects to then be sorted by the average time they took to load on site. Remember you can switch between the graph and table view by clicking the buttons in the top right.
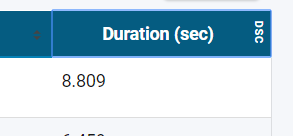
Click on the Duration column header twice to sort the objects from slowest to fastest load time ("DSC" should appear beside "Duration" in the header when hovering).
The table gives data by object for:
- the order the object usually loads relative to others on the page (the number in the first column),
- the name of the object (File Name),
- the Domain that called the object,
- the number of times the object was loaded (File Count),
- the Relative Start Time the object began loading in the life of the page load, and
- the Duration of the entire loading period for the object.
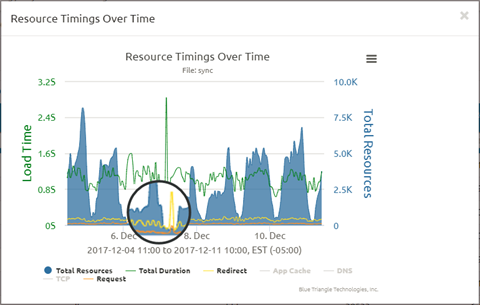
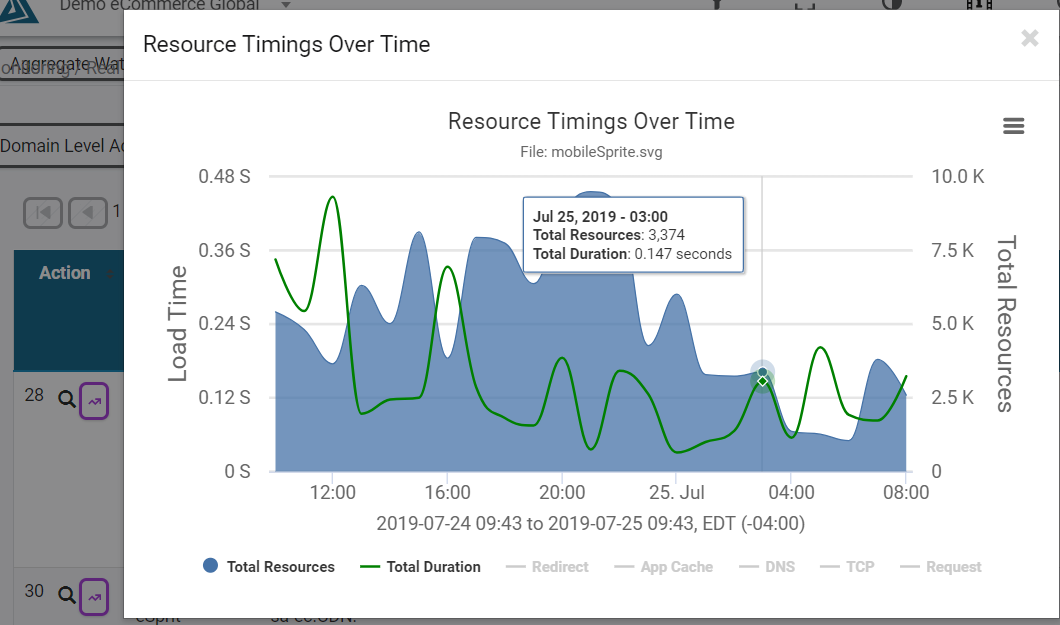
Additionally, clicking the arrow icon in the first column brings up the Resource Timings Over Time graph for that object in the selected period, which can trend the following:
- Total Resources, or the number of times the resource was called at a particular time,
- Total Duration, or how long on average the resource took to load,
- Redirect,
- App Cache,
- DNS,
- TCP, and
- Request, which are all resource timings from w3c.
In the example below, the "sync" object had a spike in duration on December 7. Trending the request time and the redirect time showed a spike in how long each of those events took as well, meaning that there was likely a connectivity issue with the domain calling the object at that time.
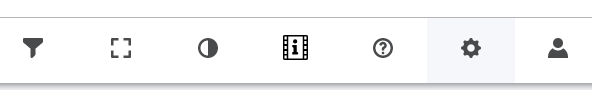
To view the average slowest objects on a site, click the filter button located in the toolbar at the top of the screen

Then change File Count to Slowest Load Time under the Sort By drop-down menu, and don't forget to click Apply Filters at the top of the filters menu.
Back on the page, click on Object Level Detail and the graph view to see a waterfall graph of the slowest loading objects.
Discover slow-loading objects in a single user session
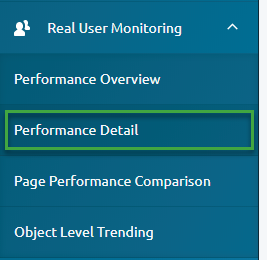
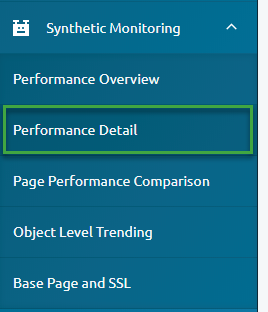
To view session-by-session, pageview-by-pageview details at the object level, go to the RUM// Performance Detail tab of the Blue Triangle Portal. Whatever filter options are selected will transform the way the charts and tables on the page display.
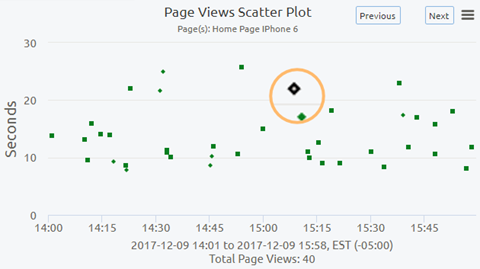
Scroll down to the Page Timings Over Time graph. The date range on the x-axis is the date from the filter. Click anywhere on the graph to see a smaller time window in the scatter plots beneath this graph.
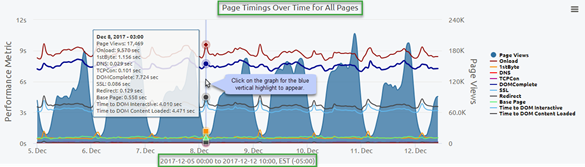
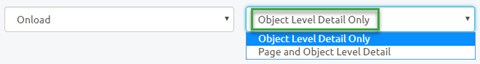
The scatter plots allow access to resource timings data for an individual page view. Select Object Level Detail Only in the drop-down above the Page Views Scatter Plot. This will limit the data points shown to page views for which the object level details were collected.
From there, click on any triangular data point in the scatter plot to see the data for that page view.

Selecting a data point populates the bottom of the page. Scroll beneath the Performance Breakdown section. Domain Level Activity should be the default chart that displays. Click the Object Level Detail tab and select Graph from graph/table buttons on the right to see the object-level waterfall chart for this particular page view.
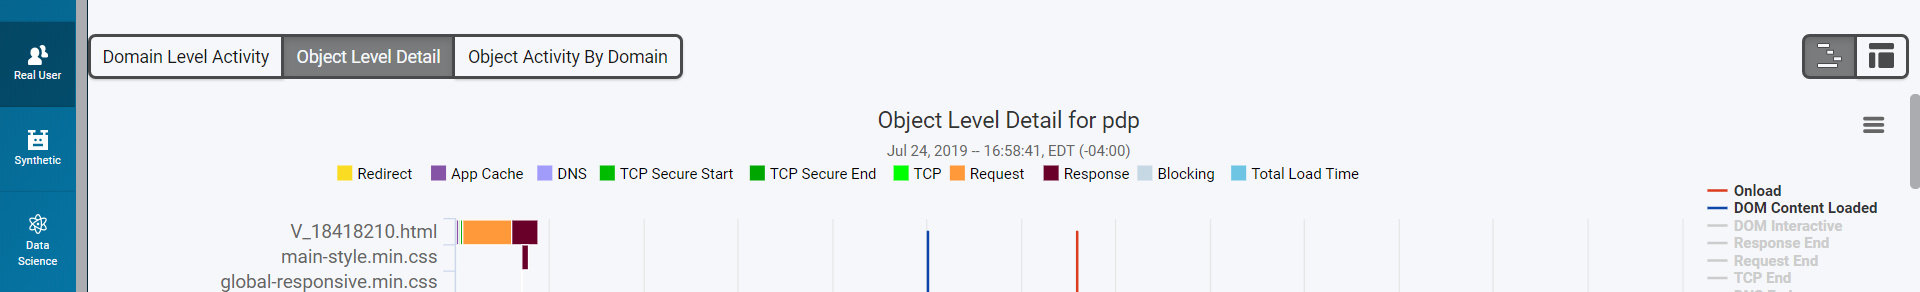
The Object Level Detail waterfall chart on this page gives additional information about object-level performance details:
- See at a glance how long objects take to load relative to others on the page.
- Find the breakdown of the duration for each object loading using the legend beneath the title, including the blocking time.
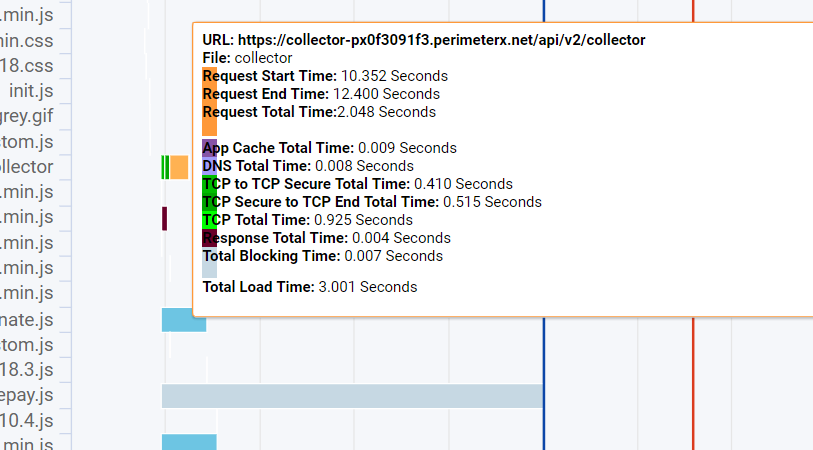
- Hover over an object to get a more detailed breakdown of the duration.
Select Table from the buttons on the right to see a list of objects loading on the page with their performance timings.
Click twice on the Duration column header to sort the table from the slowest-loading object to the fastest. The column should read "DSC" on hover at this point.
Clicking on the arrow icon for an object in the Action column pulls up averaged metrics for the object trended over the time period selected in the filter.
Sometimes rogue objects cause a page to have trouble loading. To see exactly what was going on during a page load, navigate to the Synthetic// Performance Detail tab of the Blue Triangle Portal.
Go through the same process as on the RUM// Performance Detail tab (see above). In the Page Views Scatter Plot, select any data point.
Once a data point is selected, scrolling down to the bottom section includes an additional tab that the real-user web content detail (WCD) data does not. Select the desired option from the tabs at the top:
- HAR File(all uninterpreted WCD data)
- Headers and Cookies(a table containing a list of request and response headers and cookies)
- Screen Capture(a snapshot of the page taken after the Onload event)
- Film Strip(a series of snapshots taken every couple hundred milliseconds to show page load progression)
Find out which objects are loading slower than usual on your web page(s)
Aside from looking at the Resource Timings Over Time graphs in the sections above, the 30-Day Domain Report looks at one page and:
- gives the average duration of all resources on a domain over the past seven days,
- compares the daily values to the 30-day average for that domain,
- trends performance on the page for all page views,
- trends performance on the page for all views with resource timings collected (only certain browsers collect web content detail data), and
- shows domain- and object-level aggregate waterfalls for the past seven days.
To begin, click the gear icon in the toolbar at the top of the page.
From there go to the Reports button under Report Configuration.

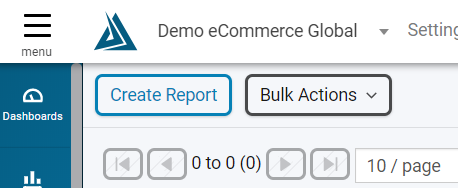
To configure a 30-Day Domain Report, go to the left-hand side of the page and click the Create Report button.
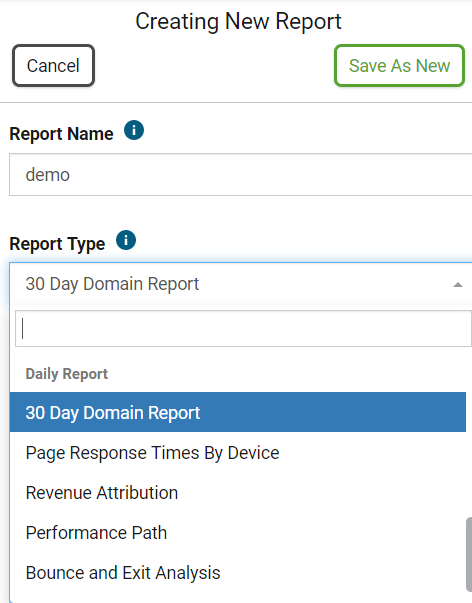
Once you give the report a name, click the Report Type drop-down menu and scroll to the bottom to find the 30-Day Domain Report option. Selecting this will change the rest of the configuration options on the page.
Configuring the data for the report:
- Changing the Bucket Size impacts the way the Performance Details trendlines display in the report.
- The traffic settings change which page views are used for data aggregation. Note that only one page of the site can be used in the report, chosen under Page Name.
- The Sort By filter configures which objects are aggregated in the look-back period of the report. Sorting by File Count usually gives the most relevant information.
The rest of the configuration deals with how the report is stored:
- Report Time Period cannot be changed to any other option than one week. It is a rolling look-back period of the past seven days.
- E-mail Frequency changes how often the report is run and e-mailed, ranging from a daily e-mail to an e-mail every seven days.
- Report Name allows the report to be given a unique identifier. Best practices here are to include the site name and the page name, along with any other specific traffic or sorting configurations, since report configuration is not given when looking at a list of reports.
- Use Custom Subject Line allows the e-mail being sent to have a specific subject line, which can be changed for easy identification, or for e-mail filtering.
- E-mail Address has to include at least one valid e-mail address. Multiple addresses can be separated by comma.

Once the report is configured, click Save as New at the top right corner of the screen.
The page will not refresh, but the report has been created at this point. The new 30-Day Domain Report will now appear in the Configured Reports and Enabled Reports sections at the top right of the page.
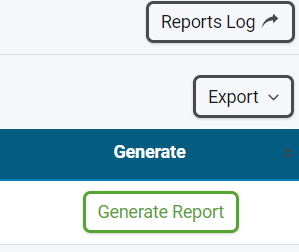
To run the report immediately, click Generate Report under the Generate tab of the report. The results will be e-mailed in about twenty minutes.
Once the report appears, open it and go to the Average Load Time By Domain section, which is the second section of the report. In this table, every domain that makes calls on the selected page is listed in a table with:
- the average load time (duration) for each domain over the past seven days,
- the 30-day average load time for the domain,
- the average percentage of elements (also called objects, resources, and files) the domain loads on the page, and
- the average number of elements the domain loads each page visit, which can be less than one when a domain calls a small number of objects on a limited number of pages with the same page name

Table cells with averages for each of the past seven days may be highlighted either red or green:
- Red cells have a daily duration average significantly worse than the 30-day average.
- Green cells have a daily duration average significantly better than the 30-day average.
Click twice on the column header for any duration period to sort the table from the slowest- to the fastest-loading domains in that period.
Comments
0 comments
Please sign in to leave a comment.