

Overview
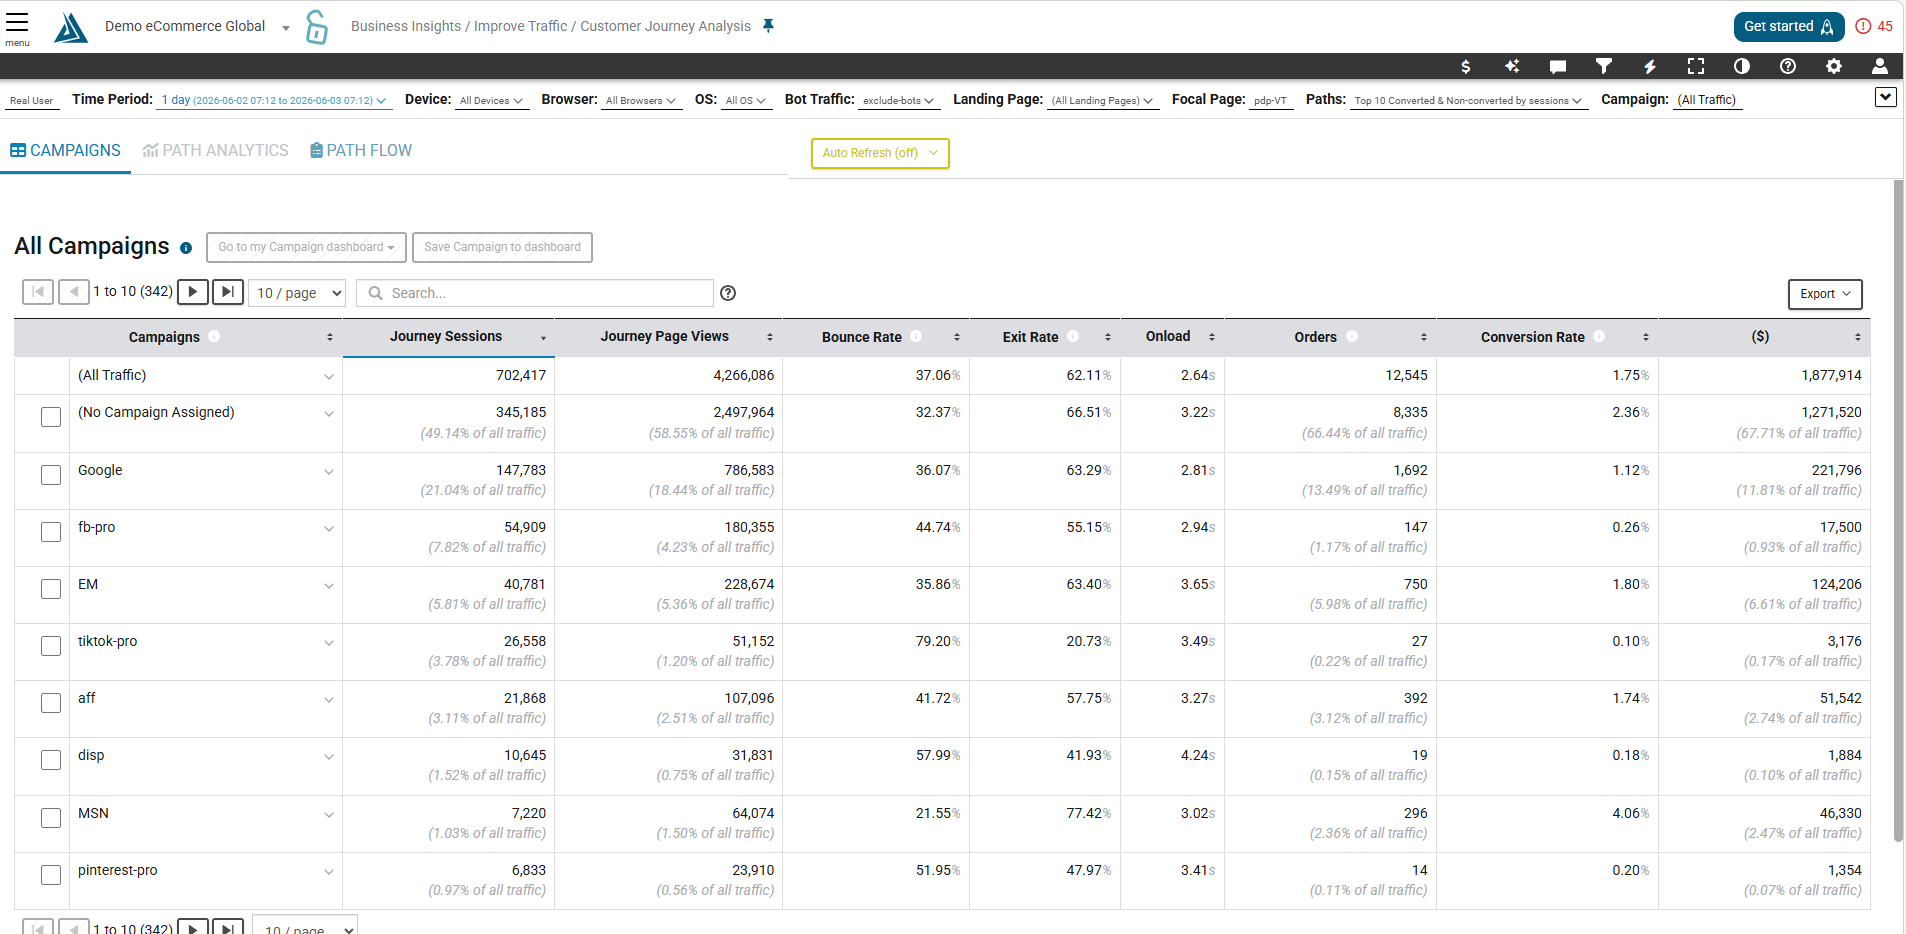
The Customer Journey Analysis page displays a simple visualization of your campaigns and customer's paths in real-time. Utilize path analytics to drive higher conversion rates by finding the bottlenecks in your customer journey. Quickly identify customer behavior and optimize their experience along each step of your purchase paths.
For help configuring tracking for revenue, traffic segmentation, marketing campaigns, A/B segments and others, we invite you to checkout our help articles. Or, consider professional assistance from your BT CS representative.
How to Find the Customer Journey Analysis Page
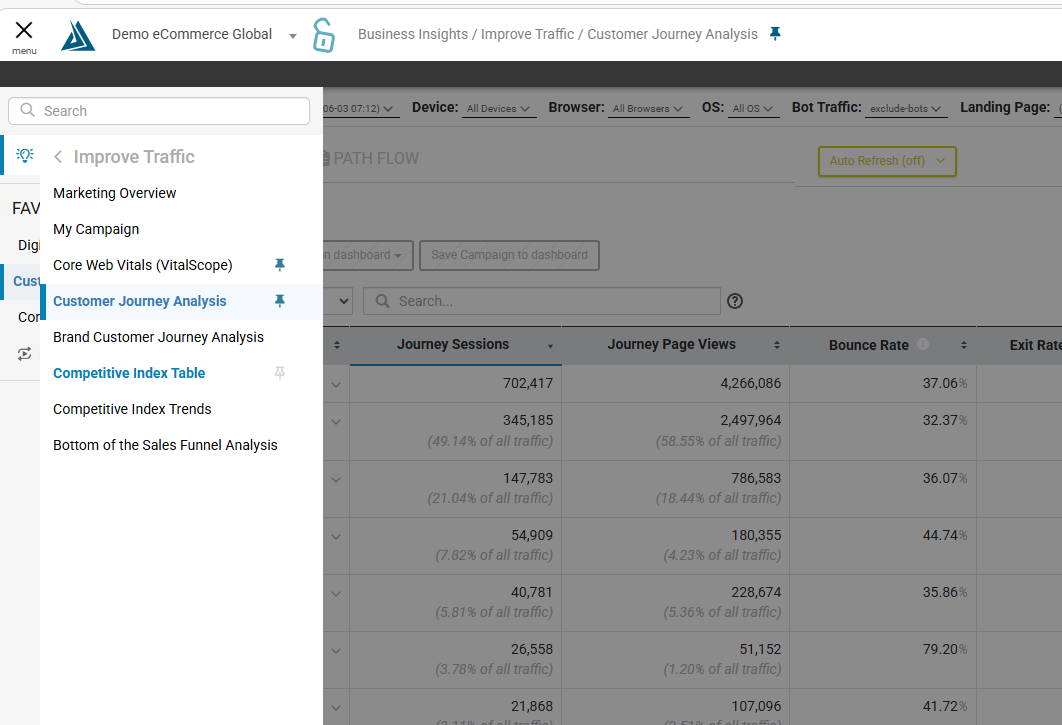
Navigate to Business Insights on the top left menu → Improve Traffic → Customer Journey Analysis
Navigating the Customer Journey Analysis Page
Campaigns
The 'All Campaigns' table under the 'Campaigns' tab contains a list of configured campaigns, as well as (All Traffic) and (No Campaign Assigned).
Metrics reported include:
-
Sessions
-
Page Views
-
Bounce Rate
-
Exit Rate
-
Onload
-
Orders
-
Conversion Rate
-
Revenue
Click any row to see a list of landing pages from that campaign as well as the performance of traffic going to each landing page.
Select a Landing Page for more detail, this will open the Path Analytics tab.
Path Analytics
The Path Analytics tab is consists of the 'Hierarchy Ladder' and the 'Journey Details' table. Converted paths and Not Converted paths are ranked separately. This helps you understand the journeys that are performing well versus the ones that are not.
The Hierarchy Ladder displays overall campaign performance at the top followed by campaign performance for traffic landing on the selected Landing Page in the bottom two rows. To select a different Landing Page, click the quick filter dropdown at the top of the page.
The Journey Details table offers either a page or path breakdown of your traffic. The Path tab shows the ways users navigated while visiting the site along with the metrics for the experience includes a Path Rank column. Clicking a path in this table will open the Path Analytics tab with that path selected. Under the Pages tab, this data is broken down by page reflecting the filter options selected for Paths, Landing Page, and Campaign. Use the quick filter drop down menus at the top of the page to change the filter selections for this table.
Path Flow
There are two different views within Path Flow, Landing Page View and Focal Page View. Select a page card in either view to highlight the user path associated with that page.
Landing Page View displays paths taken by users beginning from a site's landing page (selected in the filter options).
Focal Page View displays the paths taken by users specifically from the selected Focal page in Filters.
Filters
Use the quick filter bar the top for fast access to filters such as Time Period, Landing Page and Focal Page.
Click the filter icon at the top right of the page to open the full Filters menu.
Special Considerations for Real User versus Native App Data Type
The first filter that is listed in the filters menu allows the user to select the Real User Data Type or the Native App Data Type. Because native webviews can exist within either of these data types, it is important to be able to see when this occurs.
When the Real User Data Type is set to Web Browser Data, there will be an indicator in the top right corner of the card when there are Native Webviews included in the count. By hovering over this icon, the user can see how many Native Webviews were counted:
When the Real User Data Type is set to Native App Data, there will be an indicator in the top right corner of the card when the page was a Native App Screen (and NOT a Native Webview). By hovering over this icon, the user can see a reminder that the card represents views that occurred on the app: