Summary:
Fully Loaded Time is the time from the start of the first request to the end of the last request to finish. Fully Loaded Time is useful as a tell tail sign that something on the page has become more chatty (a lot of back-and-forth between the client and the server). For example, when Fully Loaded Time increases from 15 seconds to 55 seconds something on the page has changed to become far more chatty. Fully Loaded Time is not intended to be used as primary performance metric and can only be used with synthetic data.
Where to use Fully Loaded Time:
- Synthetic Site Health Dashboard Scatterplots
- Performance Details Dashboard Widget
- Performance Details Page
- Page Speed Comparison Page
- Performance Overview
- Data Science
Example
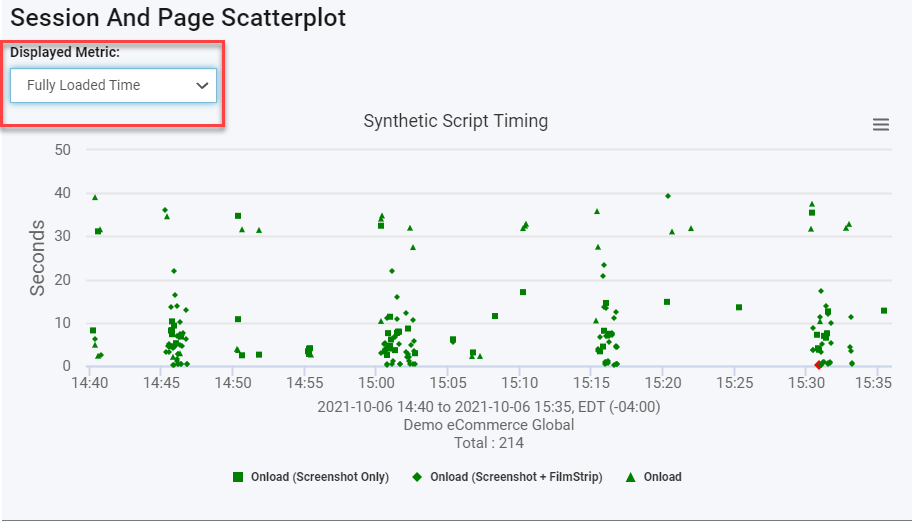
This is an example scatterplot pulled from the Synthetic Site Health Dashboard

If you click a point in the scatter plot to open the additional details, Fully Loaded time can be found under the Domain Level Activity, Object Level Detail, and Object Activity By Domain tabs.
Example:
Comments
0 comments
Please sign in to leave a comment.