
Table of Contents
Overview
All users with BI access enable in the User Configuration page will have the the Explorer role enabled for BT BI have the ability to create and edit explores within the tool. Explorers cannot save or share dashboards or looks.
How to find Explores in BT BI
An Explore is a starting point for a query that is designed to explore a particular subject area. To open an Explore, open an existing dashboard or look. Select the compass icon on any look to open the Explore Menu.
Explore Menu:
How to use Quick Start analyses as a starting point for Explores
If you have the Creator role enabled for BT BI, you will have access to the quick start create menu for explores.
To reach this menu, select Create Content. For more information, see this article from our help center.
You do not have to select a quick start to begin. To bypass, simply select a field option from the left-side menu to begin building out your explore.
Fields
How to add fields to Explores
To add a field, follow these steps:
- Select a field from the field picker in the left-side menu to add it to the query.
- Select the Run button to re-run the query.
How to use the field picker
The field picker, which is located on the left side of the Explore menu, includes the following elements from top to bottom:
- The Explore name displays the name of the current Explore.
- The Find a Field search bar lets users search for fields that match specific terms and criteria.
- To change the scope of your search, click Search Options. You can limit your search to field labels, field descriptions, group labels, or view labels.
- The All Fields tab displays all available fields for an Explore.
- The In Use tab displays all Explore fields that are currently in use.
- The view level summary displays the total number of selected fields from a view. This number is shown when a view is collapsed, and when it is expanded.
-
The Explore summary displays the total number of fields in an Explore (including custom fields and table calculations when permissions allow) in the bottom left corner
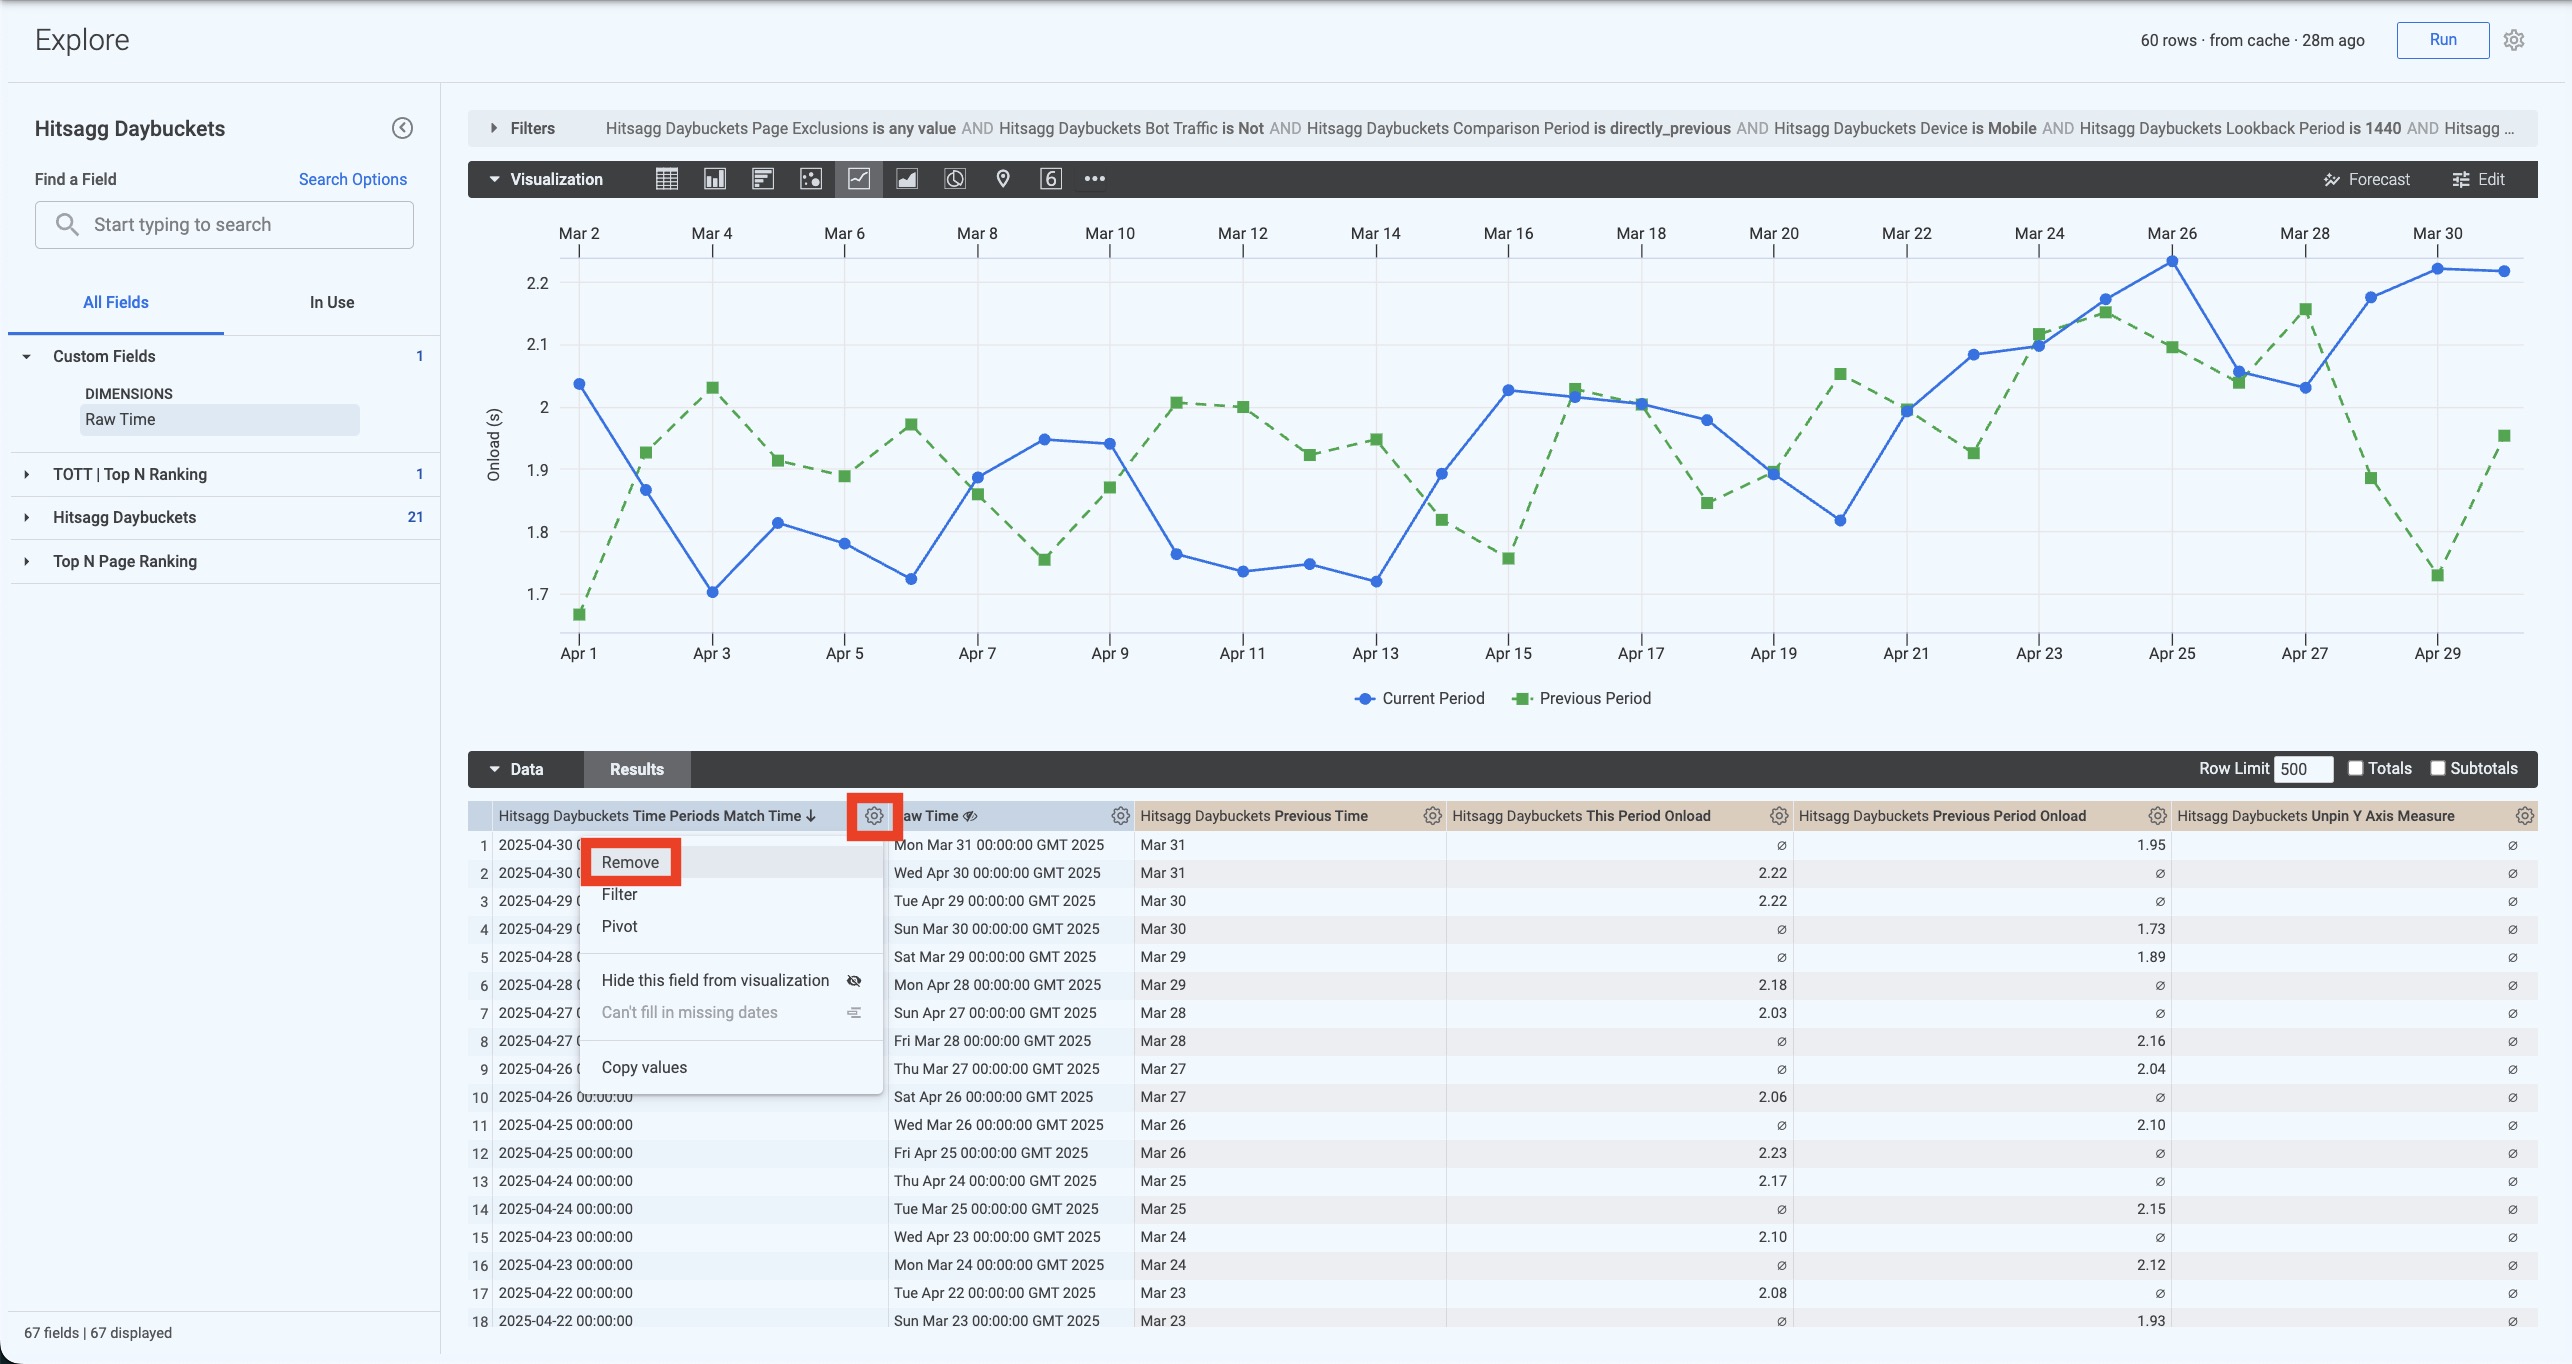
How to remove fields
To remove a field from an Explore:
- Select the desired field in the field picker or choose Remove from the column's gear menu in the Explore data table.
- Select the Run button to re-run the query.
How to sort data
Unpivoted data on the Explore page is sorted by default according to the following prioritization:
- The first date dimension, descending
- If no date dimension exists, the first measure, descending
- If no measure exists, the first added dimension, ascending
A field's sort order is indicated in the data table in several ways:
- With a number next to the field name that distinguishes its sort-by order as compared to other fields
- With an arrow next to the field name that indicates the sorting direction (pointed up for ascending or down for descending)
- With a pop-up that appears when you hover over a field name
You may want to sort data differently than the default order. You can sort by selecting a field's name in the data table to sort the query by that field:
- Select a field name once to sort by that field in descending order.
- Select a field name twice to sort that field in ascending order.
You can select a field multiple times as necessary to attain the desired sort order.
*Caution: If you reach a row limit, you will not be able to sort row totals or table calculations.
How to pivot data
Multiple dimensions are often easier to look at when you pivot one of the dimensions horizontally. Each value in the dimension will become a column in your Look. This makes the information easier to consume visually, and reduces the need to scroll down to find data.
To pivot Explore results by a dimension:
- Hover over the dimension in the field picker and Select the Pivot data icon.
- Select Run to re-run the query.
- You can unpivot a field in one of two ways:
- By selecting the Unpivot option from the field's gear icon menu at the top of the column in the data table
- By selecting the dimension's Pivot data icon again in the field picker
You can also pivot from the table by selecting the gear icon in the desired column and then selecting the Pivot option.
From here, click the Run button at the button at the top of the Explore menu.
How to reorder columns
You can reorder columns in the Data section by selecting a column header and dragging and dropping the column to its desired position. The Explore's visualization will reflect the new column order after you select the Run button.
Columns are organized in the Data section by field type:
- Dimensions
- Dimension table calculations
- Measures
- Measure table calculations
- Row totals
For the most part, columns can be reordered within each field type but cannot be moved out of their field type section.
For example, dimension table calculations can be rearranged among themselves, but you cannot place a dimension table calculation in between two measures.
One exception, however, is that you can use the arrow next to the row totals checkbox on the Data tab to move the row total column from the far right of the data table to just after the dimension table calculations.
Columns under a pivoted dimension can be reordered, but the order of pivoted dimensions can be changed only by changing the sort order, not by manual reordering.
How to display totals
Sometimes a summary of your data is useful. You can add column totals to an Explore query by checking the Totals checkbox in the upper right of the Explore data table and then rerunning the query.
When Totals are not Available
There are some cases when totals won't be available:
- Column totals are available only for measures and table calculations that exclusively reference measures, not for dimensions or table calculations that reference dimensions.
- Row totals are available only for measures, not for table calculations that are based on dimensions or dimensions.
- Certain types of columns won't be totaled, because of database limitations or because the value would not make sense as a total. For example, you can't add together a list of words.
Filtering Data
Filters let you restrict the data that you are viewing to items of interest. Any field in your Explore can become a filter.
You also don't necessarily need to add a dimension or measure to your results to filter on it. For example, you can create a query that filters the Order Date to the last 90 days, even though your results only show Customer and Number of Orders.
Basic Filters
Basic Filters are the most commonly used; we provide appropriate drop-down lists, calendar widgets, and text fields.
There are a couple of ways to add a basic filter:
- In the Field Picker, select Filter by field to the right of the field name.
- In the Results tab of the Data panel, select the gear in the field header, and then select Filter.
Filters appear in the Filters section. To remove a filter, select Remove to the right of the filter clause.
Why are filters not populating?
All dynamically generated filters (for example, page name) MUST be dependent on a time filter.
To generate options follow these steps:
- Edit the Explore
- Click the 3 dots next to Time Range
- Click Edit
- Click Additional Options
- Select filters to update when this filter changes
- Select the filters you want to follow those rules (Traffic Segment, Page Name, etc.)
Advance Matches
Advance Matches allow for a more advanced condition for a field, such as intricate text searches, or a date range that starts in the past and extends for a certain number of days.
To add an advanced matches filter, select the matches (advanced) option from the filter's condition drop-down menu.
In the text field, enter your filter expression. To view all available filter expressions, see the BT BI filter expressions documentation page.
To enter a special character in an advanced matches filter, first add a leading carat (^). For example, to filter on Santa Cruz, CA, you would enter Santa Cruz ^, CA.
Custom Filters
To add a custom filter from the Filters section, follow these steps:
- Select + Custom expression.
- Enter a dimension or function to have BT BI display a list of functions, operators, and field names to use in your expression. Select a term in the drop-down to add it to your expression. When finished, your custom filter expression must evaluate to
yesorno. - Select Save.
- Select Run to run your query with your custom filter applied.
Comments
0 comments
Please sign in to leave a comment.