Summary
In this guide you will learn how to navigate your Network Health Check Monitors to efficiently find the data you are looking for. There are a few different areas you can view this data:
Overview Page
In the Error Tracking and Performance widget you are able to see each Synthetic Monitor's performance in regards to latency, as well as it's error state over time. You are able to view the performance detail for a specific monitor by clicking the button above the orange arrow in the graphic below. You are also able to edit the Monitor or run an Instant measurement with the cog and lightning bolt buttons to the right of it.
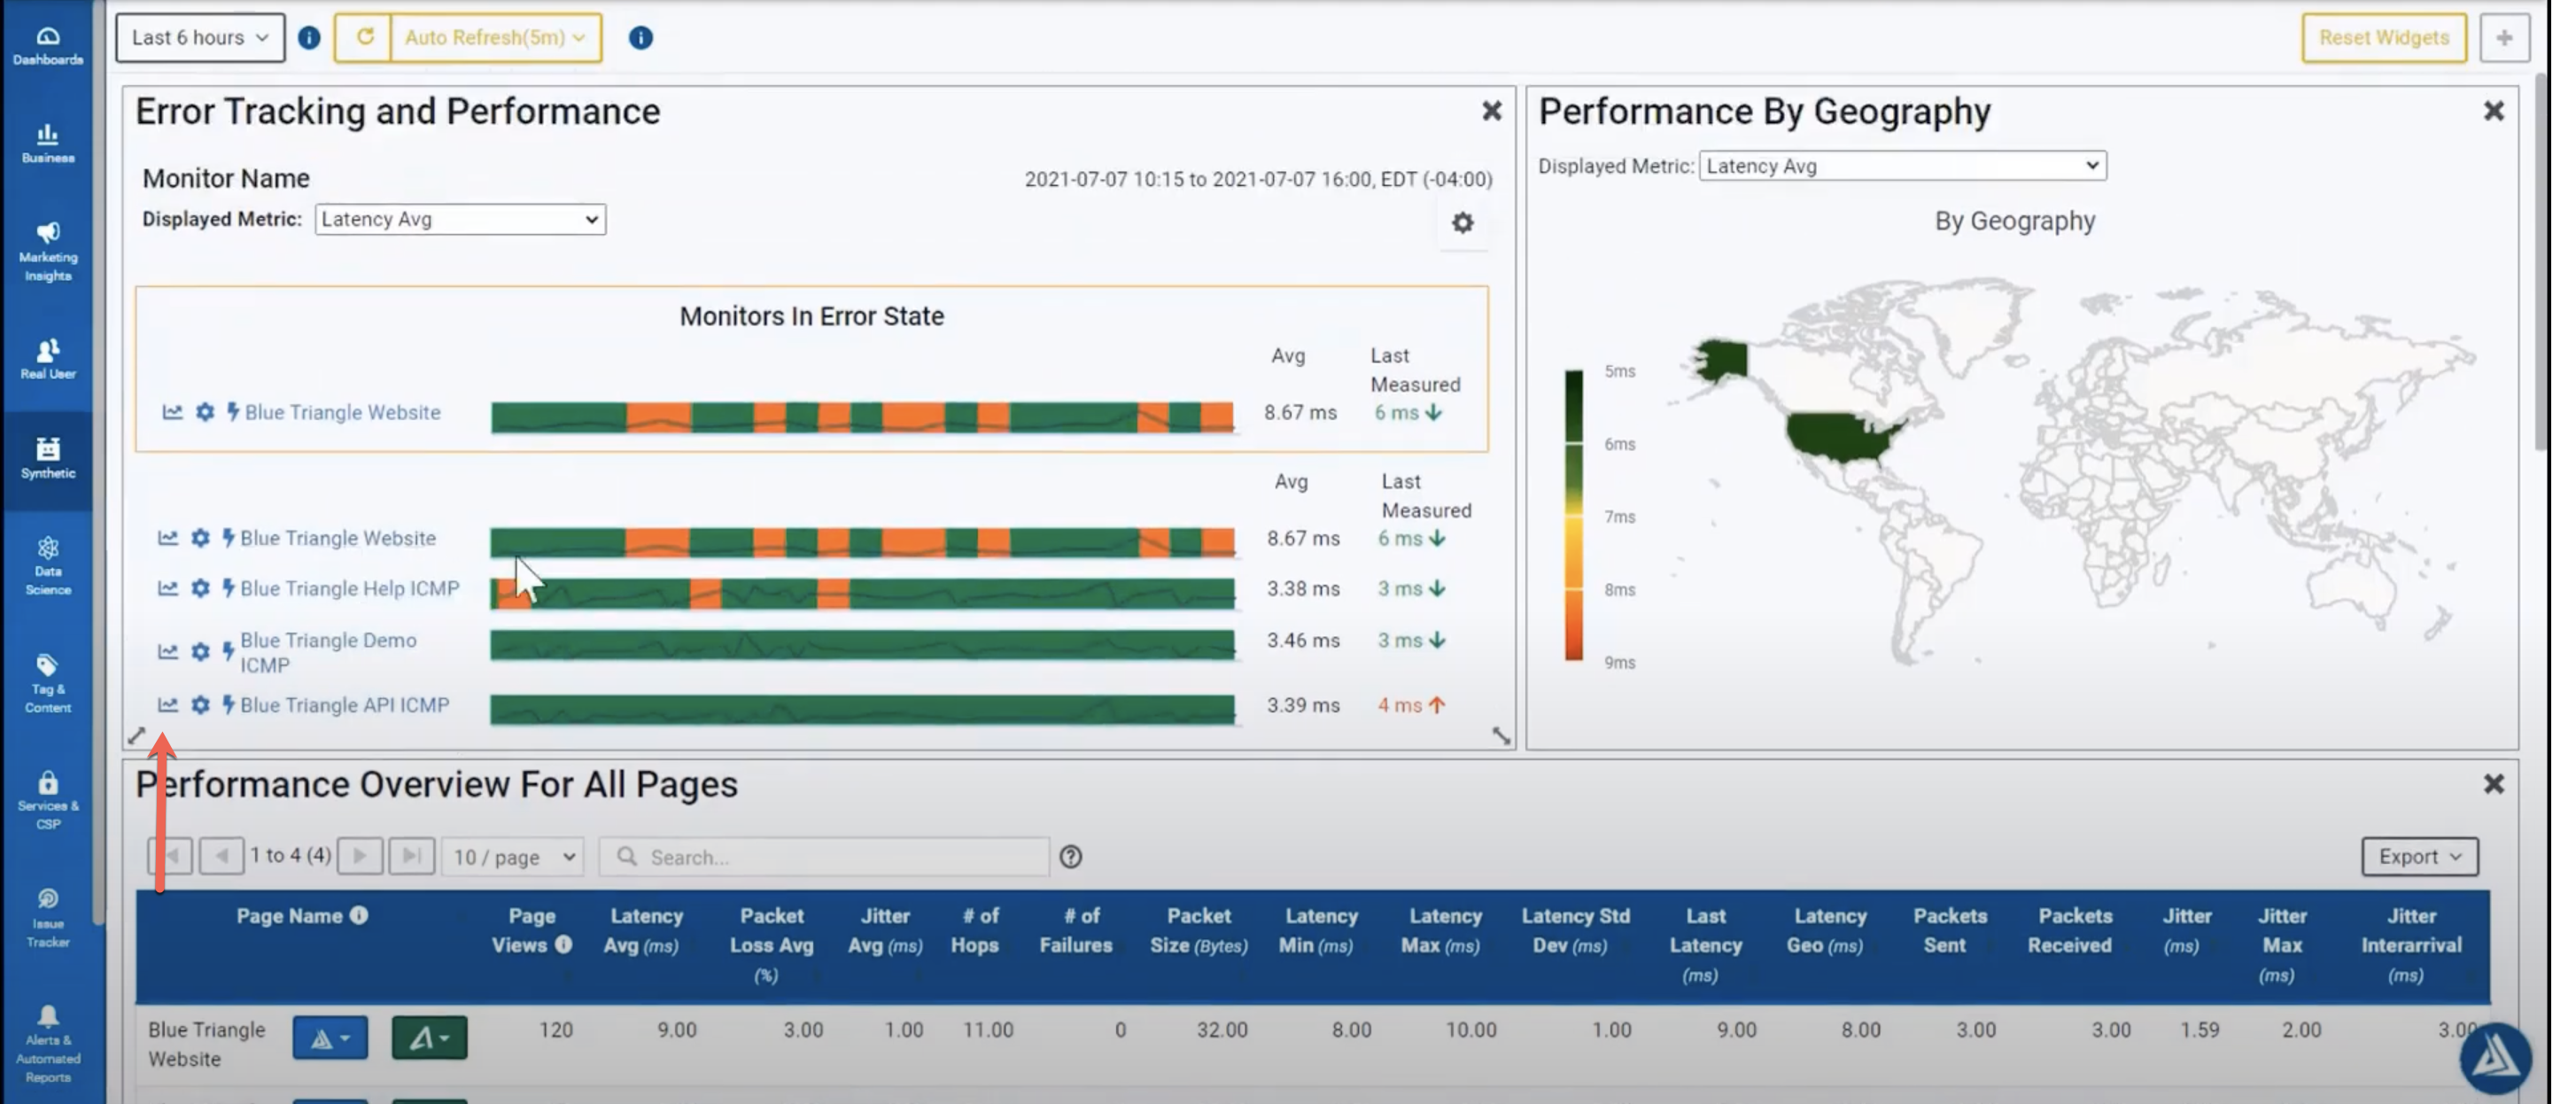
You can also view performance by location on the map. If you scroll to the bottom of the page you will see an overview for all of the metrics in a table for each monitor.
Drill in for more detail on the Test Results page
If you hover over the red area in your Monitor you will be able to identify the issue, which in this case is high packet loss. You can click to 'drill in' to a more detailed page with more information on the measurements.

Once you have clicked the measurement it will bring you to the page displayed in the graphic below.
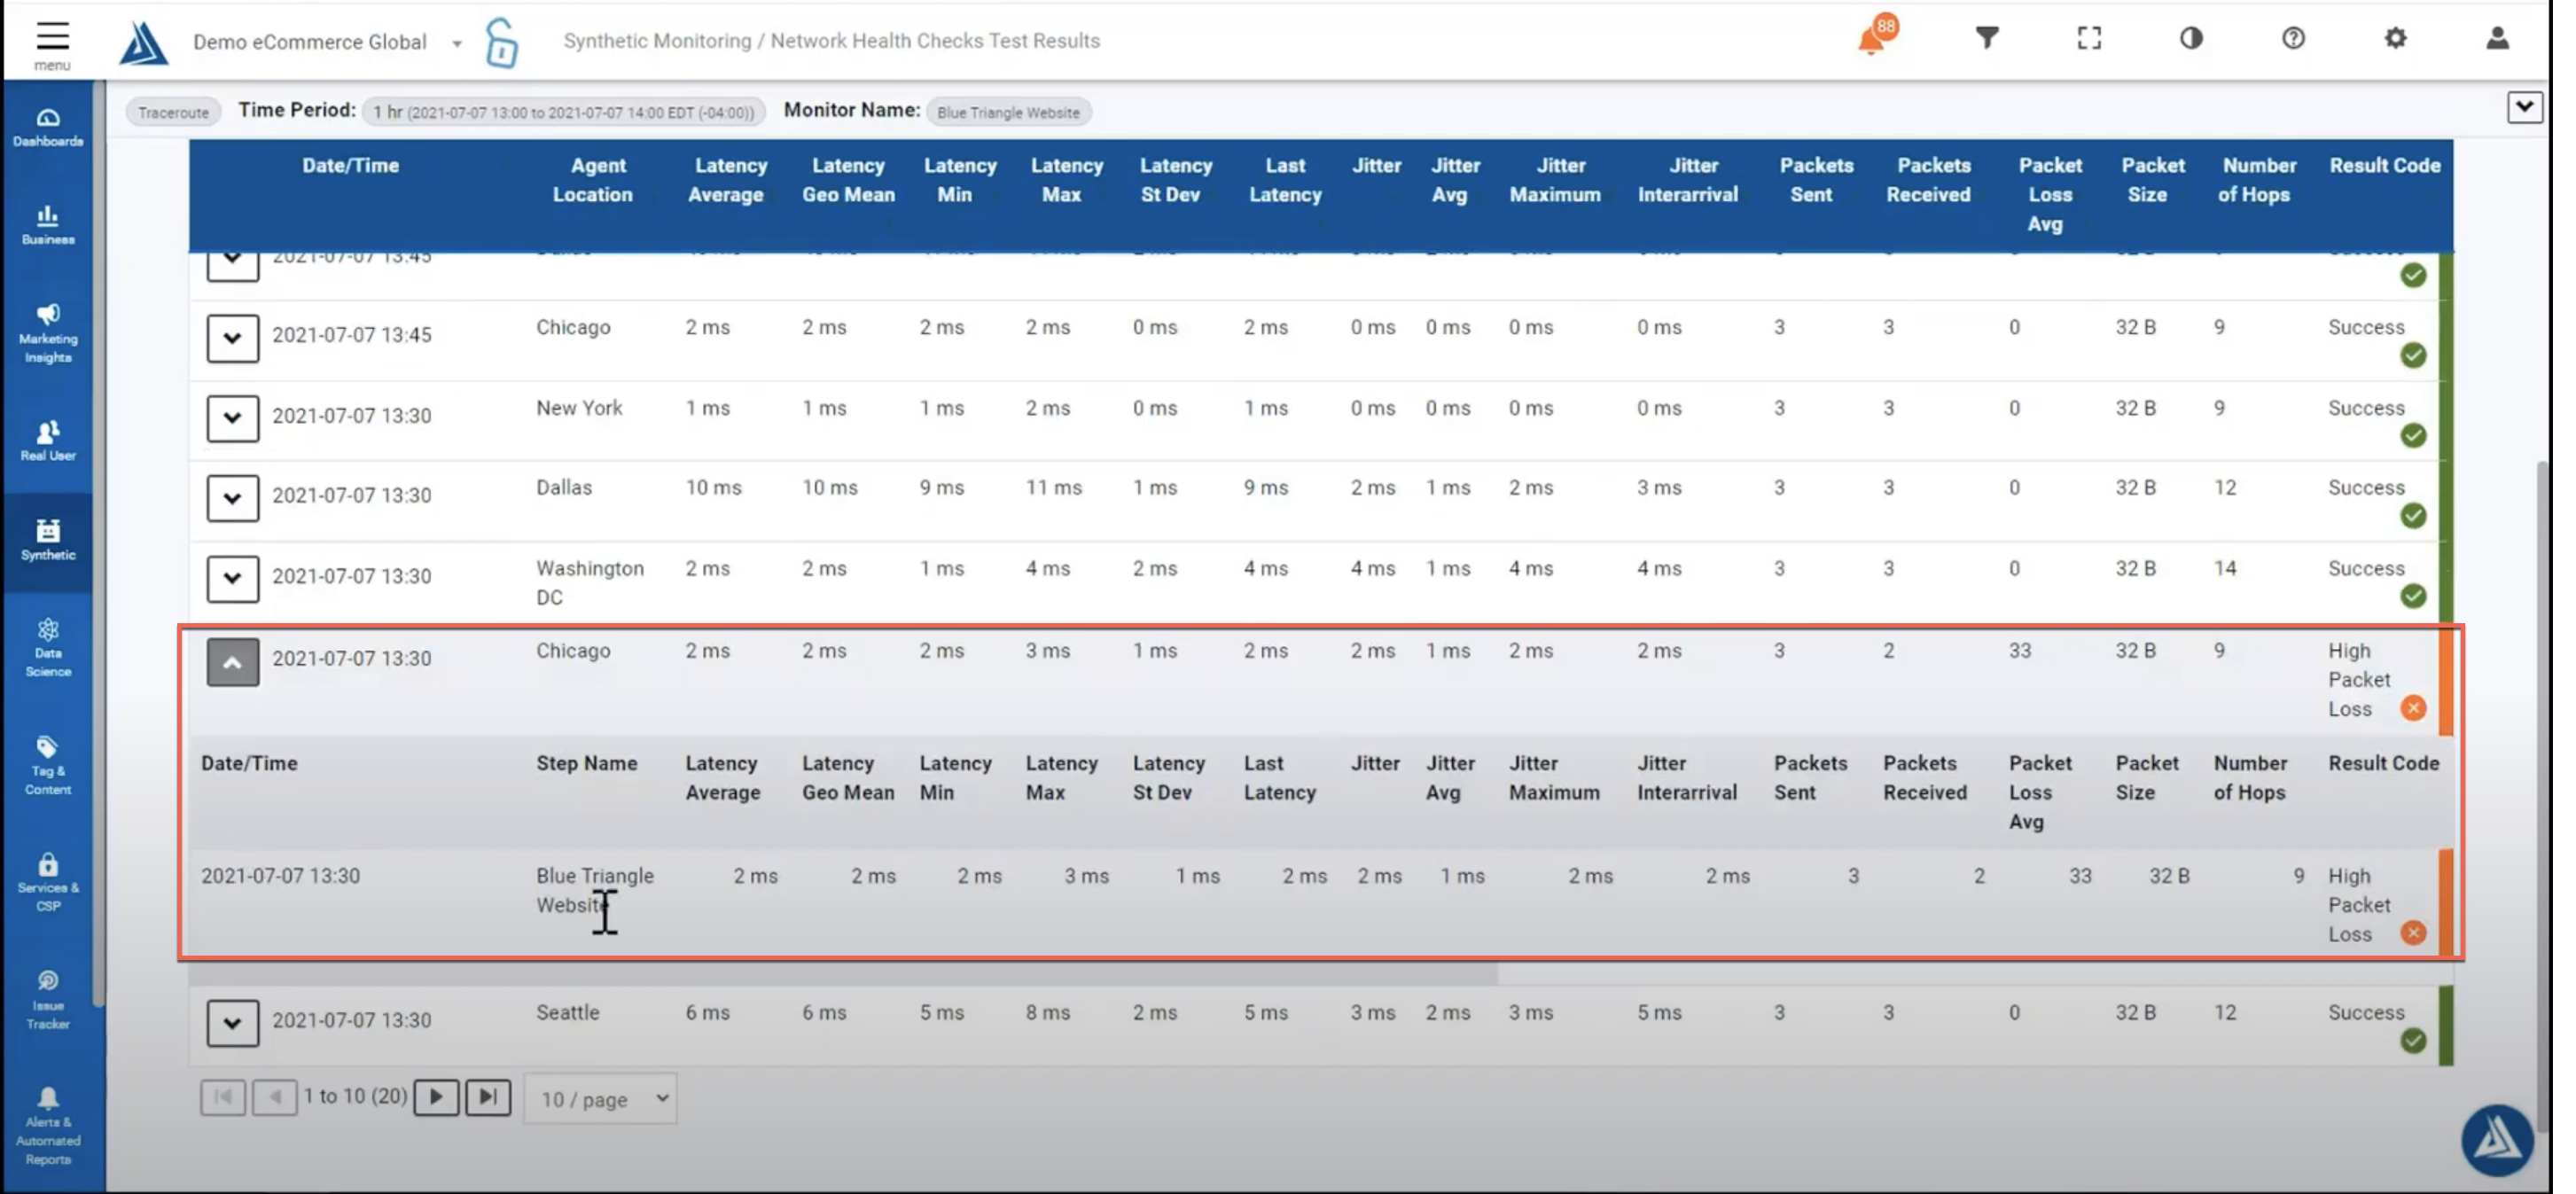
Here you can see that the measurement from Chicago displays a high packet loss of 33%.
Performance Detail Page
You can find your performance detail page on the left side of the screen under Synthetic > Network Health Checks > Performance Detail. This is a report style page as opposed to the dashboard. Here you can look at all of your monitors at once and see it as a whole.
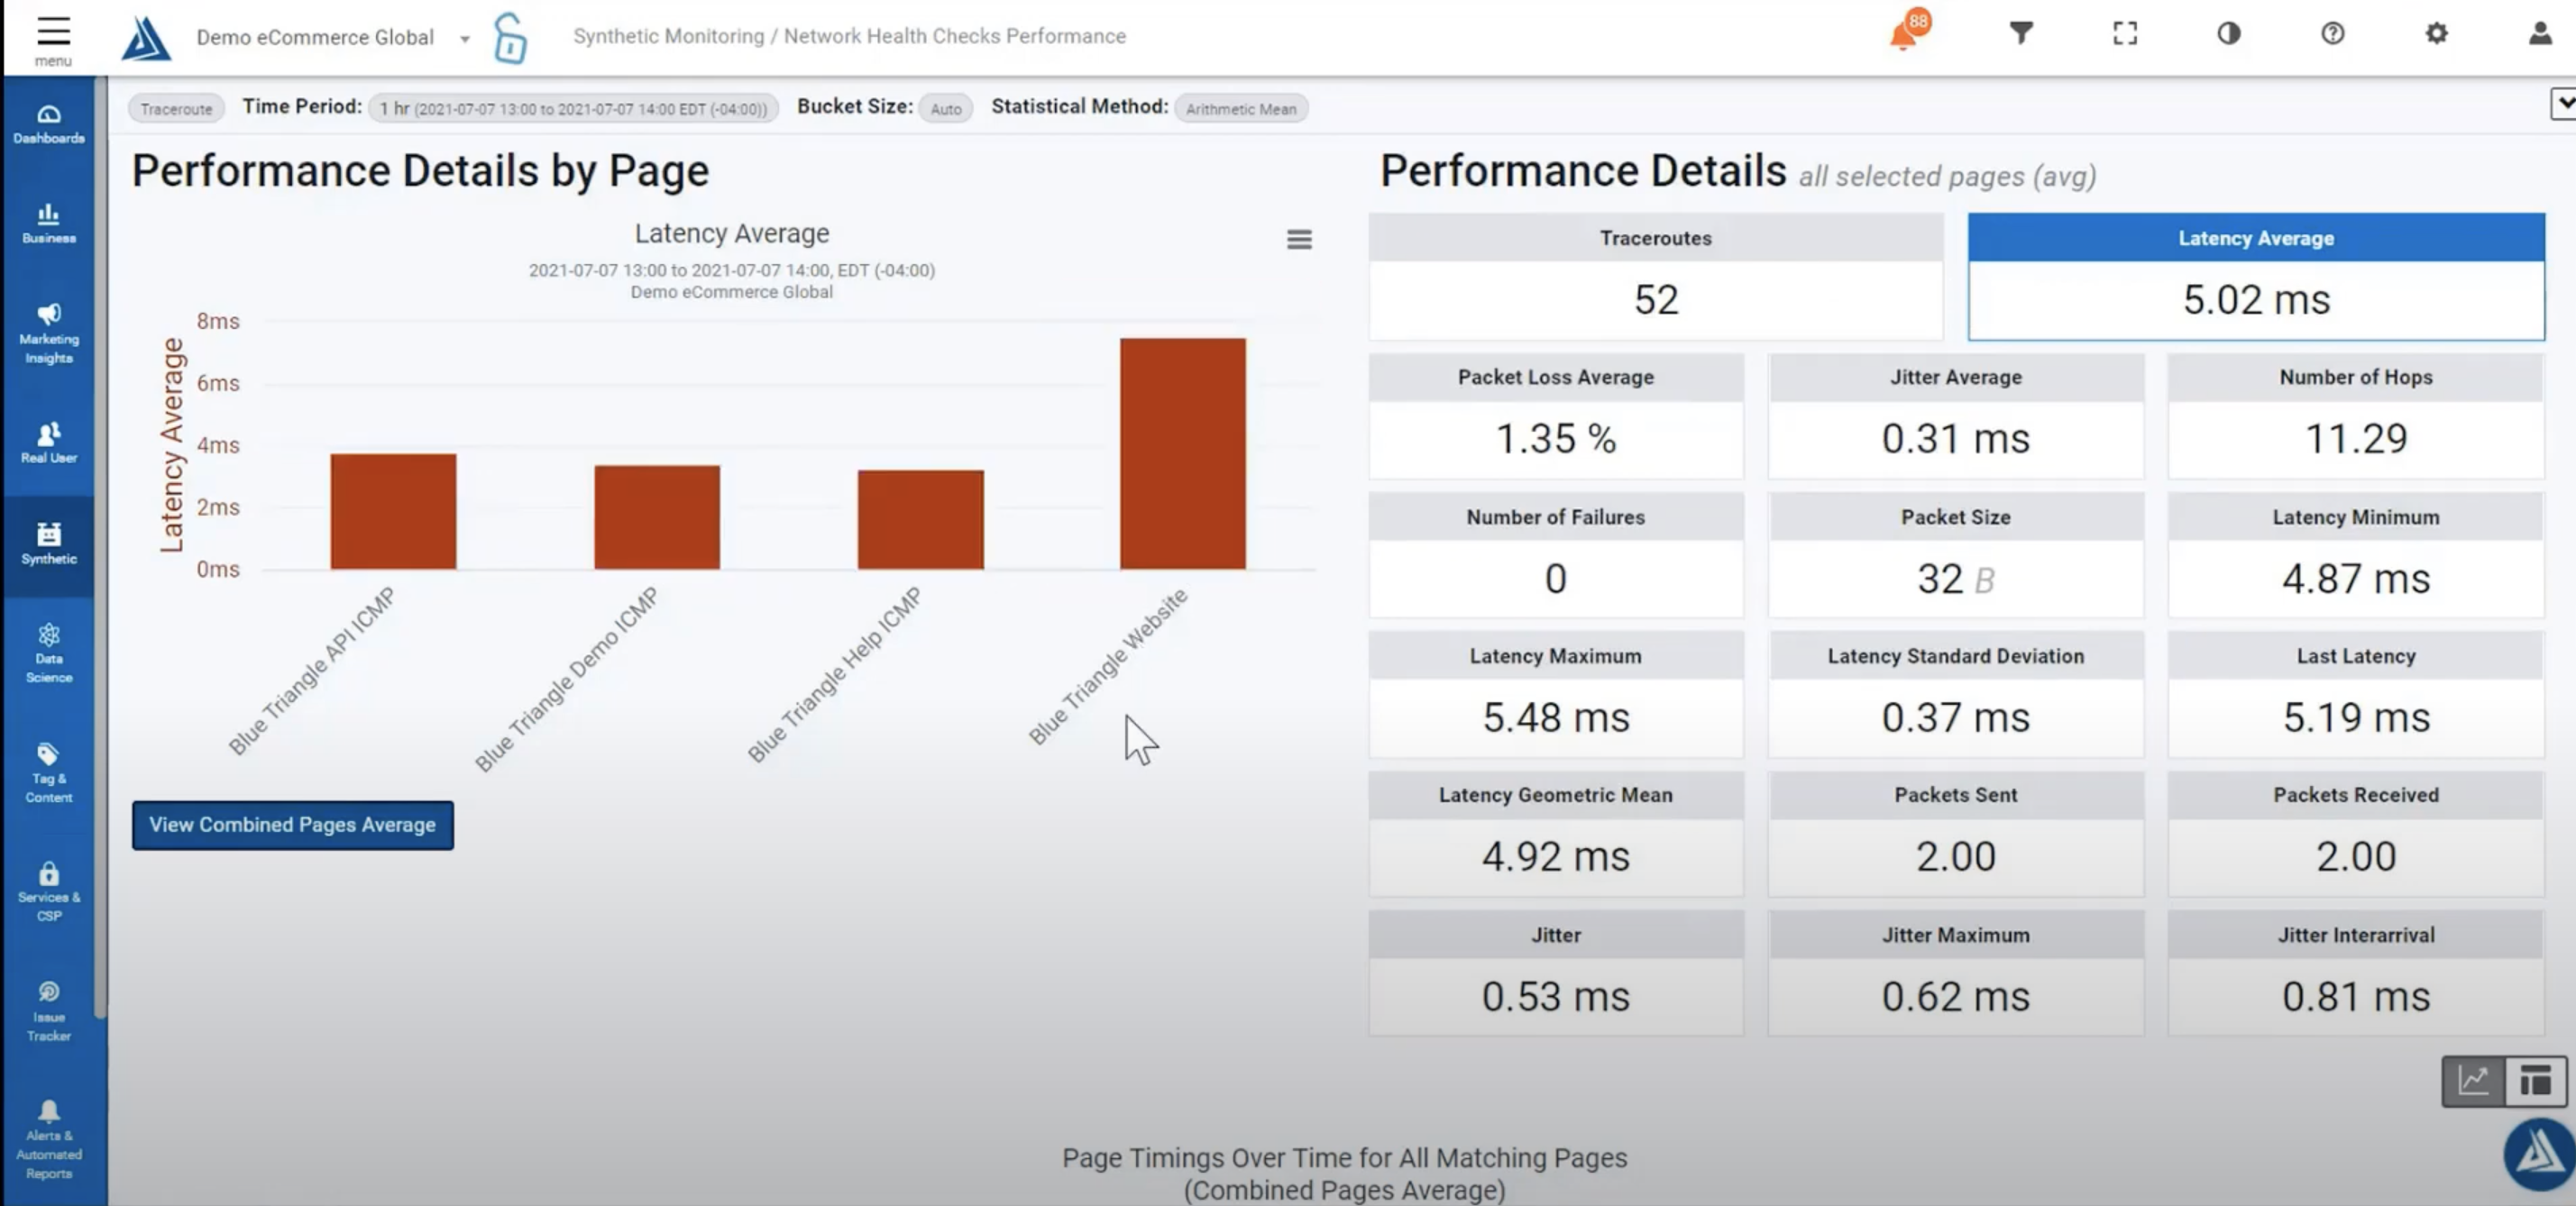
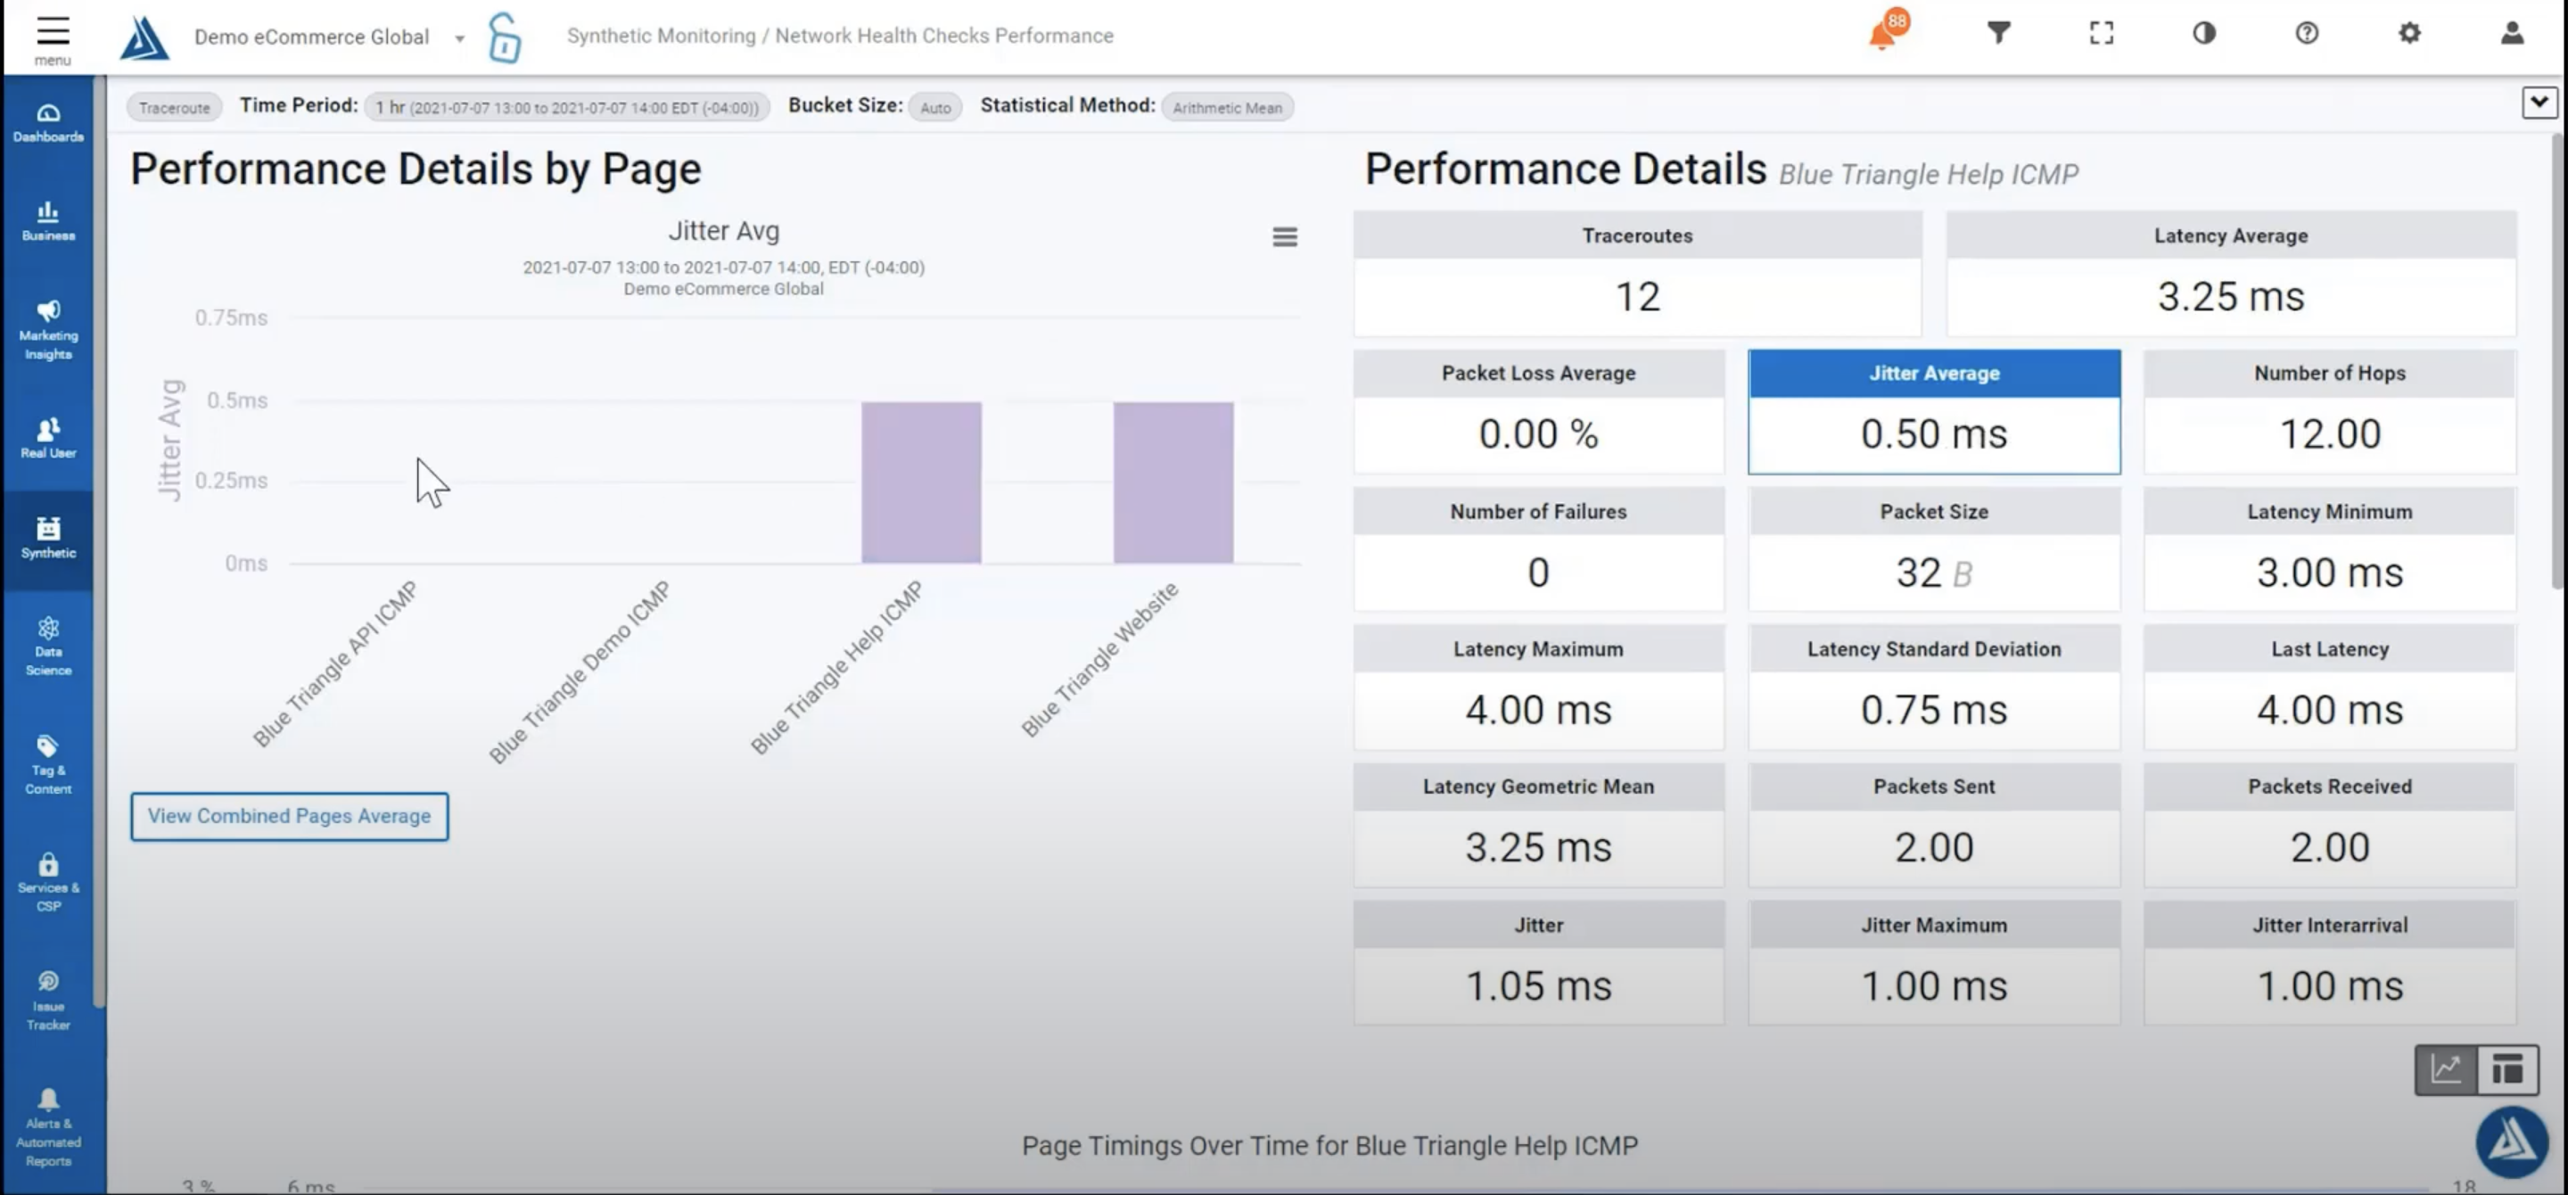
The numbers displayed on the right are an average of each of the various network health check monitors on the left. You are able to view the performance details for one particular monitor by clicking on it. You can also click on one of the cards to the right (Jitter Average for example) to update the bar chart to show that particular measurement, as shown in the graphic below.
If you scroll down further you will see a performance graph, a scatter plot displaying the actual measurements that ran, and the individual MTRs.
Dashboard Widgets
We have two new widgets to support this new data, Performance Over Time and Error Tracking and Performance for the Network Health Checks data. You are able to see a variety of metrics over time and filter this down to a specific monitor.
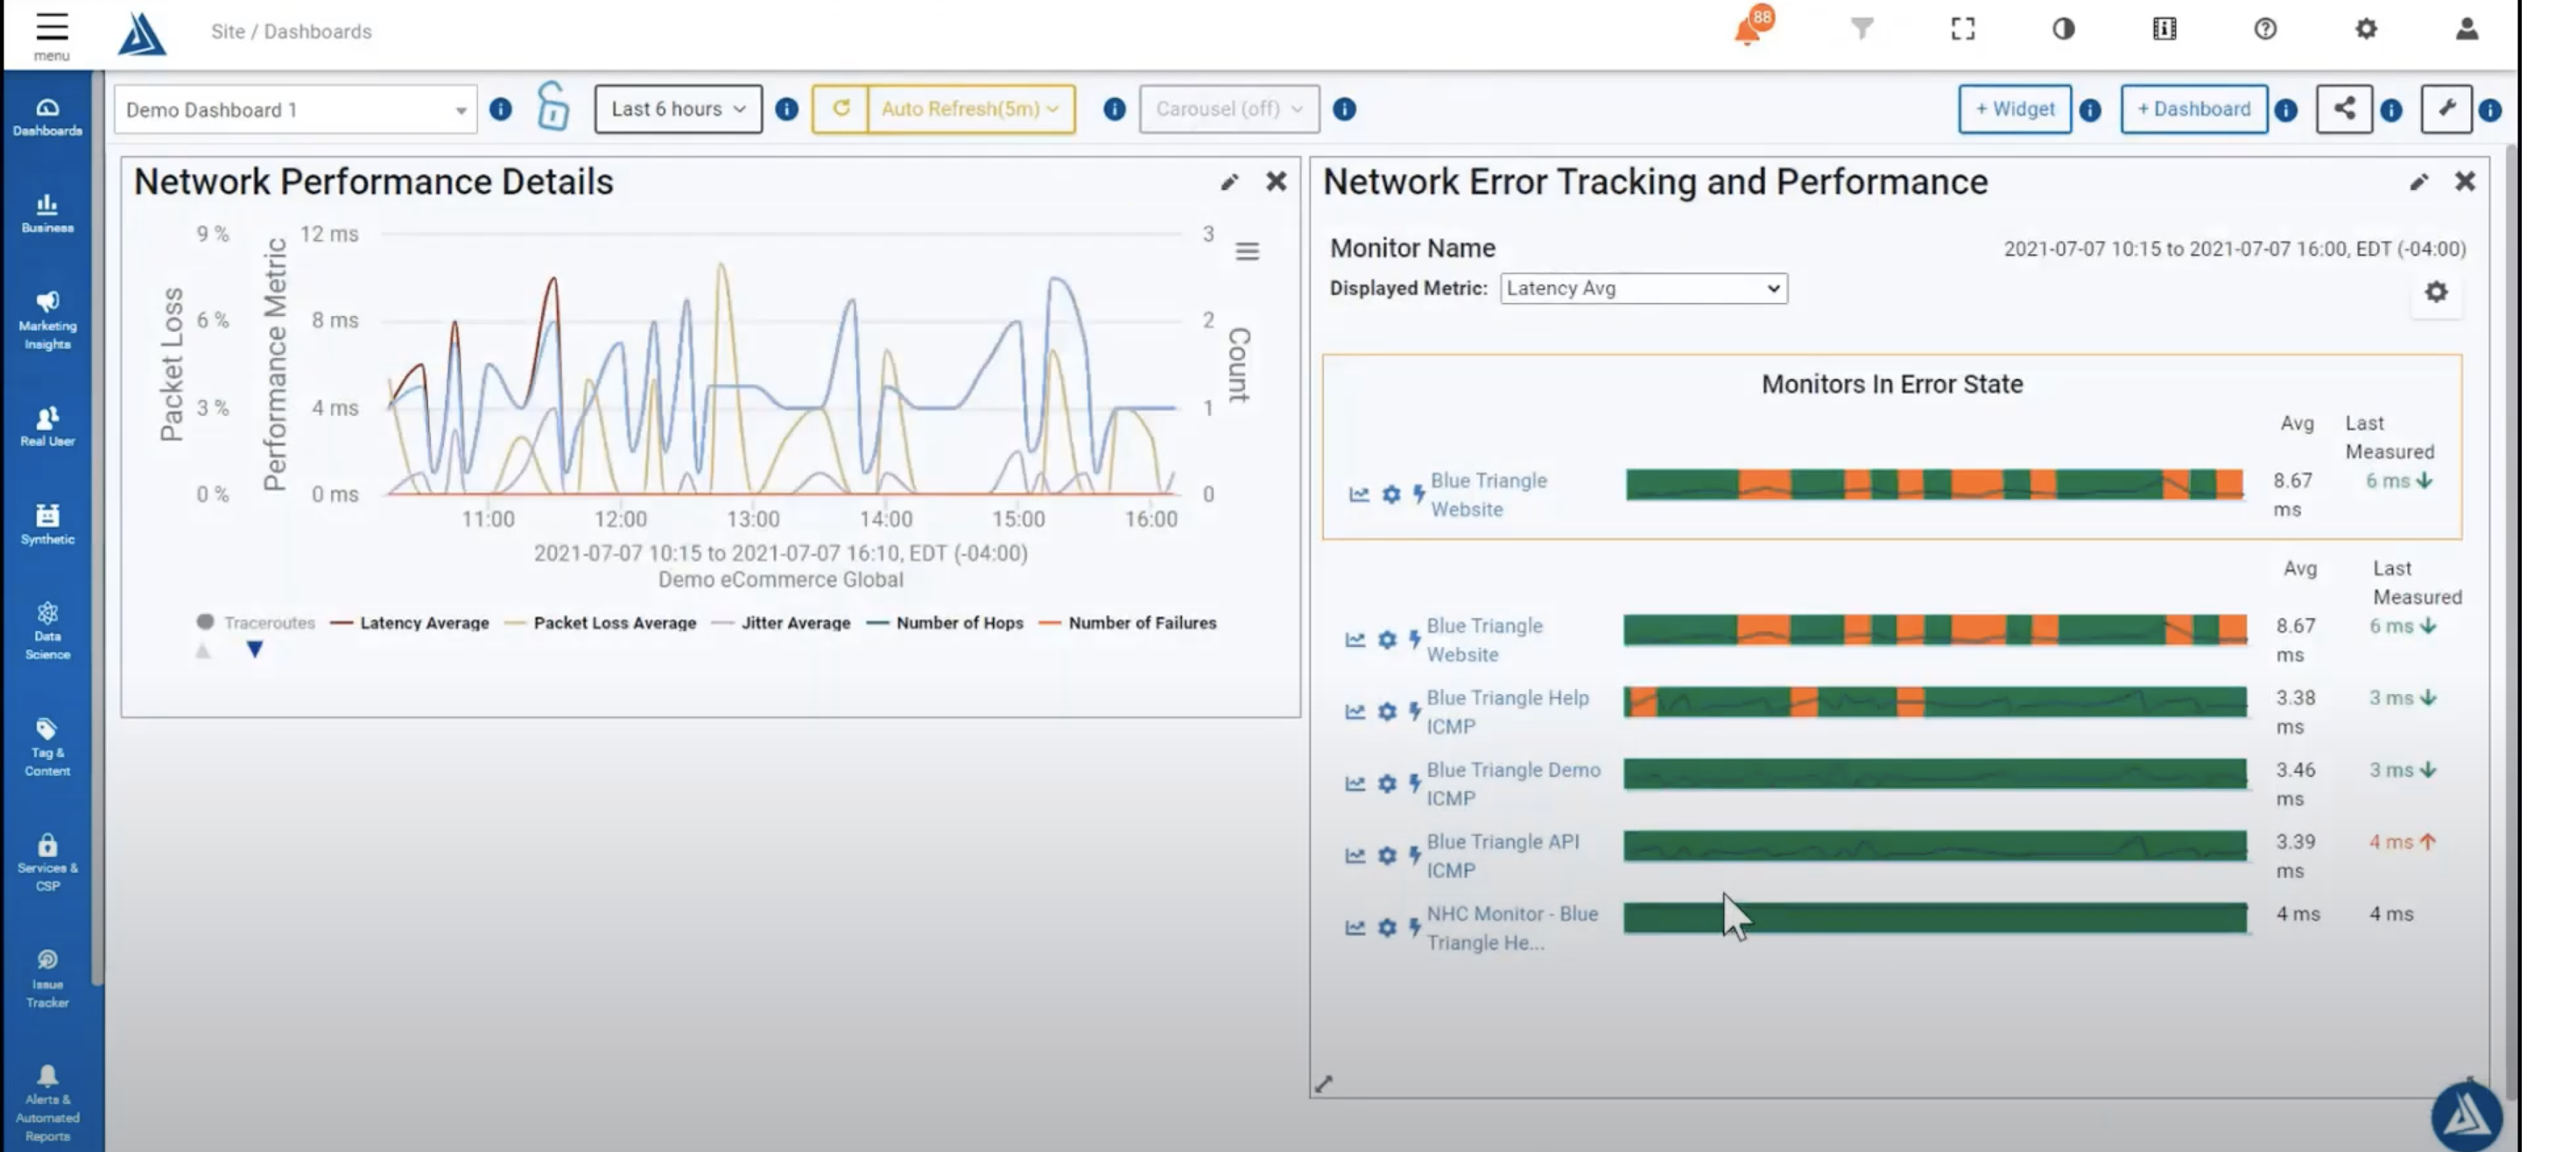
To set these up click the +Widget button at the top right of the screen, choose Synthetic widget type, then choose the Network Health Checks Performance and the Network Health Checks Error Tracking and Performance.

Comments
0 comments
Please sign in to leave a comment.