Summary
The Synthetic Base Page and SSL page is used for viewing the data for your Base Page and SSL, and Multi-step API Synthetic Monitors.
In this guide, learn how to
- use the Site Availability Graph
- use the Base Page Details bar graph and cards
- use the Performance Graph
- use the Page View Scatter Plots
- filter the data using the filter menu
Site Availability Graph
- The graph at the top shows site availability trended over time for the selected synthetic monitor. With this graph you’ll be able to tell what kind of errors are occurring with the lines for each type of possible error.

Base Page Details
- The bar graph and the cards below show you the high-level overview of metrics during the time period selected, in this case, the past 24 hours.

- You will also see the SSL Certificate Expire Date for your domain.
- You can click any of the other performance metric cards in the right to update the bar graph on the left.
Performance Graph
- Moving down the screen we see the Performance Graph. This shows all of your metrics trended across the time period.

- You can click each metric in the legend to enable or disable the metrics in the graph.
- To see this data in a table click the button below to Toggle the Base Page Table.

Scatter Plots
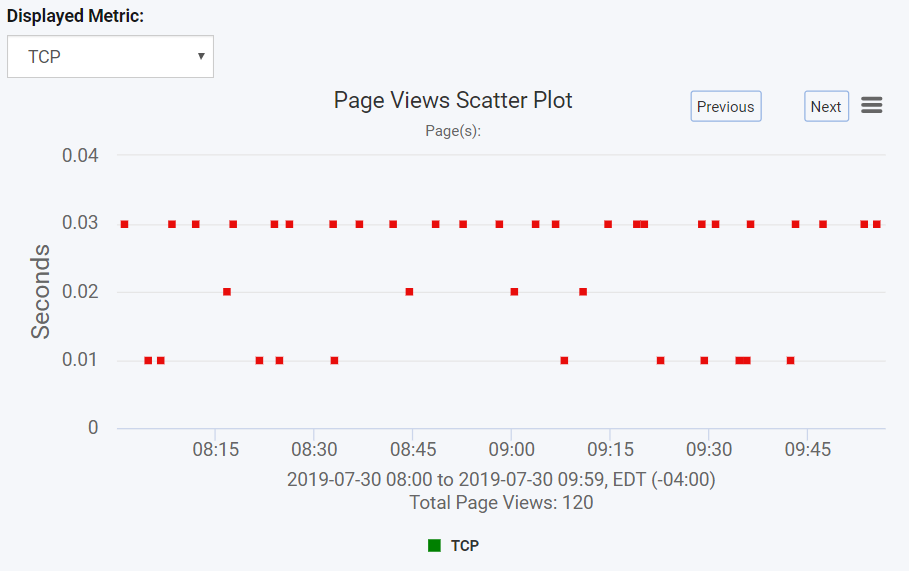
- Below there are two scatter plots.
- The scatter plot to the left shows the timings for each synthetic measurement taken.

- Notice the time-frame in the scatter plot corresponds to the shaded region in the performance graph above.
- Click a different section of the graph to see the measurements during that time frame below.
- Clicking a point in the scatter plot to the left allows you to drill in to that measurement for more detail in the scatter plot to the right
- The scatter plot to the right shows you each page in that measurement, whether it’s just a base page hit or multi-step api test.
Filters
- As always, you can change the time period for the page at the top.

- If you want to filter down the data by script name or page name or agent location, you can do all of that and more by clicking the filter icon in the top right.


Comments
0 comments
Please sign in to leave a comment.